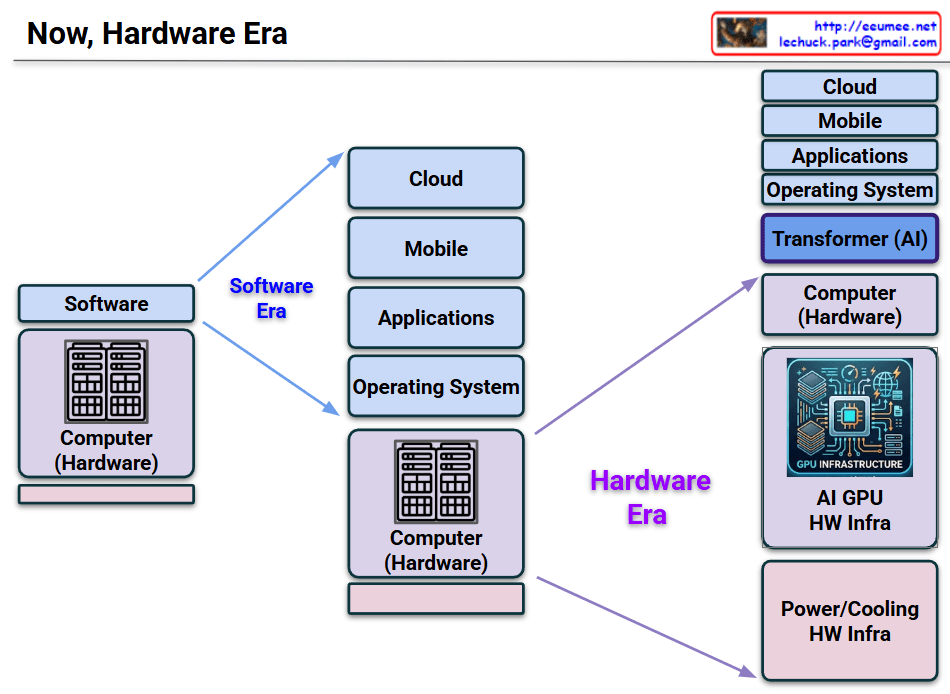
Energy Storage & Backup Power


Energy Storage & Backup Power Comparison

This infographic provides a comprehensive overview of energy storage and backup power technologies used in mission-critical infrastructures like data centers. As you move from left to right, the response time increases, but the backup duration also significantly extends.

1. Supercapacitor (Ultracapacitor)

  • Energy Principle: Electrostatic charge (Physical)
  • Primary Purpose: Micro-spike & voltage sag defense (di/dt mitigation)
  • Response Time: Sub-millisecond (< 1ms)
  • Discharge Duration: Milliseconds to seconds
  • Key Advantages: Ultra-high Power Density (kW), infinite cycle life
  • Limitations: Low energy density, high self-discharge rate
  • Deployment: In-Rack / Node Level (e.g., OCP server boards)

2. Flywheel (FES – Flywheel Energy Storage)

  • Energy Principle: Kinetic energy (Mechanical / Rotational)
  • Primary Purpose: Short-term ride-through & seamless transition
  • Response Time: Milliseconds (ms)
  • Discharge Duration: Seconds to ~1 minute
  • Key Advantages: No battery degradation, eco-friendly, low maintenance
  • Limitations: High CAPEX, extremely short backup duration
  • Deployment: Row / Room Level (Used as an alternative or paired with UPS)

3. UPS (BESS-based)

  • Energy Principle: Chemical reaction (Li-ion / VRLA)
  • Primary Purpose: Power quality conditioning & short-term backup
  • Response Time: Zero (Online Double-Conversion) to ms
  • Discharge Duration: 5 ~ 15 minutes
  • Key Advantages: Stable voltage/frequency, proven reliability
  • Limitations: Battery thermal runaway risk, degradation (SOH – State of Health)
  • Deployment: Facility Level (Data Hall Power Room)

4. ESS (Large-scale BESS)

  • Energy Principle: Chemical reaction (Large-scale Li-ion)
  • Primary Purpose: Peak shaving, energy arbitrage, grid services
  • Response Time: Seconds to minutes (BMS/PCS dependent)
  • Discharge Duration: 2 ~ 4+ hours
  • Key Advantages: High Energy Density (kWh), load flexibility
  • Limitations: Large physical footprint, heavy floor loading, fire hazard
  • Deployment: Site / Grid Level (Exterior, near substation)

5. Genset (Generator Set)

  • Energy Principle: Fossil fuel combustion (Internal combustion)
  • Primary Purpose: Long-term definitive backup power
  • Response Time: 10 ~ 15 seconds (Startup & synchronization)
  • Discharge Duration: Days (Continuous with fuel supply)
  • Key Advantages: Guaranteed large-capacity power for extended outages
  • Limitations: Carbon emissions, noise/vibration, delayed startup
  • Deployment: Site Exterior / Rooftop

Summary of the Spectrum

The hierarchy demonstrates a “Layered Defense” strategy for power reliability:

  • Immediate (ms): Supercapacitors and Flywheels handle transient spikes and sags.
  • Short-term (mins): UPS systems bridge the gap until secondary power kicks in.
  • Long-term (hours/days): ESS manages energy efficiency, while Gensets provide the final safety net for prolonged outages.

#EnergyStorage #BackupPower #DataCenter #UPS #BESS #Flywheel #Supercapacitor #Genset #EnergyEfficiency #PowerReliability #ElectricalEngineering #SmartGrid #EnergyManagement #TechInfographic #Infrastructure

With Gemini

Autonomous Facility Operation Optimization Pipeline


Autonomous Facility Operation Optimization Pipeline

This pipeline represents a sophisticated 5-stage workflow designed to transition facility management from manual oversight to full AI-driven autonomy, ensuring reliability through hybrid modeling.

1. Integrated Data Ingestion & Preprocessing

  • Role: Consolidates diverse data streams into a synchronized, high-fidelity format by eliminating noise.
  • Key Components: Sensor time-series data, DCIM integration, Event log parsing, Outlier filtering, and TSDB (Time Series Database).

2. Hybrid Analysis Engine

  • Role: Eliminates analytical blind spots by running physical laws, machine learning predictions, and expert knowledge in parallel.
  • Key Components: Physics-Informed Machine Learning (PIML), Anomaly Detection, RUL (Remaining Useful Life) Prediction, and RAG-enhanced Ground Truth analysis.

3. Decision Fusion & Prescription

  • Role: Synthesizes multi-track analysis to move beyond simple alerts, generating specific, actionable “prescriptions.”
  • Key Components: Decision Fusion, Prescriptive Action, LLM-based Prescription, and Priority Scoring to rank urgency.

4. Operation Application & Feedback Loop

  • Role: Establishes a closed-loop system that measures success rates post-execution to continuously refine models.
  • Key Components: Success Rate Tracking, RCA (Root Cause Analysis), Model Retraining, and Physics/Rule updates based on real-world performance.

5. Phased Control Automation

  • Role: A risk-mitigated transition of control authority from humans to AI based on accumulated performance data.
  • Automation Levels:
    • L1. Assistant Mode: System provides guides only; 100% human execution.
    • L2. Semi-Autonomous: System prepares optimized values; human provides final approval.
    • L3. Fully Autonomous: System operates without human intervention (triggered when success rate >90%).

Strategic Insight

The hallmark of this architecture is the integration of Physics-Informed ML and LLM-based reasoning. By combining the rigid reliability of physical laws with the adaptive reasoning of Large Language Models, the pipeline solves the “black box” problem of traditional AI, making it suitable for mission-critical infrastructures like AI Data Centers.

#DataCenter #AIOps #AutonomousInfrastructure #PhysicsInformedML #DigitalTwin #LLM #PredictiveMaintenance #DataCenterOptimization #TechVisualization #SmartFacility #EngineeringExcellence

2 GPU Throttling

This image is a Visual Engineering diagram that contrasts the fundamental control mechanisms of Power Throttling and Thermal Throttling at a glance, specifically highlighting the critical impact thermal throttling has on the system.


1. Philosophical and Structural Contrast (Top Section)

The diagram places the two throttling methods side-by-side, clearly distinguishing them not just as similar performance limiters, but as mechanisms with completely different operational philosophies.

  • Left: Power Throttling
    • Operational Boundary: Indicates that this acts as a safety line, keeping the system operating ‘normally’ within its designed power limits.
    • Feedforward Control (Proactive): Specifies that this is a proactive control method that restricts input (power demand) before a negative result occurs, fundamentally preventing the issue from happening.
  • Right: Thermal Throttling
    • Emergency Fallback: Shows that this is not a normal operational state, but a ‘last line of defense’ triggered to prevent physical destruction.
    • Feedback Control (Reactive): Emphasizes that this is a reactive control method that drops clock speeds only after detecting the result (high heat exceeding the safe threshold).

2. Four Fatal Risks of Thermal Throttling (Bottom Tree Structure)

The core strength of the diagram lies in placing the sub-tree structure exclusively under Thermal Throttling. This highlights that this phenomenon goes beyond a simple performance drop, breaking down its complex, detrimental impacts on the infrastructure into four key factors:

  1. Physics & Hardware Degradation: Refers to direct damage to semiconductors (silicon) and the shortening of their lifespan (MTBF) due to the accumulated stress of high heat.
  2. Straggler Effect: Points out the bottleneck phenomenon in environments like distributed AI training. A delay in a single, thermally throttled node drags down the synchronization and data processing speed of the entire cluster.
  3. Thermal Inertia & Thermal Oscillations: Describes the unstable fluctuation of system performance. Because heat does not dissipate instantly (thermal inertia), the system repeatedly drops and recovers clock speeds, causing the performance to oscillate.
  4. Cooling Failure Indicator: Acts as a severe alarm. It implies that the issue extends beyond a hot chip—it indicates that the facility’s infrastructure, such as the rack-level Direct Liquid Cooling (DLC) capacity, has reached its physical limit or experienced an anomaly.

Overall Summary:

The diagram logically and intuitively delivers a powerful core message: “Power Throttling is a normal, proactive control within predictable bounds, whereas Thermal Throttling is a severe, reactive warning at both the hardware and infrastructure levels after control is lost.” It is an excellent piece of work that elegantly structures complex system operations using concise text and layout.

#DataCenter #AIInfrastructure #GPUCooling #ThermalThrottling #PowerThrottling #HardwareEngineering #HighPerformanceComputing #LiquidCooling #SystemArchitecture

DC Data Service Model


DC Data Service Model Overview

This diagram outlines the evolutionary roadmap of a Data Center (DC) Data Service Model. It illustrates how data center operations advance from basic monitoring to a highly autonomous, AI-driven environment. The model is structured across three functional pillars—Data, View, and Analysis—and progresses through three key service tiers.

Here is a breakdown of the evolving stages:

1. Basic Tier (The Foundation)

This is the foundational level, focusing on essential monitoring and billing.

  • Data: It begins with collecting Server Room Data via APIs.
  • View: Operators use a Server Room 2D View to track basic statuses like room layouts, rack placement, power consumption, and temperatures.
  • Analysis: The collected data is used to generate a basic Usage Report, primarily for customer billing.

2. Enhanced Tier (Real-time & Expanded Scope)

This tier broadens the monitoring scope and provides deeper operational insights.

  • Data: Data collection is expanded beyond the server room to include the Common Facility (Data Extension).
  • View: The user interface upgrades to a dynamic Dashboard that displays real-time operational trends.
  • Analysis: Reporting evolves into an Analysis Report, designed to extract deeper insights and improve overall service value.

3. The Bridge: Data Quality Up

Before transitioning to the ultimate AI-driven tier, there is a critical prerequisite layer. To effectively utilize AI, the system must secure data of High Precision & High Resolution. High-quality data is the fuel for the advanced services that follow.

4. Premium Tier (AI Agent as the Ultimate Orchestrator)

This is the ultimate goal of the model. The updated diagram highlights a clear, sequential flow where each advanced technology builds upon the last, culminating in a comprehensive AI Agent Service:

  • AI/ML Service: The high-quality data is first processed here to automatically detect anomalies and calculate optimizations (e.g., maximizing cooling and power efficiency).
  • Digital Twin: The analytical insights from the AI/ML layer are then integrated into a Digital Twin—a virtual, highly accurate replica of the physical data center used for real-time simulation and spatial monitoring.
  • AI Agent Service: This is the final and most critical layer. The AI Agent does not just sit alongside the other tools; it acts as the central brain. Through this final Agent Service, the capabilities of all preceding services are expanded and put into action. By leveraging the predictive power of the AI/ML models and the comprehensive visibility of the Digital Twin, the AI Agent can autonomously manage, resolve issues, and optimize the data center, maximizing the ultimate value of the entire data pipeline.

#DataCenter #DCIM #AIAgent #DigitalTwin #MachineLearning #ITOperations #TechInfrastructure #FutureOfTech #SmartDataCenter

Cooling Changes

The provided image illustrates the evolution of data center cooling methods and the corresponding increase in risk—specifically, the drastic reduction of available thermal buffer space—categorized into three stages.

Here is a breakdown of each cooling method shown:

1. Air Cooling

  • Method: The most traditional approach, providing room-level cooling with uncontained airflow.
  • Characteristics: The physical space of the server room acts as a sponge for heat. Because of this, there is an ample “Thermal Buffer” utilizing the floor space. If the cooling system fails, it takes some time for temperatures to reach critical levels.

2. Hot/Cold Aisle Containment

  • Method: Physically separates the cold intake air from the hot exhaust air to prevent them from mixing.
  • Characteristics: Focuses on Airflow Optimization. It significantly improves cooling efficiency by directing and controlling the airflow within enclosed spaces.

3. Direct Liquid Cooling (DLC)

  • Method: A high-density, chip-level cooling approach that brings liquid coolant directly to the primary heat-generating components (like CPUs or GPUs).
  • Characteristics: While cooling efficiency is maximized, there is Zero Thermal Buffer. There is absolutely no thermal margin provided by surrounding air or room volume.

💡 Core Implication (The Red Warning Box)

The ultimate takeaway of this slide is highlighted in the bottom right corner.

In a DLC environment, a loss of cooling triggers thermal runaway within 30 seconds. This speed fundamentally exceeds human response limits. It is no longer feasible for a facility manager to hear an alarm, diagnose the issue, and manually intervene before catastrophic failure occurs in modern, high-density servers.


Summary

  • Evolution of Efficiency: Data center cooling is shifting from broad, room-level air cooling to highly efficient, chip-level Direct Liquid Cooling (DLC).
  • Loss of Thermal Buffer: This transition completely eliminates the physical thermal margin, meaning there is zero room for error if the cooling system fails.
  • Automation is Mandatory: Because DLC cooling loss causes thermal runaway in under 30 seconds—faster than humans can react—AI-driven, automated operational agents are now essential to protect infrastructure.

#DataCenter #DataCenterCooling #DirectLiquidCooling #ThermalRunaway #AIOps #InfrastructureManagement

With Gemini

Data Center Changes

The Evolution of Data Centers

This infographic, titled “Data Center Changes,” visually explains how data center requirements are skyrocketing due to the shift from traditional computing to AI-driven workloads.

The chart compares three stages of data centers across two main metrics: Rack Density (how much power a single server rack consumes, shown on the vertical axis) and the overall Total Power Capacity (represented by the size and labels of the circles).

  • Traditional DC (Data Center): In the past, data centers ran at a very low rack density of around 2kW. The total power capacity required for a facility was relatively small, at around 10 MW.
  • Cloud-native DC: As cloud computing took over, the demands increased. Rack densities jumped to about 10kW, and the overall facility size grew to require around 100 MW of power.
  • AI DC: This is where we see a massive leap. Driven by heavy GPU workloads, AI data centers push rack densities beyond 100kW+. The scale of these facilities is enormous, demanding up to 1GW of power. The red starburst shape also highlights a new challenge: “Ultra-high Volatility,” meaning the power draw isn’t stable; it spikes violently depending on what the AI is processing.

The Three Core Challenges (Bottom Panels)

The bottom three panels summarize the key takeaways of transitioning to AI Data Centers:

  1. Scale (Massive Investment): Building a 1GW “Campus-scale” AI data center requires astronomical capital expenditure (CAPEX). To put this into perspective, the chart notes that just 10MW costs roughly 200 billion KRW (South Korean Won). Scaling that to 1GW is a colossal financial undertaking.
  2. Density (The Need for Liquid Cooling): Power density per rack is jumping from 2kW to 100kW—a 50x increase. Traditional air-conditioning cannot cool servers running this hot, meaning the industry must transition to advanced liquid cooling technologies.
  3. Volatility (Unpredictable Demands): Unlike traditional servers that run at a steady hum, AI GPU workloads change in real-time. A sudden surge in computing tasks instantly spikes both the electricity needed to run the GPUs and the cooling power needed to keep them from melting.

Summary

  • Data centers are undergoing a massive transformation from Traditional (10MW) and Cloud (100MW) models to gigantic AI Data Centers requiring up to 1 Gigawatt (1GW) of power.
  • Because AI servers use powerful GPUs, power density per rack is increasing 50-fold (up to 100kW+), forcing a shift from traditional air cooling to advanced liquid cooling.
  • This AI infrastructure requires staggering financial investments (CAPEX) and must be designed to handle extreme, real-time volatility in both power and cooling demands.

#DataCenter #AIDataCenter #LiquidCooling #GPU #CloudComputing #TechTrends #TechInfrastructure #CAPEX

With Gemini