AI OPERATION LEARNING

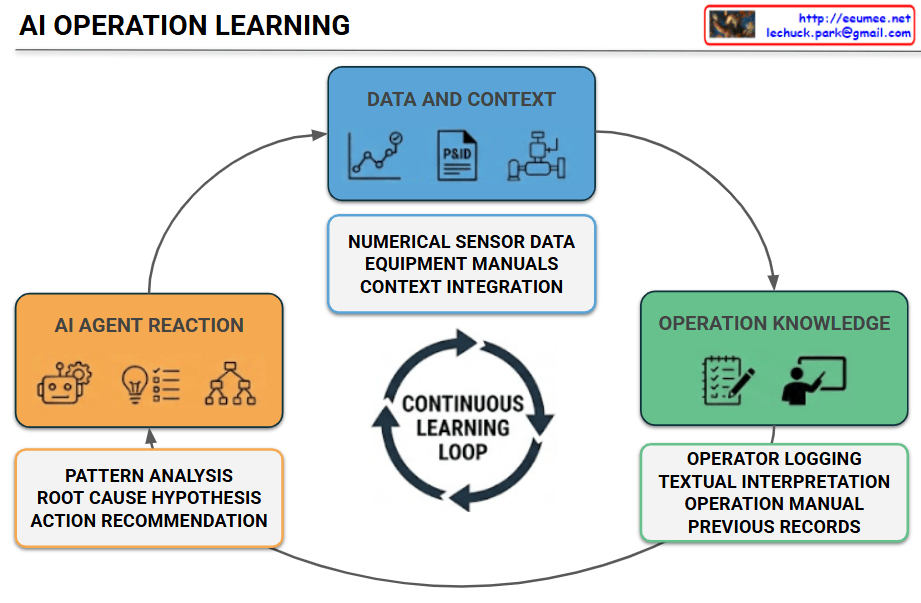
The provided image visualizes an architecture diagram titled “AI OPERATION LEARNING”, demonstrating how three core areas interact in a continuous cyclical workflow connected by circular arrows.

  • Data and Context (Top Cyan Box): Positioned as the starting point at the top, featuring icons of line graphs, P&ID schematics, and system blocks. The sub-box specifies Numerical Sensor Data, Equipment Manuals, and Context Integration, indicating that real-time sensor variations are paired with physical equipment documentation.
  • Operation Knowledge (Right Green Box): Accompanied by icons of a notepad with a pen and a presenting instructor. The lower sub-box outlines Operator Logging, Textual Interpretation, Operation Manual, and Previous Records, representing the stage where human operators record textual interpretations by referencing past logs and manuals.
  • AI Agent Reaction (Left Orange Box): Features icons of a robot face, a lightbulb representing ideas, and a decision tree structure. The lower sub-box lists Pattern Analysis, Root Cause Hypothesis, and Action Recommendation, showing how the AI analyzes data and suggests optimal countermeasures based on accumulated records.
  • Continuous Learning Loop (Center): Located right in the middle of the diagram with circular arrow loops, emphasizing that the process forms an endless virtuous cycle where the AI agent continuously learns and evolves through these operational steps.

Summary

The image cleanly summarizes an intelligent industrial operation learning cycle where numerical data shifts trigger operator text logging, which in turn feeds AI agent analysis and recommendation in an ongoing, self-improving loop.

#AIOperation #SmartFactory #ConditionMonitoring #KnowledgeManagement #AIAgent #ContinuousLearning #IndustrialAI

With Gemini
Metric Changes : Raw to Intelligent

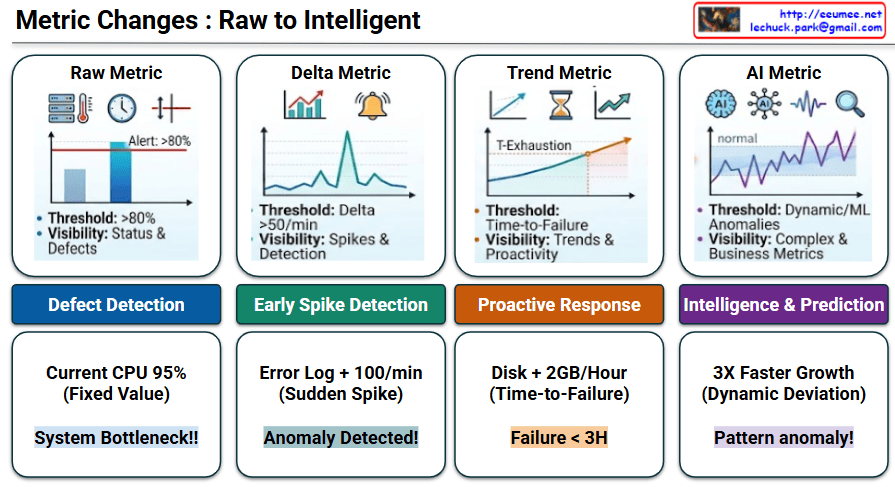
This image, titled “Metric Changes : Raw to Intelligent,” illustrates the evolution of IT system monitoring and data analysis across four progressive stages. Moving from left to right, it demonstrates how systems transition from basic, reactive alert mechanisms to smart, predictive operations.

Stage-by-Stage Description

  • Stage 1: Raw Metric
    • Concept: This is the most fundamental monitoring method. It relies on a static, fixed threshold (e.g., Alert: >80%). The primary focus is on basic visibility regarding current status and defects.
    • Goal: Defect Detection
    • Example: If the current CPU usage hits a fixed value of 95%, the system immediately flags it as a “System Bottleneck!!”
  • Stage 2: Delta Metric
    • Concept: Moving beyond static numbers, this stage monitors the rate of change (Delta). It tracks how rapidly a metric fluctuates over a specific timeframe (e.g., Delta >50/min) to catch sudden spikes.
    • Goal: Early Spike Detection
    • Example: If error logs experience a sudden spike of +100 per minute, the system recognizes this rapid change and triggers an “Anomaly Detected!” alert.
  • Stage 3: Trend Metric
    • Concept: This stage utilizes historical data to forecast the future. Instead of a hard number, the threshold becomes “Time-to-Failure.” It calculates the trajectory to determine the exact point of resource exhaustion (T-Exhaustion).
    • Goal: Proactive Response
    • Example: By observing that a disk is filling up at a rate of +2GB/Hour (Time-to-Failure), the system proactively warns that a “Failure < 3H” (failure in less than 3 hours) is imminent.
  • Stage 4: AI Metric
    • Concept: The most advanced stage, utilizing Machine Learning (ML) and Artificial Intelligence. It establishes dynamic thresholds by learning what a “normal” baseline looks like, enabling it to detect complex anomalies and deviations from standard business metrics.
    • Goal: Intelligence & Prediction
    • Example: If a metric exhibits 3X Faster Growth—which acts as a Dynamic Deviation from its learned normal state—the AI intelligently diagnoses it as a “Pattern anomaly!”

📝 Summary

This infographic perfectly visualizes the roadmap of monitoring systems. It highlights the paradigm shift from merely reacting to fixed thresholds, to understanding rates of change and future trends, and ultimately utilizing AI for dynamic, autonomous prediction and intelligent anomaly detection.

#DataAnalysis #SystemMonitoring #AIOps #ArtificialIntelligence #MachineLearning #AnomalyDetection #TrendAnalysis #ITInfrastructure

With Gemini

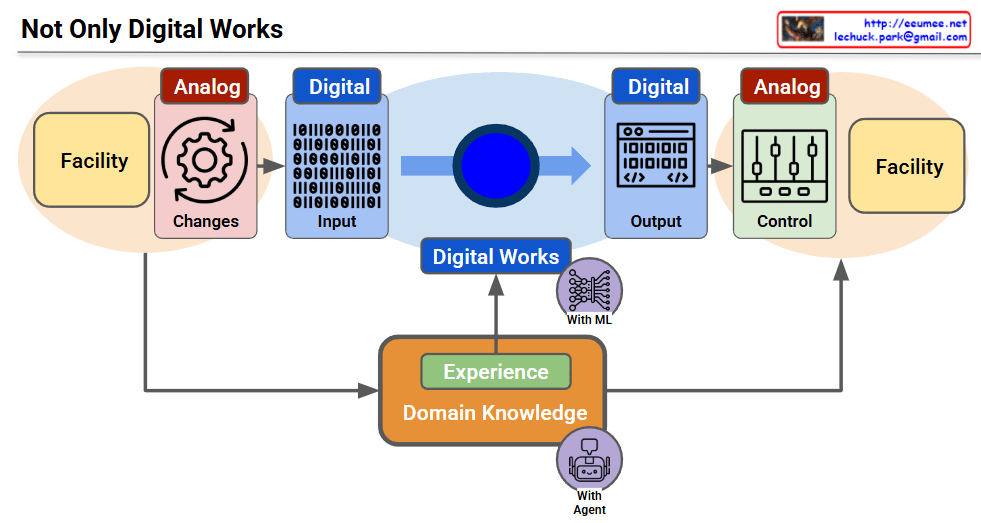
Not Only Digital Works

This diagram, titled “Not Only Digital Works,” illustrates how the physical analog world and the digital realm interact to form a complete closed-loop architecture.

The overall flow of the image is as follows:

  • Phase 1: Analog to Digital (Data Collection) The system detects analog Changes occurring in the physical Facility on the left. These analog signals are then converted into binary digital Input data (represented by 0s and 1s) and transmitted to the central system.
  • Phase 2: Digital Computation Powered by Domain Knowledge (Core Processing) The transmitted data is processed in the central Digital Works area. This is where the core philosophy of the diagram is revealed. Rather than relying solely on raw data computation, the system actively integrates field Experience and Domain Knowledge from the bottom section. This expertise is combined with Machine Learning (With ML) technologies to elevate simple calculations into intelligent analysis.
  • Phase 3: Digital to Analog (Intelligent Control) Once the analysis is complete, a digital Output is generated. This data is translated back into analog Control signals to operate the actual physical Facility on the right. During this step, an AI Agent (With Agent)—empowered by the embedded domain knowledge—steps in to execute precise, autonomous control over the physical infrastructure.

📝 Summary

The diagram showcases the architecture of a Cyber-Physical System (CPS) where facility statuses are converted into digital data, processed, and cycled back as control signals. The core message it emphasizes is that “true intelligent automation is not achieved merely through software computation (Digital Works), but is only realized when deep field ‘Experience’ and ‘Domain Knowledge’ are seamlessly integrated with Machine Learning and AI Agents.”The diagram showcases the architecture of a Cyber-Physical System (CPS) where facility statuses are converted into digital data, processed, and cycled back as control signals. The core message it emphasizes is that “true intelligent automation is not achieved merely through software computation (Digital Works), but is only realized when deep field ‘Experience’ and ‘Domain Knowledge’ are seamlessly integrated with Machine Learning and AI Agents.”

#NotOnlyDigitalWorks #CyberPhysicalSystems #DigitalTransformation #DomainKnowledge #MachineLearning #AIAgent #InfrastructureAutomation #SmartFacility

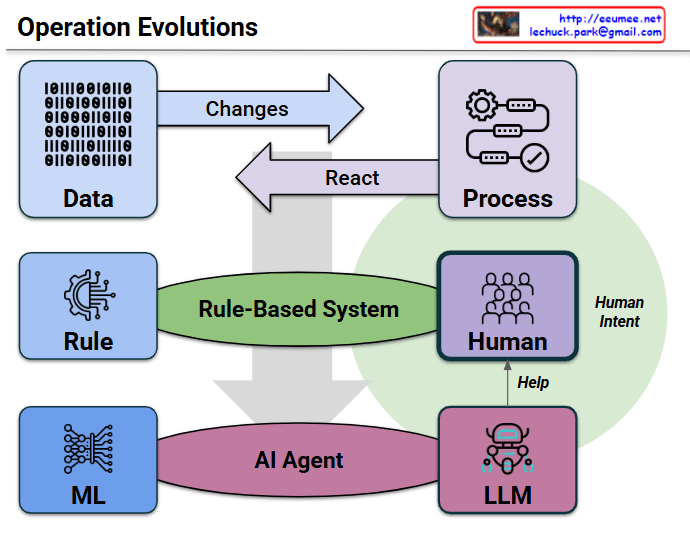
Operation Evolutions

This technical infographic, titled “Operation Evolutions,” elegantly maps out the paradigm shift in system and infrastructure management, moving from traditional manual workflows to advanced, AI-driven automation.

1. The Fundamental Loop (Top Layer)

At the very top, the diagram establishes the basic cycle of any operational system. “Data” (represented by binary code) undergoes “Changes,” which trigger a specific “Process.” Once the process executes, the system completes the loop via a “React” mechanism. This is the foundational input-output workflow.

2. The Traditional Paradigm (Middle Layer)

The middle section, centered around the green “Rule-Based System” oval, represents the legacy approach to operations. In this model, system actions are dictated by rigid, pre-defined “Rules.” When unexpected incidents occur or complex troubleshooting is required, the system relies heavily on manual “Human” intervention and analysis.

3. The Autonomous Shift (Bottom Layer)

A large, prominent downward arrow illustrates the structural evolution toward an “AI Agent” framework (the purple oval). In this next-generation architecture, static rules are replaced by adaptive “ML” (Machine Learning) models. More importantly, the heavy cognitive load previously placed entirely on human operators is now supported by an “LLM” (Large Language Model). This aligns perfectly with modern engineering goals of automating root cause analysis and streamlining incident resolution.

4. The Synergy of “Human Intent”

Perhaps the most crucial element is the large green circle labeled “Human Intent,” which encompasses the Process, Human, and LLM components. Additionally, there is a specific arrow pointing from the LLM up to the Human, labeled “Help.” This clearly communicates that AI agents and LLMs are not designed to replace engineers. Instead, they act as intelligent assistants that handle vast amounts of operational data, empowering human experts to focus on high-level architectural decisions and strategic oversight.

Summary

The diagram effectively captures the ongoing evolution of IT and infrastructure operations. It highlights the vital transition from rigid, rule-bound human management to an intelligent, AI-agent-driven ecosystem. In this new era, machine learning and large language models collaboratively assist human operators, ensuring that complex systems run efficiently while remaining firmly guided by human intent.

#AIAgent #AIOps #ITOperations #LLM #MachineLearning #InfrastructureAutomation #TechInfographic #SystemArchitecture

With Gemini

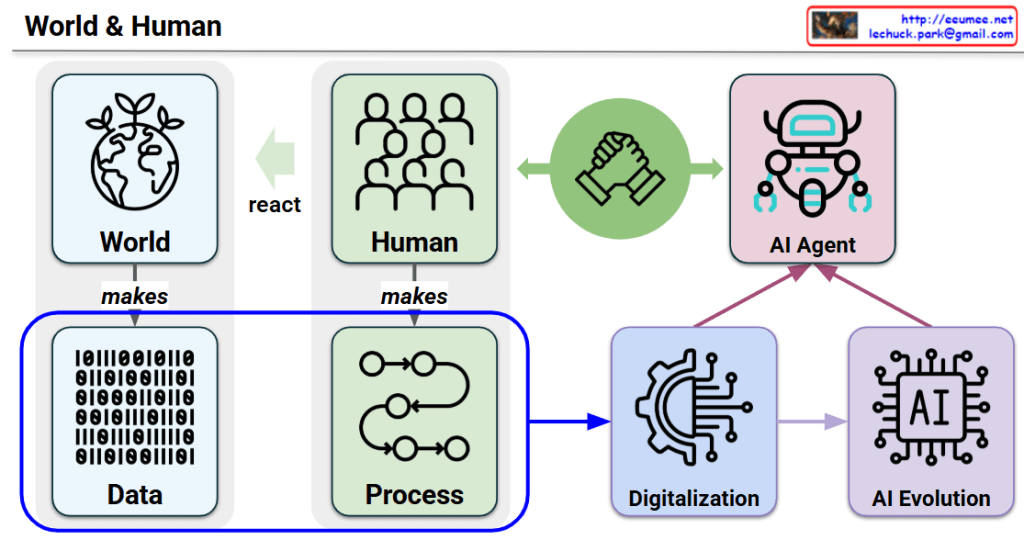
World & Human, and AI

Architectural Breakdown: World & Human

This diagram illustrates how the interactions between the world and humanity generate the fundamental assets (Data and Processes) that drive digitalization, leading to the evolution of AI and the ultimate realization of a collaborative AI Agent.

1. The Core Loop: World & Human

  • World -> Data (makes): The physical world continuously generates vast amounts of raw Data, symbolized by the binary code (0 and 1).
  • Human -> Process (makes): Human society organizes actions, workflows, and logic to create structured Processes.
  • Human -> World (react): Humans constantly observe, adapt, and react to the changing environment of the world, completing the foundational feedback loop.

2. The Engine of Value: Digitalization & AI Evolution

  • Digitalization: When the accumulated Data and structured Processes (enclosed in the blue boundary) are integrated, they undergo Digitalization, transforming manual workflows into automated, systemic operations.
  • AI Evolution: Digitalized systems provide the infrastructure and training ground for AI Evolution, moving from simple automation to advanced, self-learning AI architectures.

3. The Ultimate Goal: Human-AI Collaboration

  • AI Agent: The convergence of digitalization and AI evolution culminates in the creation of an autonomous AI Agent.
  • The Handshake (Partnership): The green bidirectional arrow and the handshake icon at the center emphasize that the ultimate destination of this evolution is not total automation or human replacement, but a symbiotic human-AI partnership where both entities collaborate seamlessly.

#AIAgent #DigitalTransformation #Digitalization #AIConversations #HumanAIPartnership #DataArchitecture #TechVisualization #AIEvolution #FutureOfWork #TechInfographics

With Gemini

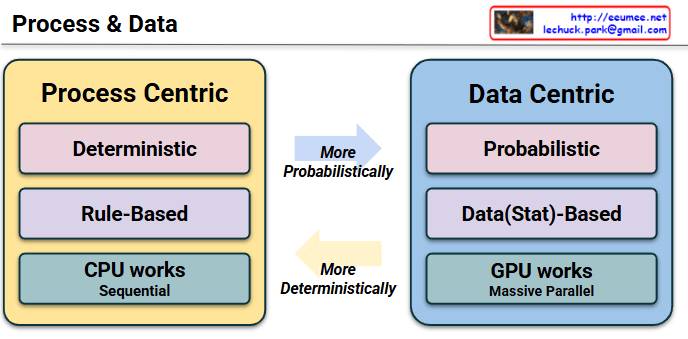
Process & Data

This slide, titled ‘Process & Data’, illustrates the technical differences between traditional computing environments and modern AI/data-centric environments, as well as the organic relationship between the two paradigms.

1. Left: Process Centric Paradigm

First, the yellow area labeled ‘Process Centric’ represents the realm of traditional software engineering that we have utilized for a long time.

  • Deterministic: It has a clear structure where identical inputs always yield 100% identical outputs.
  • Rule-Based: The system is controlled by algorithms and conditional statements (If-Then) defined in advance by developers.
  • CPU works / Sequential: All these processes rely on the sequential processing capabilities of a CPU, which executes instructions one by one in a step-by-step order.

2. Right: Data Centric Paradigm

On the other hand, the blue area labeled ‘Data Centric’ represents the paradigm pursued by modern machine learning, deep learning, and large-scale artificial intelligence (AI) systems.

  • Probabilistic: Rather than seeking a 100% perfect definitive answer, it infers the most likely ‘probability’ based on statistical evidence.
  • Data(Stat)-Based: Instead of fixed rules, it operates based on statistical patterns discovered by training on massive amounts of real-world data.
  • GPU works / Massive Parallel: It fundamentally requires a GPU architecture that performs massive parallel processing using thousands of cores to simultaneously train and infer enormous amounts of data.

3. Center: Paradigm Shift and Interaction (Arrows)

The most notable aspect is the two arrows located in the center. These systems are not isolated; they interact in a mutually complementary way.

  • Upward Arrow (More Probabilistically): This signifies the direction of evolving from a traditional rule-based system into a “more probabilistic and flexible” AI-based system (e.g., automation, predictive modeling) by integrating big data and high-performance GPU infrastructure.
  • Downward Arrow (More Deterministically): Conversely, this signifies the direction of securing system stability by converting complex and somewhat uncertain AI inference results or statistical data back into clear rules or formalized processes that humans can ultimately control (e.g., applying AI guardrails, cost optimization controls).

[Summary & Implications]

The core message of this slide is that the computing paradigm is expanding from traditional CPU-based, rule-centric computing (Process Centric) to GPU-based, massive data processing and probabilistic inference computing (Data Centric). To build a successful IT infrastructure, it is essential to understand the characteristics of both paradigms and properly connect them in both directions (More Probabilistically ↔ More Deterministically).

#ParadigmShift #DataCentric #ProcessCentric #AIInfrastructure #GPUComputing #ParallelProcessing #CPUvsGPU #ProbabilisticInference #RuleBasedSystem #ITArchitecture #DigitalTransformation

With Gemini

Silence Data Corruption

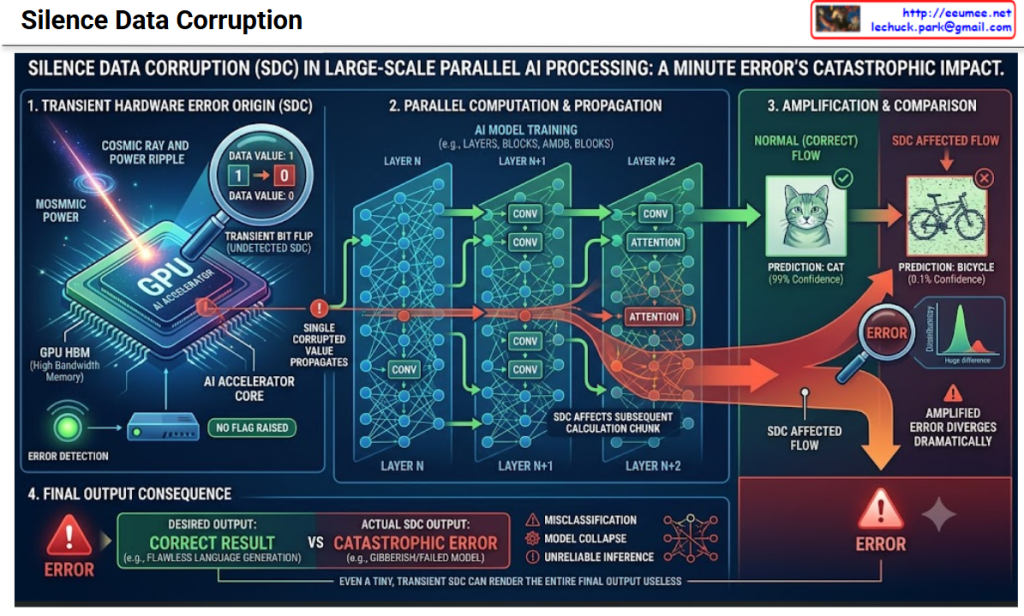
This infographic diagram illustrates the lifecycle of a single, minute, and transient error, showing how it goes undetected and exponentially amplifies through the layers of an AI model to cause a catastrophic final failure.

Step-by-Step Breakdown of the Diagram

The diagram is organized horizontally into four sequential stages, moving from the physical hardware level to the final AI application output.

Step 1: Transient Hardware Error Origin (SDC)

The leftmost section focuses on the physical cause of the error.

  • Context: We see a stylized GPU AI Accelerator and GPU HBM (High Bandwidth Memory), which represent the hardware infrastructure.
  • The Cause: An external physical event strikes the chip.
    • COSMIC RAY AND POWER RIPPLE: This represents high-energy particles from space or a minor voltage instability in the power supply. These events can deliver a tiny electrical charge to a critical component.
  • The Immediate Effect (Zoom in): This tiny charge hits a memory cell. As seen in the magnified view, it causes a TRANSIENT BIT FLIP (UNDETECTED SDC), instantly changing a data bit from 1 to 0.
  • The Essence of SDC (Red ‘!’): Crucially, the ERROR DETECTION sensor incorrectly assesses the situation, showing a green light and labeling it ‘NO FLAG RAISED.’ The system continues, unaware that the data has been corrupted. This is the ‘Silent’ aspect of SDC.

Step 2: Parallel Computation & Propagation

The central section illustrates how the corrupted value enters the AI model.

  • Structure: We see an AI MODEL TRAINING flow, distributed across massive parallel blocks (e.g., LAYERS, BLOCKS, AMDB, CONV, ATTENTION) like LAYER N, LAYER N+1, and LAYER N+2.
  • The Propagation Path:
    • Green Arrows (Normal Flow): Most of the data processed across the millions of nodes is correct.
    • Orange Arrows (SDC Affected Flow): The single flipped bit affects a small chunk of calculation in LAYER N. The diagram shows how this corruption (SDC AFFECTS SUBSEQUENT CALCULATION CHUNK) is passed on to LAYER N+1 and LAYER N+2, infecting and merging with a growing number of subsequent nodes as it progresses.

Step 3: Amplification & Comparison

The third section provides a striking side-by-side comparison of the final processed state.

  • Comparison:
    • Normal Flow: Had the error not occurred, the model would have made a PREDICTION: CAT (99% Confidence) with a high degree of accuracy and certainty.
    • SDC Affected Flow: The minute error, after cascading through thousands of parallel nodes and multiple layers, has been dramatically amplified. The model now makes a complete misclassification, with a non-sensical and low-confidence PREDICTION: BICYCLE (0.1% Confidence).
  • Graph (Error Divergence): The small SDC input (seen earlier as the single bit flip) has caused the entire output distribution to AMPLIFIED ERROR DIVERGES DRAMATICALLY.

Step 4: Final Output Consequence

The final, largest section at the bottom summarizes the real-world impact.

  • The Contrast:
    • Desired Output: The perfect outcome, like a flawless language generation or a critical diagnostic result (DESIRED OUTPUT: CORRECT RESULT).
    • Actual SDC Output: What actually occurs due to the SDC (ACTUAL SDC OUTPUT: CATASTROPHIC ERROR). This is not just a slightly wrong answer; it can be complete gibberish, a crashed model, or a dangerously incorrect real-world action.
  • Summary of Impact: The diagram lists the core failures: MISCLASSIFICATION, MODEL COLLAPSE, and UNRELIABLE INFERENCE, rendering the entire output useless.

Conclusion: Why SDC is a Catastrophic Danger

The ultimate takeaway, as stated in the title and the final caption, is that EVEN A TINY, TRANSIENT SDC CAN RENDER THE ENTIRE FINAL OUTPUT USELESS. In large-scale, massive parallel AI processing, a single, undetectable bit flip can cascade and multiply, causing a model that looks perfect to fail catastrophically.

#SilentDataCorruption #SDC #AI #MachineLearning #DeepLearning #LargeScaleAI #DistributedComputing #ParallelProcessing #HighPerformanceComputing #HPC

With Gemini (inc. infographic)