Power To Thermal Latency

The provided image illustrates a smart thermal management process that utilizes Artificial Intelligence (AI) and Digital Twin technology to control cooling systems “preemptively” in data centers or high-performance computing environments. The provided image, image_b7b685.png, illustrates a smart thermal management process that utilizes Artificial Intelligence (AI) and Digital Twin technology to control cooling systems “preemptively” in data centers or high-performance computing environments.

The timeline at the top of the image highlights the core concept: “Power To Thermal Latency.” It shows that there is a physical delay of approximately 8 seconds from the moment a power spike occurs in the GPU (T=0s) to when the actual heat arrives (T=~8s). The system operates in a 4-phase process to execute cooling in advance during this critical 8-second window before the heat even hits.

  • PHASE 1: INPUT DATA
    • GPU Telemetry: Real-time data regarding power consumption (POWER, W) and processing tasks (WORKLOAD) is collected from the GPU.
    • CDU Telemetry: Data such as coolant flow rate (FLOW, LPM) and supply/return temperatures (TEMP) is gathered from the Cooling Distribution Unit (CDU).
  • PHASE 2: ANALYTICS (AI Prediction)
    • Digital Twin & Thermal Analysis: All data collected in Phase 1 is fed into an AI brain. Here, the system calculates the Power to Thermal Latency (PTL), predicts the impending heat load, and computes the exact cooling demand required to handle it.
  • PHASE 3: CONTROL (Logic & Signal)
    • Cooling Logic & Orchestration: Based on the AI’s predictions, the system performs PID tuning and optimizes the cooling strategy. It then issues a “Cooling Signal” that triggers “PREEMPTIVE COOLING.” The first dotted vertical line on the timeline marks the exact moment this preemptive decision is made.
  • PHASE 4: AUCTIONATION / ACTUATION (Preemptive Execution)
    • CDU Actuation: Upon receiving the signal, the hardware executes a “PREEMPTIVE COOLING ACTION” well before the thermal arrival. It pre-adjusts the Pump Variable Frequency Drive (PUMP VFD) and Valve Position. As a result, an “ENHANCED COOLANT FLOW” is delivered directly to the GPU right before the heat strikes, preventing overheating at its source. (Note: The phase arrow reads “AUCTIONATION,” but contextually refers to “ACTUATION” of the hardware.)

💡 Summary

This image demonstrates a predictive, Digital Twin-based proactive cooling architecture for data centers. By capitalizing on the ~8-second latency between a GPU power spike and the resulting heat generation, the AI predicts future thermal loads. It then proactively adjusts coolant pumps and valves to supply an “Enhanced Coolant Flow” before the heat actually arrives. This preemptive closed-loop process maximizes cooling efficiency and prevents hardware overheating.This image demonstrates a predictive, Digital Twin-based proactive cooling architecture for data centers. By capitalizing on the ~8-second latency between a GPU power spike and the resulting heat generation, the AI predicts future thermal loads. It then proactively adjusts coolant pumps and valves to supply an “Enhanced Coolant Flow” before the heat actually arrives. This preemptive closed-loop process maximizes cooling efficiency and prevents hardware overheating.

#DataCenterCooling #DigitalTwin #PreemptiveCooling #ThermalManagement #GPUCooling #AICooling #SmartCooling #PowerToThermalLatency #AIAnalytics #CDU

With Gemini
2 GPU Throttling

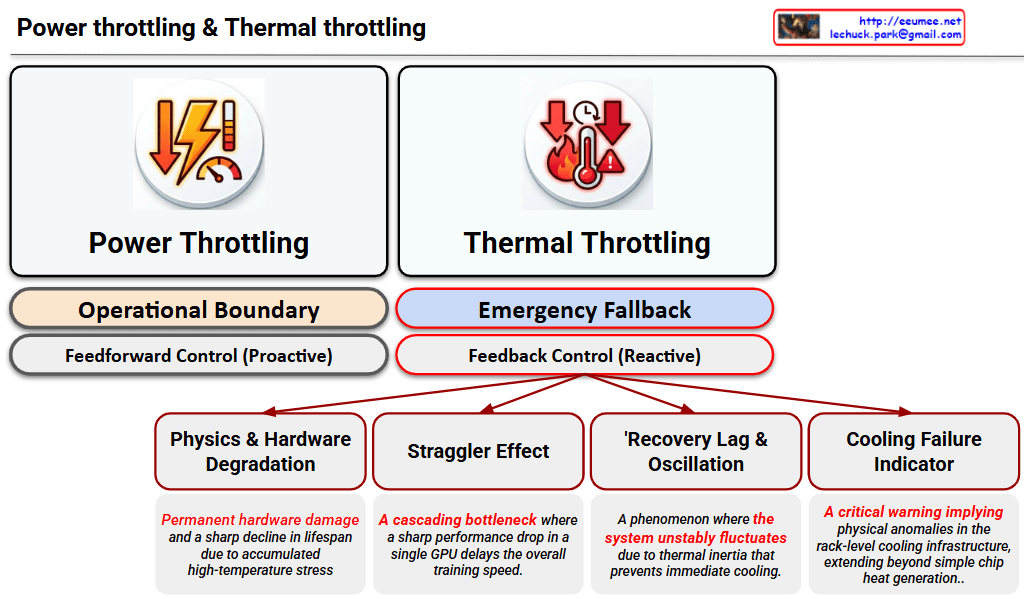
This image is a Visual Engineering diagram that contrasts the fundamental control mechanisms of Power Throttling and Thermal Throttling at a glance, specifically highlighting the critical impact thermal throttling has on the system.


1. Philosophical and Structural Contrast (Top Section)

The diagram places the two throttling methods side-by-side, clearly distinguishing them not just as similar performance limiters, but as mechanisms with completely different operational philosophies.

  • Left: Power Throttling
    • Operational Boundary: Indicates that this acts as a safety line, keeping the system operating ‘normally’ within its designed power limits.
    • Feedforward Control (Proactive): Specifies that this is a proactive control method that restricts input (power demand) before a negative result occurs, fundamentally preventing the issue from happening.
  • Right: Thermal Throttling
    • Emergency Fallback: Shows that this is not a normal operational state, but a ‘last line of defense’ triggered to prevent physical destruction.
    • Feedback Control (Reactive): Emphasizes that this is a reactive control method that drops clock speeds only after detecting the result (high heat exceeding the safe threshold).

2. Four Fatal Risks of Thermal Throttling (Bottom Tree Structure)

The core strength of the diagram lies in placing the sub-tree structure exclusively under Thermal Throttling. This highlights that this phenomenon goes beyond a simple performance drop, breaking down its complex, detrimental impacts on the infrastructure into four key factors:

  1. Physics & Hardware Degradation: Refers to direct damage to semiconductors (silicon) and the shortening of their lifespan (MTBF) due to the accumulated stress of high heat.
  2. Straggler Effect: Points out the bottleneck phenomenon in environments like distributed AI training. A delay in a single, thermally throttled node drags down the synchronization and data processing speed of the entire cluster.
  3. Thermal Inertia & Thermal Oscillations: Describes the unstable fluctuation of system performance. Because heat does not dissipate instantly (thermal inertia), the system repeatedly drops and recovers clock speeds, causing the performance to oscillate.
  4. Cooling Failure Indicator: Acts as a severe alarm. It implies that the issue extends beyond a hot chip—it indicates that the facility’s infrastructure, such as the rack-level Direct Liquid Cooling (DLC) capacity, has reached its physical limit or experienced an anomaly.

Overall Summary:

The diagram logically and intuitively delivers a powerful core message: “Power Throttling is a normal, proactive control within predictable bounds, whereas Thermal Throttling is a severe, reactive warning at both the hardware and infrastructure levels after control is lost.” It is an excellent piece of work that elegantly structures complex system operations using concise text and layout.

#DataCenter #AIInfrastructure #GPUCooling #ThermalThrottling #PowerThrottling #HardwareEngineering #HighPerformanceComputing #LiquidCooling #SystemArchitecture

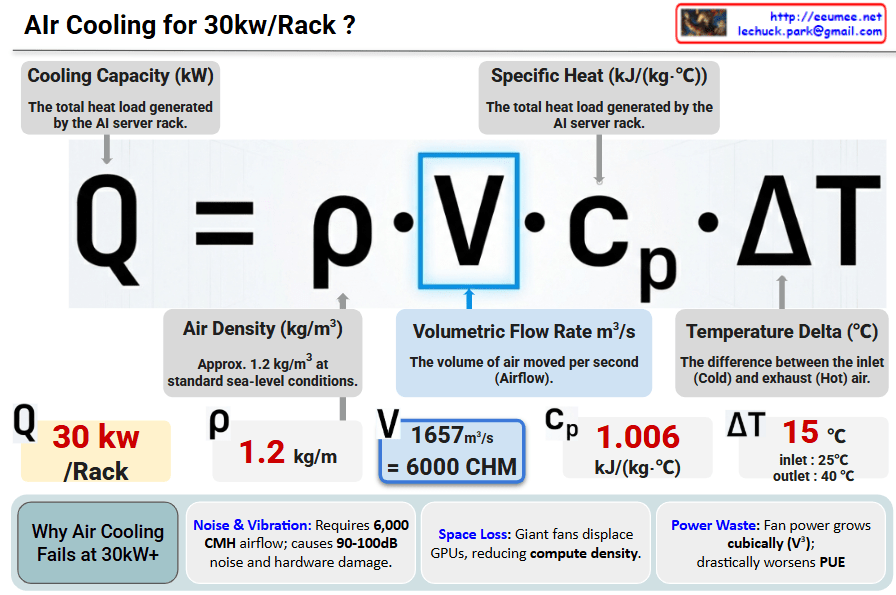
Air Cooling For 30kw/Rack

Why Air Cooling Fails at 30kW+

  • Noise & Vibration: Achieving 6,000 CMH airflow generates 90-100dB noise and vibrations that damage hardware.
  • Space Loss: Massive cooling fans displace GPUs/CPUs, drastically reducing compute density.
  • Power Waste: Fan power consumption grows cubically (V^3), causing a significant spike in PUE (Power Usage Effectiveness).

Conclusion: At 30kW/Rack, air cooling hits a physical and economic “wall”. Transitioning to Liquid Cooling is mandatory for next-generation AI Data Centers.


#AIDataCenter #LiquidCooling #ThermalManagement #30kWRack #DataCenterEfficiency #PUE #HighDensityComputing #GPUCooling