Ontology+Telemetry

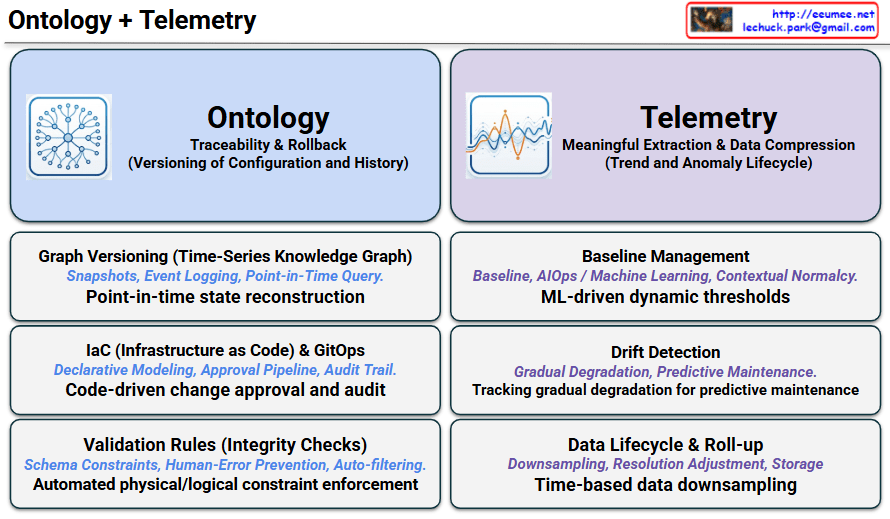
The image is titled “Ontology + Telemetry” at the top and is divided into two main columns: a blue-themed section for “Ontology” on the left, and a purple-themed section for “Telemetry” on the right.

1. Left Section: Ontology At the top left, there is an icon of a network graph with connected nodes. The primary focus of this section is “Traceability & Rollback,” which involves the versioning of configuration and history. It details three key components:

  • Graph Versioning (Time-Series Knowledge Graph): Associated with snapshots, event logging, and point-in-time queries. Its main function is “Point-in-time state reconstruction.”
  • IaC (Infrastructure as Code) & GitOps: Focuses on declarative modeling, approval pipelines, and audit trails to enable “Code-driven change approval and audit.”
  • Validation Rules (Integrity Checks): Utilizes schema constraints and auto-filtering to prevent human error, leading to “Automated physical/logical constraint enforcement.”

2. Right Section: Telemetry At the top right, there is an icon depicting line graphs and fluctuating data waves. The primary focus here is “Meaningful Extraction & Data Compression,” managing the lifecycle of trends and anomalies. It also lists three key components:

  • Baseline Management: Uses AIOps and machine learning for contextual normalcy, establishing “ML-driven dynamic thresholds.”
  • Drift Detection: Involves monitoring gradual degradation and enables “Tracking gradual degradation for predictive maintenance.”
  • Data Lifecycle & Roll-up: Deals with downsampling, resolution adjustment, and storage optimization through “Time-based data downsampling.”

💡 Summary
This infographic outlines a comprehensive framework for managing modern IT infrastructure and data centers. It contrasts and combines two essential pillars: “Ontology,” which handles the static configuration, tracing structural changes and rollbacks, and “Telemetry,” which processes dynamic operational metrics to extract meaningful trends and predict anomalies.

#Ontology #Telemetry #ITInfrastructure #DataCenterManagement #AIOps #ConfigurationManagement #PredictiveMaintenance #GitOps

Edge Gateway Concepts

Edge Gateway Concepts

This image is an architectural diagram that illustrates the data flow and core functionalities of an Edge Gateway in an industrial setting. The diagram is divided into four main components:

  1. Facilities & Sensors (Left): This section depicts industrial equipment, such as transformers and generators, alongside wireless sensors. These physical devices generate raw data and transmit it using a “Facility-friendly Protocol,” meaning the data is sent in various native, equipment-specific formats.
  2. Edge Gateway (Center): This is the core intermediary component. It receives data from the facilities and sensors. Below the gateway nodes, a stack outlines the Edge Gateway’s five primary functional layers:
    • Protocol Transfer: Converts varied facility protocols into a unified standard.
    • Data(Point) Tagging: Adds identifiers and context to the raw data points.
    • Timestamping (PTP): Records precise time data, utilizing both facility-made and Edge Gateway-made timestamps.
    • Urgent Event Detection: Identifies critical issues in real-time based on 1-dimensional thresholds.
    • HA & Security: Ensures High Availability and secure operations for the gateway itself.
  3. Policy Controller (Bottom Right of Center): This module governs how the Edge Gateway processes information. It applies “Data Standardization Policy Control” by directly instructing the Edge Gateway’s Protocol Transfer and Data Tagging layers, ensuring all data is uniformly processed according to predefined rules.
  4. Integration (Right): This represents the top-level centralized monitoring, management, or cloud system. The Edge Gateway transmits the newly processed and tagged data to this integration layer using a unified “Standardization Protocol.”

Summary

This diagram effectively maps out an Industrial IoT (IIoT) data pipeline. It explains how an Edge Gateway ingests raw, non-standardized data from diverse facilities and sensors, processes and tags it based on rules from a Policy Controller, and then securely forwards the unified data to a centralized Integration system using standardized protocols.

#EdgeGateway #EdgeComputing #IoT #IndustrialIoT #DataStandardization #ArchitectureDiagram #TechArchitecture #DataPipeline

With Gemini