Sensors for AI DC Rack

Architecture Walkthrough: High-Density AI Rack Monitoring Topology

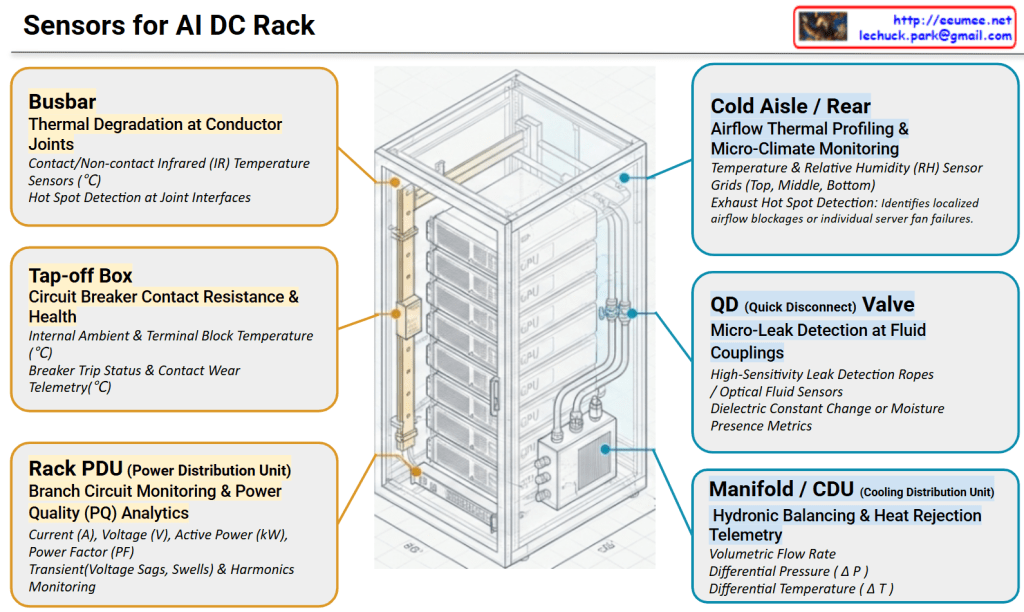
This diagram illustrates a comprehensive monitoring framework tailored for next-generation, high-density AI Data Centers. As rack power densities scale upward of 40kW to over 100kW, the integration of high-density power delivery and advanced liquid cooling demands a unified telemetry layer. The architecture symmetrically bifurcates these critical operations into two primary domains: Power Distribution & Electrical Infrastructure (left, in yellow) and Liquid Cooling & Thermal Management (right, in blue).

1. Power Infrastructure Telemetry (Left Domain)

  • Busbar (Top Left): Focuses on tracking surface temperatures at copper/aluminum busway joints using contact or non-contact infrared (IR) sensors. This mitigates the risk of thermal runaway caused by mechanical loosening or joint degradation.
  • Tap-off Box (Middle Left): Monitors the critical junction where power is tapped from the main busway to individual racks. Telemetry captures internal ambient temperatures and circuit breaker contact wear to prevent nuisance tripping under heavy GPU loads.
  • Rack PDU (Bottom Left): Delivers granular power quality (PQ) analytics. Beyond basic billing metrics, it utilizes high-speed sampling to capture transient events—such as voltage sags, swells, and total harmonic distortion (THD)—triggered by sudden LLM training state transitions.

2. Liquid Cooling & Thermal Management (Right Domain)

  • Cold Aisle / Rear (Top Right): Provides 3D micro-climate profiling of the rack enclosure. Using sensor grids (top, middle, bottom), it tracks cold air intake and maps exhaust air behavior to instantaneously flag localized hot spots or individual server fan failures.
  • QD (Quick Disconnect) Valve (Middle Right): Positions high-sensitivity leak detection ropes or optical fluid sensors directly at the fluid mating interfaces of individual GPU server blades. This safeguards expensive IT assets against coolant escape.
  • Manifold / CDU (Bottom Right): Serves as the central hydronic balancing hub. By cross-referencing volumetric flow rate (LPM), differential pressure (Delta P), and differential temperature ($\Delta T$) across supply and return lines, the system continuously calculates the exact real-time heat rejection load in kW.

Executive Summary: The Imperative of High-Fidelity Infrastructure Telemetry

In a modern AI Data Center, the sheer density of accelerated computing clusters renders traditional, coarse facility monitoring completely obsolete. To ensure maximum uptime and operational efficiency, telemetry must undergo a paradigm shift governed by two critical vectors:

1. High Precision & High Resolution

Because GPU workloads scale from idle to maximum power in microseconds, sensors must feature ultra-high sampling rates (millisecond-level resolution for electrical transients) and high precision (milli-degree sensitivity for liquid thermal loops). Coarse, averaged data masks dangerous micro-spikes that degrade hardware components over time. High-resolution telemetry is the baseline requirement for capturing the true, unvarnished physical state of the infrastructure.

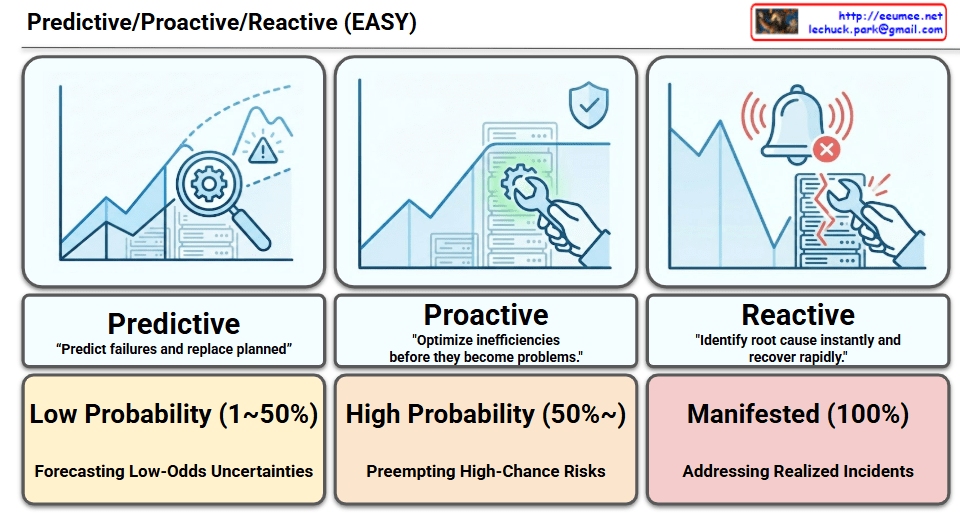
2. From Phenomena to Precursors (Omens)

Traditional data center monitoring is reactive—it alerts operators to a phenomenon (e.g., “Rack temperature has exceeded $85^\circ\text{C}$”), which usually means the failure has already occurred.

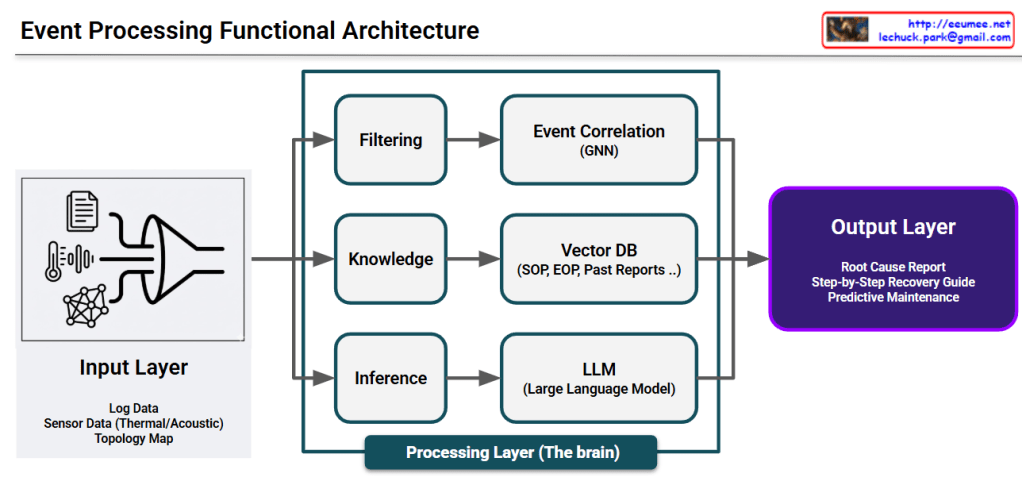
Conversely, high-fidelity, continuous data allows an AIOps engine to identify precursors or omens—the microscopic anomalies that precede a disaster. For instance:

  • A fractional, steady rise in busbar temperature relative to a static workload implies micro-vibration joint loosening (Thermal Degradation Precursor).
  • A subtle drift in the dielectric constant near a fluid coupling signals a microscopic weep before it transforms into a catastrophic spray (Leak Precursor).
  • A minor, localized spike in differential pressure (Delta P) combined with a micro-drop in flow rate alerts the system to initial strainer clogging before fluid starvation throttles the GPUs.

By capturing these subtle “signs” rather than waiting for the “symptom,” data centers can transition from reactive firefighting to fully automated, self-healing predictive maintenance.

#AIDataCenter #LiquidCooling #DirectToChip #AIOps #InfrastructureTelemetry #HighDensityComputing #PredictiveMaintenance #DataCenterArchitecture #TechnicalVisualization #SmartInfrastructure

With Gemini

PI-DLinear(Physics-Informed DLinear)


PI-DLinear (Physics-Informed DLinear)

The provided image is a structured infographic slide titled “PI-DLinear (Physics-Informed DLinear).” It visually organizes the model’s core features into four distinct, color-coded columns:

1. Physics-Informed Loss Function (Blue Column)

This section focuses on how physical laws are integrated into the model’s learning process.

  • #Hybrid Objective: It explains that the model integrates data fidelity with physical governing equations.
  • #Physical Constraints: It states that the model penalizes thermodynamically impossible predictions (e.g., violating energy conservation or heat transfer laws).
  • #Mathematical Formulation: It provides the core equation for the loss function: Ltotal = Ldata + Lphysic.

2. Harness Engineering & Safe Control (Purple Column)

This column emphasizes the safety and control aspects for AI operations.

  • #Operational Scaffolding: It describes the model as acting as a strict guardrail for autonomous AI-driven agents.
  • #Boundary Adherence: It guarantees that forecasts and control actions remain within safe, predefined physical boundaries, completely preventing critical hallucinations.

3. Robust OOD (Out-of-Distribution) Extrapolation (Green Column)

This section highlights the model’s reliability during unexpected scenarios.

  • #Anomaly Resilience: It notes that the model maintains highly rational trajectories during unprecedented emergencies (like sudden chiller failures) where pure data-driven models would collapse.
  • #Predictive Diagnostics: It points out that the model delivers accurate fault propagation forecasting, which directly enables a drastic reduction in MTTR (Mean Time To Repair).

4. Structural Simplicity & Computational Efficiency (Red Column)

The final column outlines the architectural benefits of the model.

  • #Linear Decomposition: It explains that the model splits time-series into trend and remainder components using highly interpretable linear layers, bypassing heavy attention mechanisms.
  • #High-Throughput Inference: It emphasizes that the model is exceptionally lightweight and fast, making it optimal for real-time DevOps, edge deployments, and multi-center scaling.

Summary

The infographic effectively presents PI-DLinear as a powerful hybrid model for time-series forecasting. By combining the computational speed and simplicity of linear architectures with the strict mathematical boundaries of physical laws, it creates a highly reliable AI tool. It is specifically designed to handle unexpected anomalies safely and efficiently, making it ideal for critical infrastructure management where AI hallucinations cannot be tolerated.

#PIDLinear #PhysicsInformedAI #TimeSeriesForecasting #AIOps #MachineLearning #SafeAI #PredictiveMaintenance #HarnessEngineering

With Gemini

Autonomous Facility Operation Optimization Pipeline


Autonomous Facility Operation Optimization Pipeline

This pipeline represents a sophisticated 5-stage workflow designed to transition facility management from manual oversight to full AI-driven autonomy, ensuring reliability through hybrid modeling.

1. Integrated Data Ingestion & Preprocessing

  • Role: Consolidates diverse data streams into a synchronized, high-fidelity format by eliminating noise.
  • Key Components: Sensor time-series data, DCIM integration, Event log parsing, Outlier filtering, and TSDB (Time Series Database).

2. Hybrid Analysis Engine

  • Role: Eliminates analytical blind spots by running physical laws, machine learning predictions, and expert knowledge in parallel.
  • Key Components: Physics-Informed Machine Learning (PIML), Anomaly Detection, RUL (Remaining Useful Life) Prediction, and RAG-enhanced Ground Truth analysis.

3. Decision Fusion & Prescription

  • Role: Synthesizes multi-track analysis to move beyond simple alerts, generating specific, actionable “prescriptions.”
  • Key Components: Decision Fusion, Prescriptive Action, LLM-based Prescription, and Priority Scoring to rank urgency.

4. Operation Application & Feedback Loop

  • Role: Establishes a closed-loop system that measures success rates post-execution to continuously refine models.
  • Key Components: Success Rate Tracking, RCA (Root Cause Analysis), Model Retraining, and Physics/Rule updates based on real-world performance.

5. Phased Control Automation

  • Role: A risk-mitigated transition of control authority from humans to AI based on accumulated performance data.
  • Automation Levels:
    • L1. Assistant Mode: System provides guides only; 100% human execution.
    • L2. Semi-Autonomous: System prepares optimized values; human provides final approval.
    • L3. Fully Autonomous: System operates without human intervention (triggered when success rate >90%).

Strategic Insight

The hallmark of this architecture is the integration of Physics-Informed ML and LLM-based reasoning. By combining the rigid reliability of physical laws with the adaptive reasoning of Large Language Models, the pipeline solves the “black box” problem of traditional AI, making it suitable for mission-critical infrastructures like AI Data Centers.

#DataCenter #AIOps #AutonomousInfrastructure #PhysicsInformedML #DigitalTwin #LLM #PredictiveMaintenance #DataCenterOptimization #TechVisualization #SmartFacility #EngineeringExcellence

Hybrid Analysis for Autonomous Operation (2)

Framework Overview

The image illustrates a “Hybrid Analysis” framework designed to achieve true Autonomous Operation. It outlines five core pillars required to build a reliable, self-driving system for high-stakes environments like AI data centers or power plants. The architecture combines three analytical foundations (purple) with two execution and safety layers (teal).


1. The Analytical Foundation (The Hybrid Triad)

This section forms the “brain” of the autonomous system, blending human expertise, artificial intelligence, and absolute scientific laws.

  • Domain Knowledge (Human Experience):
    • Core: Systematized heuristics, decades of operator know-how, and maintenance manuals.
    • Role: Provides qualitative analysis, establishes preventive maintenance baselines, and handles unstructured exceptions that algorithms might miss.
  • Data-driven ML (Artificial Intelligence):
    • Core: Pattern recognition, anomaly detection, and Predictive Maintenance (PdM).
    • Role: Analyzes massive volumes of multi-dimensional sensor and operational data to find hidden correlations and risks that are imperceptible to human operators.
  • Physics Rule (Engineering Guardrails):
    • Core: Thermodynamic constraints, equations of state, fluid dynamics, and absolute power limits.
    • Role: Acts as the ultimate boundary. It ensures that the operational commands generated by ML models are physically possible and safe, preventing the AI from violating unchanging engineering laws.

2. Execution and Safety Nets

This section translates the insights from the analytical triad into real-world, physical changes while guaranteeing system stability.

  • Control & Actuation (The Hands):
    • Core: IT/OT (Information Technology / Operational Technology) convergence and real-time bi-directional communication.
    • Role: The domain of injecting the optimized setpoints and guidelines directly into the facility’s PLC (Programmable Logic Controller) or DCS (Distributed Control System) to drive physical actuators.
  • Reliability & Governance (The Shield):
    • Core: Data/Model monitoring, Disaster Recovery (DR), and Cyber-Physical Security (CPS).
    • Role: The overarching safety net and pipeline management required to ensure the autonomous operating system runs securely and continuously, 24/7, without interruption.

💡 Key Takeaway

As emphasized by the red text at the bottom, this multi-layered approach is highly critical in environments like data centers or power plants. Relying solely on data-driven ML is too risky for high-density infrastructure; true autonomous stability is only achieved when AI is anchored by human domain expertise and strict physical laws.

#AutonomousOperations #AIOps #HybridAnalysis #PredictiveMaintenance #ITOTConvergence #CyberPhysicalSystems #MissionCritical #TechVisualization #EngineeringInfographic

With Gemini

Hybrid Analysis for Autonomous Operation (1)


Hybrid Analysis for Autonomous Operation (1)

This framework illustrates a holistic approach to autonomous systems, integrating human expertise, physical laws, and AI to ensure safe and efficient real-world execution.

1. Five Core Modules (Top Layer)

  • Domain Knowledge: Codifies decades of operator expertise and maintenance manuals into digital logic.
  • Data-driven ML: Detects hidden patterns in massive sensor data that go beyond human perception.
  • Physics Rule: Enforces immutable engineering constraints (such as thermodynamics or fluid dynamics) to ground the AI in reality.
  • Control & Actuation: Injects optimized decisions directly into PLC / DCS (Distributed Control Systems) for real-world execution.
  • Reliability & Governance: Manages the entire pipeline to ensure 24/7 uninterrupted autonomous operation.

2. Integrated Value Drivers (Bottom Layer)

These modules work in synergy to create three essential “Guides” for the system:

  • Experience Guide: Combines domain expertise with ML to handle edge cases and provide high-quality ground-truth labels for model training.
  • Facility Guide: Acts as a safety net by combining ML predictions with physical rules. It predicts Remaining Useful Life (RUL) while blocking outputs that exceed equipment design limits.
  • The Final Guardrail: Bridges the gap between IT (Analysis) and OT (Operations). It prevents model drift and ensures an instant manual override (Failsafe) is always available.

3. Key Takeaways

The architecture centers on a “Control Trigger” that converts digital insights into physical action. By anchoring machine learning with physical laws and human experience, the system achieves a level of reliability required for mission-critical environments like data centers or industrial plants.

#AutonomousOperations #IndustrialAI #MachineLearning #SmartFactory #DataCenterManagement #PredictiveMaintenance #ControlSystems #OTSecurity #AIOps #HybridAI

With Gemini

Predictive/Proactive/Reactive (EASY)

Risk Management Framework by Probability


1. Predictive: Low Probability (~50%)

  • Focus: Forecasting potential failures before they show clear signs.
  • Action: “Predict failures and replace planned”.
  • Key Phrase: Forecasting Low-Odds Uncertainties.

2. Proactive: High Probability (50%~)

  • Focus: Addressing inefficiencies that are very likely to become actual problems.
  • Action: “Optimize inefficiencies before they become problems”.
  • Key Phrase: Preempting High-Chance Risks.

3. Reactive: Manifested (100%)

  • Focus: Dealing with issues that have already occurred and are currently impacting the system.
  • Action: “Identify root cause instantly and recover rapidly”.
  • Key Phrase: Addressing Realized Incidents.

Manage risks by forecasting low-probability (~50%) uncertainties (Predictive), preempting high-probability (50%~) inefficiencies (Proactive), and rapidly recovering from 100% manifested incidents (Reactive).

#RiskManagement #PredictiveMaintenance #ProactiveStrategy #ReactiveResponse #SystemReliability #ProbabilityAssessment

With Gemini

Event Processing Functional Architecture

This image illustrates a Data Processing Pipeline (Architecture) where raw data is ingested, analyzed through an AI engine, and converted into actionable business intelligence.


## Image Interpretation: AI-Driven Data Pipeline

### 1. Input Layer (Left: Data Ingestion)

This represents the raw data collected from various sources within the infrastructure:

  • Log Data (Document Icon): System logs and event records that capture operational history.
  • Sensor Data (Thermometer & Waveform Icons): Real-time monitoring of physical environments, specifically focusing on Thermal (heat) and Acoustic (noise) patterns.
  • Topology Map (Network Icon): The structural map of equipment and their interconnections, providing context for how data flows through the system.

### 2. Integration & Processing (Center: The AI Funnel)

  • The Funnel/Pipe Shape: This symbolizes the process of data fusion and refinement. It represents different data types being standardized and processed through an AI model or analytics engine to filter out noise and identify patterns.

### 3. Output Layer (Right: Actionable Insights)

The final results generated by the analysis, designed to provide immediate value to operators:

  • Root Cause Report (Document with Magnifying Glass): Identifies the underlying reason for a specific failure or anomaly.
  • Step-by-Step Recovery Guide (Checklist with Arrows): Provides a sequential, automated, or manual procedure to restore the system to a healthy state.
  • Predictive Maintenance (Gear with Upward Arrow): Utilizes historical trends to predict potential failures before they occur, optimizing maintenance schedules and reducing downtime.

# Summary

The diagram effectively visualizes the transition from complex raw data to actionable intelligence. It highlights the core value of an AI-driven platform: reducing cognitive load for human operators by providing clear, data-backed directions for maintenance and recovery.


#AI #DataCenter #PredictiveMaintenance #DataAnalytics #SmartInfrastructure #RootCauseAnalysis #DigitalTransformation #OperationsOptimization

With Gemini