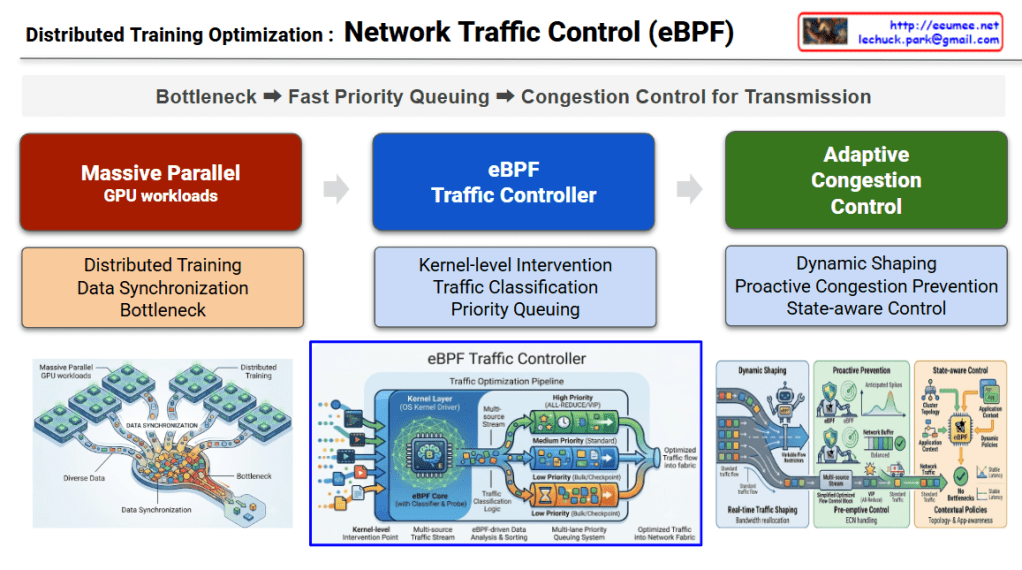
Distributed Training Optimization : Network Traffic Control (eBPF)

The diagram, titled “Distributed Training Optimization: Network Traffic Control,” outlines a core 3-stage optimization pipeline. It logically unfolds the process of identifying and solving the problem following the top flow path: Bottleneck ➡️ Fast Priority Queuing ➡️ Congestion Control for Transmission.

1. Massive Parallel GPU Workloads

  • Visual Description: The red section on the left and the illustration below it depict “Diverse Data” pouring out from multiple GPU cluster nodes and converging into a single, narrow bottleneck.
  • Core Meaning: It illustrates the Data Synchronization traffic that is essential during the Distributed Training of AI models. It structurally highlights the inevitable network bottleneck that occurs when countless GPUs attempt to exchange computational results simultaneously.

2. eBPF Traffic Controller

  • Visual Description: The central blue section introduces the core control engine designed to resolve the aforementioned bottleneck. The lower illustration shows complex traffic being neatly sorted into three pipes (priority lanes) at the OS Kernel Driver layer.
  • Core Meaning: It demonstrates Kernel-level Intervention, allowing access to network packets without massive overhead. Following the Traffic Classification logic, the system implements Priority Queuing: mission-critical traffic directly affecting training speed (like All-Reduce) is routed to the top ‘High Priority (VIP)’ queue, while standard storage traffic goes to the ‘Low Priority’ queue.

3. Adaptive Congestion Control

  • Visual Description: The green section on the right depicts the dynamic management of queued traffic as it is transmitted into the actual network fabric. The illustration shows eBPF agents adjusting valves in real-time (Dynamic Shaping), predicting and preventing network spikes (Proactive Prevention), and maintaining stable traffic flow based on the overall application context (State-aware Control).
  • Core Meaning: Beyond simple prioritization, it proactively monitors network switch buffer states and overall infrastructure congestion to flexibly adjust transmission rates. Ultimately, this creates a flawless, optimized data flow with zero latency.

📝 Summary

This diagram visualizes the complete pipeline for maximizing communication efficiency in AI data centers. To resolve the inevitable network bottlenecks caused by AI distributed training, it introduces an eBPF-based traffic controller operating at the lowest kernel level to prioritize traffic, and executes adaptive congestion control reflecting real-time network states to ensure seamless data transmission.

#AIDataCenter #eBPF #DistributedTraining #TrafficControl #InfrastructureEngineering #GPUCluster #AIOps #NetworkOptimization

With Gemini

AI Flame Graphs (eBPF)

📊 AI Flame Graphs (eBPF) Architecture Diagram Interpretation

This diagram visually unfolds three logical stages (Problem Identification, Technical Solution, and Derived Results) based on the core theme stated at the top: “Tracks bottlenecks caused by CPU-GPU asynchronous execution.”.

1. 🔴 Problem Identification (Left Red Section) This area highlights the fundamental issue of losing visibility due to asynchronous processing.

  • Disconnected Execution Flow: The gray blocks illustrate the execution stack, where commands originating from the Application (PyTorch) pass through the C++ Runtime, down to the Kernel Driver, and finally to the GPU Hardware.
  • Asynchronous Nature: The large downward arrow on the left emphasizes that this entire process occurs “asynchronously between the CPU and GPU.”
  • Resulting Limitation: As stated in the orange box at the bottom, when actual GPU Wait Gaps or EU Stalls occur, tracing the root cause back to the upper-level application code becomes inherently and extremely difficult.

2. 🔵 Technical Solution (Center Blue Section) This area explains the eBPF-based data correlation approach used to resolve the aforementioned visibility issues.

  • Intervention Layer: A green block with an arrow points directly to the ‘Kernel Driver’ layer in the left column. This indicates that low-overhead eBPF Probes are strategically inserted precisely at the OS Kernel Driver layer.
  • Correlation Mechanism: The bottom box outlines the technical remedy: it bridges the disconnected context by “Simultaneously capturing and correlating CPU command submissions with GPU hardware counters,” effectively linking the CPU’s actions with the GPU’s reactions in real-time.

3. 🟢 Derived Results (Right Green Section) This area demonstrates the foundation for integrated visualization and automated analysis achieved through eBPF application.

  • Integrated Visualization: It shows how previously isolated CPU call stacks and GPU execution delays are unified into a single Flame Graph for intuitive and cohesive analysis.
  • Operational Impact: Ultimately, it highlights how this technology empowers automated systems to instantly pinpoint and resolve the root causes of data center performance bottlenecks.

📌 Summary

This diagram is a structural overview of how eBPF technology resolves asynchronous bottlenecks between CPUs and GPUs in AI workloads. It clearly explains the process of inserting low-overhead eBPF probes at the kernel level to correlate disconnected execution data. By unifying this data into a single ‘Flame Graph,’ it provides the foundation for automated systems to perform real-time root cause analysis and infrastructure optimization.

#eBPF #FlameGraph #GPUOptimization #PerformanceProfiling #InfrastructureEngineering #SystemArchitecture

With Gemini

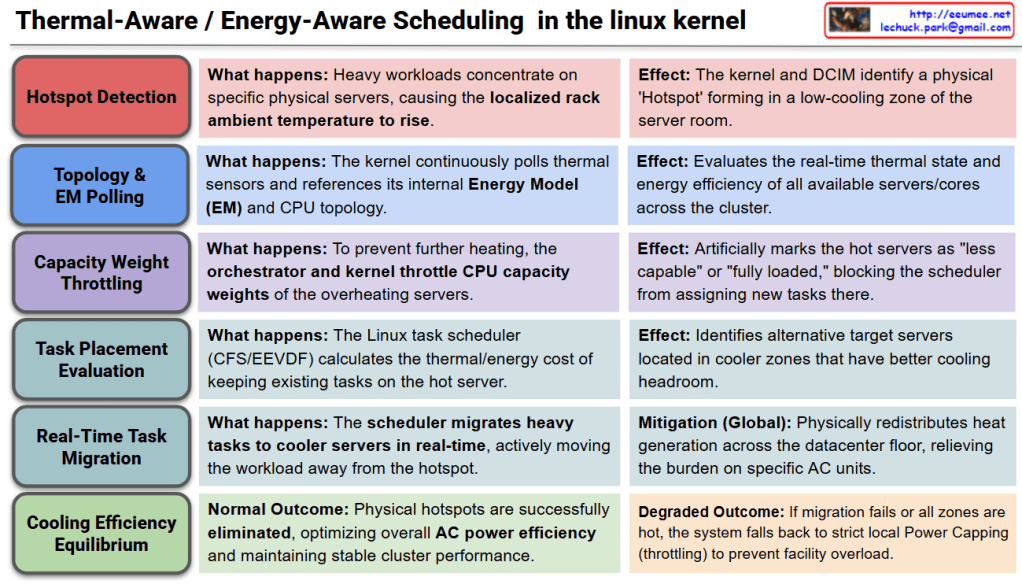
Thermal-Aware / Energy-Aware Scheduling in the Linux kernel

Thermal-Aware / Energy-Aware Scheduling

This diagram illustrates the macro-level, spatial cooling strategy within the Linux kernel. Instead of merely throttling hardware locally, the scheduler actively redistributes workloads across the datacenter floor to optimize overall cooling infrastructure. The process is broken down into six sequential stages:

  • Stage 1: Hotspot DetectionWhen heavy compute workloads concentrate heavily on specific physical servers, the localized ambient temperature around that rack begins to rise. As a result, the Linux kernel and the Datacenter Infrastructure Management (DCIM) system detect a physical ‘Hotspot’ forming within a low-cooling zone of the server room.
  • Stage 2: Topology & EM PollingTo assess the cluster’s environment, the kernel continuously polls hardware thermal sensors and cross-references this data with its internal Energy Model (EM) and CPU topology. This allows the system to evaluate the real-time thermal state and power efficiency of all available servers and cores across the entire cluster.
  • Stage 3: Capacity Weight ThrottlingTo prevent the hotspot from worsening, the cluster orchestrator and the local kernel intervene by artificially throttling the CPU capacity weights of the overheating servers. This mechanism marks the hot servers as “less capable” or “fully loaded” to the system, effectively blocking the scheduler from assigning any new tasks to that specific physical location.
  • Stage 4: Task Placement EvaluationThe Linux task scheduler (such as CFS or EEVDF) calculates the thermal and energy cost of keeping currently running tasks on the hot server. It evaluates the previously polled topology data to identify alternative target servers located in cooler zones that possess better cooling headroom.
  • Stage 5: Real-Time Task MigrationIn a decisive global mitigation step, the scheduler actively migrates heavy tasks to the cooler servers in real-time. By physically moving the workload away from the hotspot, the kernel seamlessly redistributes heat generation across the datacenter floor, immediately relieving the thermal burden on specific Air Conditioning (AC) units.
  • Stage 6: Cooling Efficiency Equilibrium
    • Normal Outcome: The physical hotspots are successfully eliminated. The datacenter achieves an optimal thermal equilibrium, maximizing overall AC power efficiency while maintaining stable, high-performance cluster operations.
    • Degraded Outcome: If task migration is impossible (e.g., all zones in the datacenter are equally hot), the system abandons spatial scheduling and falls back to strict local Power Capping (aggressive frequency/voltage throttling) to prevent total facility overload.

Summary

  • Unlike traditional local throttling, Energy-Aware Scheduling actively detects physical “hotspots” in the datacenter and artificially lowers the compute capacity weight of overheating servers.
  • The Linux scheduler utilizes its Energy Model (EM) to identify cooler servers and actively migrates heavy AI workloads away from the hotspot in real-time.
  • This macro-level load balancing redistributes heat generation across the datacenter floor, maximizing overall AC cooling efficiency and preventing localized cooling failures.

#LinuxKernel #EnergyAwareScheduling #ThermalManagement #DataCenterOptimization #TaskMigration #GreenComputing #HPC #CloudInfrastructure

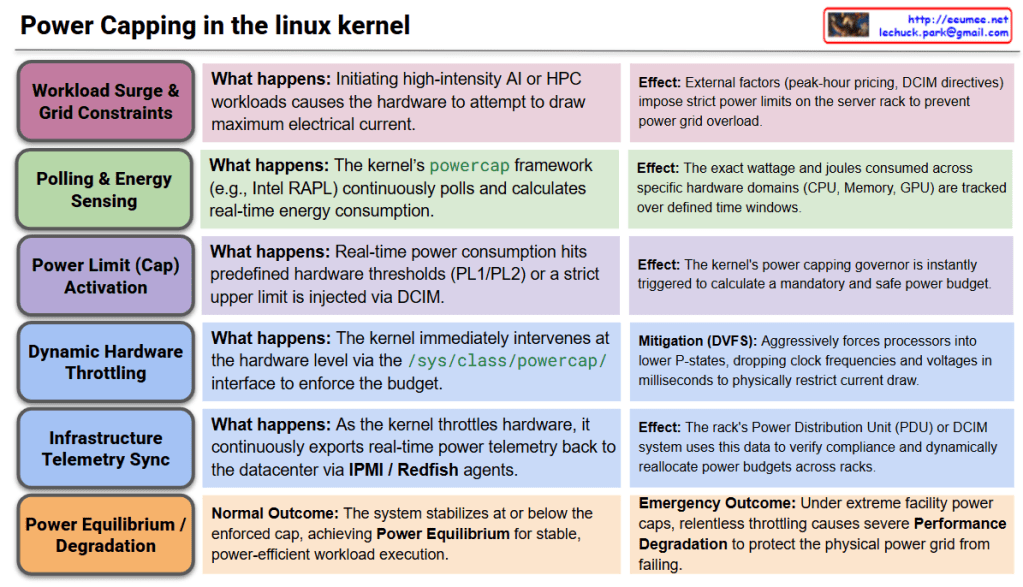
Power Capping in the Linux kernel

Power Capping in the Linux Kernel

This architecture outlines the closed-loop logic flow of the Linux kernel’s powercap framework. It details how the kernel enforces strict energy limits on hardware to manage heavy AI workloads while coordinating with the datacenter’s external power grid and infrastructure.

  • Stage 1: Workload Surge & Power Grid ConstraintsWhen high-intensity AI or HPC workloads are dispatched, the hardware immediately attempts to draw maximum electrical current. Concurrently, external factors—such as peak-hour electricity pricing, facility power limits, or a Datacenter Infrastructure Management (DCIM) directive—may impose strict power constraints on the server rack.
  • Stage 2: Polling & Energy SensingTo monitor power draw, the kernel’s powercap framework utilizes hardware interfaces like Intel RAPL (Running Average Power Limit) or AMD Node Manager. It continuously polls and calculates real-time energy consumption, tracking the exact wattage and joules consumed across specific hardware domains (CPU, memory, GPU) over defined time windows.
  • Stage 3: Power Limit (Cap) ActivationIf the real-time power consumption hits predefined hardware thresholds (such as PL1 or PL2 limits), or if an external DCIM system injects a strict upper power limit via the /sys/class/powercap/ interface, the kernel’s power capping governor is instantly triggered into action.
  • Stage 4: Dynamic Hardware Throttling (Local Mitigation)To enforce the mandatory power budget, the kernel immediately intervenes at the hardware level. It aggressively utilizes DVFS (Dynamic Voltage and Frequency Scaling) to force the processors into lower P-states, dropping clock frequencies and voltages within milliseconds to physically restrict the electrical current draw.
  • Stage 5: Infrastructure Telemetry Sync (Global Mitigation)As the kernel throttles the hardware, it continuously exports real-time power telemetry back to the datacenter’s control plane via IPMI/Redfish agents. The rack’s Power Distribution Unit (PDU) or DCIM system uses this data to verify compliance with the power cap, allowing the facility to dynamically reallocate power budgets across different server racks.
  • Stage 6: Power Equilibrium / Performance Degradation
    • Normal Outcome: The system successfully stabilizes at or below the enforced power cap, achieving Power Equilibrium. The workload continues to execute stably, though at a dynamically calculated, power-efficient pace.
    • Emergency/Degraded Outcome: If the datacenter imposes an extreme power cap (e.g., during a facility power emergency), the kernel will relentlessly throttle the hardware. This causes severe Performance Degradation for the workload, but it successfully prevents catastrophic outcomes like tripping the datacenter’s power breakers.

Summary

  • The Linux kernel uses frameworks like RAPL to continuously monitor and calculate the exact energy consumption of server components during heavy workloads.
  • When hardware limits are reached or external datacenter power caps are applied, the kernel instantly throttles CPU/GPU frequencies and voltages to restrict electrical draw.
  • This system ensures the server stays strictly within its assigned power budget, sacrificing raw performance if necessary to protect the datacenter’s physical power grid from failing.

#LinuxKernel #PowerCapping #RAPL #PowerManagement #DataCenterInfrastructure #GreenComputing #HPC #DCIM #EnergyEfficiency

Thermal Management in the Linux kernel

Thermal Management in the Linux Kernel

This diagram illustrates the closed-loop architecture of the Linux kernel’s thermal management subsystem, specifically detailing how it handles heavy AI workloads by coordinating both internal server hardware and external datacenter cooling infrastructure. The process is broken down into six sequential stages:

  • Stage 1: Workload InitializationWhen a high-intensity AI or LLM task is dispatched, it causes an immediate surge in electrical current across the hardware transistors. As a direct physical effect, the internal die temperature of the accelerator spikes within mere milliseconds.
  • Stage 2: Polling & SensingTo monitor this heat, the kernel utilizes hardware monitoring (hwmon) and ACPI drivers to continuously read data from internal Digital Thermal Sensors. This raw temperature data is mapped into an abstracted “Thermal Zone” and constantly compared against predefined safety thresholds known as “Trip Points.”
  • Stage 3: Trip Point & Governor ActivationIf the temperature crosses a specific threshold (such as a Warning Trip Point), it triggers a Thermal Governor, like the Intelligent Power Allocation (IPA) or Step Wise governor. This governor uses PID control algorithms to calculate a safe “Thermal Budget” that the hardware can sustain without damage.
  • Stage 4: Passive & Active CoolingBased on the calculated budget, the kernel initiates local mitigation through registered Cooling Devices. Active cooling involves instantly cranking up the internal server fan RPMs. Passive cooling relies on Dynamic Voltage and Frequency Scaling (DVFS), interacting with cpufreq to throttle clock speeds and lower voltages, thereby suppressing heat generation at the silicon level.
  • Stage 5: Infrastructure Telemetry SyncIf local cooling is insufficient to handle the load, the kernel exports real-time thermal telemetry via sysfs and IPMI/Redfish agents. The external datacenter infrastructure—specifically the Coolant Distribution Unit (CDU) or Chiller—receives this data and dynamically increases the liquid coolant flow rate directed to that specific server rack. ( Kernel works with BMC & DCIM/BMS.)
  • Stage 6: Thermal Equilibrium / EmergencyThe system continuously evaluates the outcome of these mitigations. Under normal conditions, the cooling capacity matches the heat generation, achieving a state of “Thermal Equilibrium” that allows the workload to run continuously and stably. However, if cooling fails and a Critical Trip Point is breached, the kernel immediately triggers an Emergency Shutdown to protect the hardware from permanent damage.

Summary

  • The Linux kernel continuously monitors hardware temperatures and maps them to virtual Thermal Zones to detect sudden heat spikes caused by heavy AI workloads.
  • Upon reaching safety thresholds, the kernel’s Thermal Governor simultaneously throttles CPU/GPU performance (local) and signals the datacenter’s CDU to increase liquid coolant flow (global).
  • This closed-loop system ultimately aims to achieve thermal equilibrium for stable high-performance computing, or safely halts the system if critical failure conditions are met.

#LinuxKernel #ThermalManagement #DataCenterInfrastructure #LiquidCooling #HPC #AIWorkloads #GreenComputing #ServerArchitecture

With Gemini

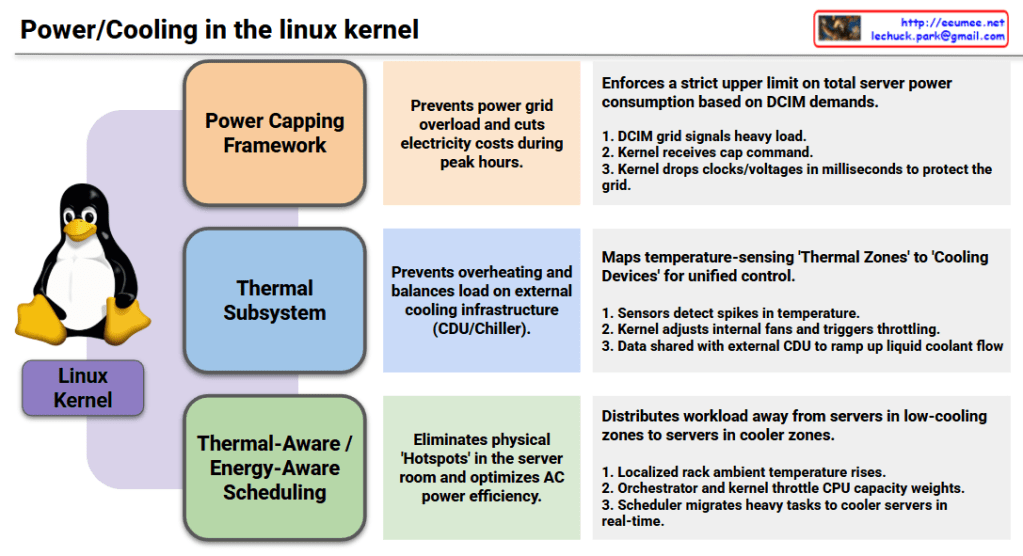
Power/Cooling in the linux kernel

1. Power Capping Framework

  • Objective (Center): Prevents power grid overload and cuts electricity costs during peak hours.
  • Mechanism (Right): Enforces a strict upper limit on total server power consumption based on DCIM (Datacenter Infrastructure Management) demands.
    1. The DCIM grid signals a heavy load status.
    2. The Linux kernel receives the specific power capping command.
    3. The kernel immediately drops processor clocks and voltages in milliseconds to protect the local power grid.

2. Thermal Subsystem

  • Objective (Center): Prevents hardware overheating and balances the load on external cooling infrastructure, such as Coolant Distribution Units (CDUs) and chillers.
  • Mechanism (Right): Maps temperature-sensing ‘Thermal Zones’ directly to hardware ‘Cooling Devices’ for unified, holistic control.
    1. Hardware sensors detect sudden spikes in internal temperature.
    2. The kernel dynamically adjusts internal server fans and triggers safety throttling.
    3. Temperature telemetry data is actively shared with the external datacenter CDU to ramp up liquid coolant flow rates.

3. Thermal-Aware / Energy-Aware Scheduling

  • Objective (Center): Eliminates physical ‘Hotspots’ within the server room layout and optimizes overall air conditioning (AC) power efficiency.
  • Mechanism (Right): Distributes heavy workloads away from physical servers trapped in low-cooling zones to servers located in cooler zones.
    1. The localized ambient temperature around a specific server rack rises.
    2. The datacenter orchestrator and the kernel work together to throttle the target CPU’s capacity weights.
    3. The Linux scheduler automatically migrates heavy compute tasks to cooler servers across the room in real-time.

Modern Linux has evolved beyond managing isolated servers; it now acts as a holistic orchestrator that treats the datacenter’s power grid, liquid cooling loops, and air conditioning as a single, unified organism.

#LinuxKernel #PowerManagement #ThermalSubsystem #EnergyAwareScheduling #DatacenterInfrastructure #DCIM #LiquidCooling #GreenComputing #HPC #InfrastructureAutomation #CloudInfrastructure

With Gemini

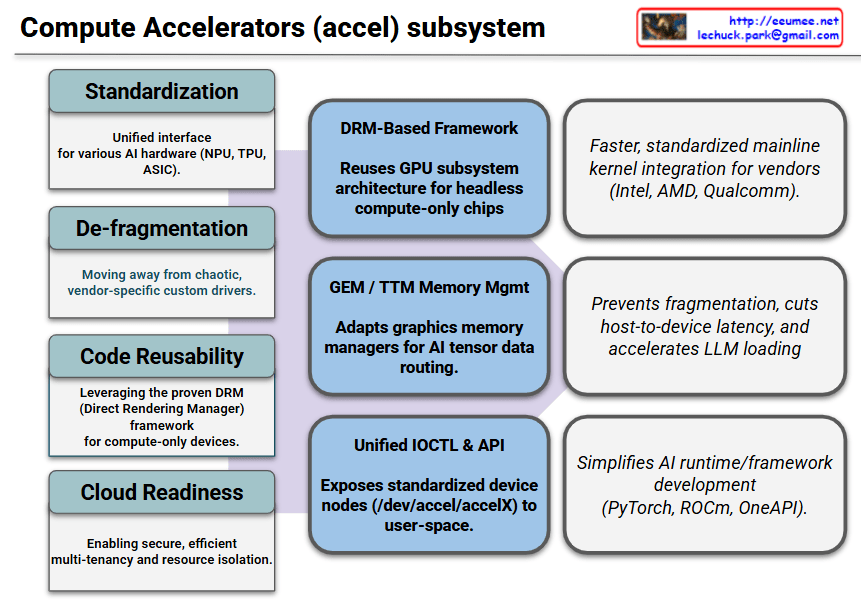
Compute Accelerators (accel) subsystem

Here is the explanation of the provided diagram, which illustrates the architectural flow of the Linux kernel’s Compute Accelerators (accel) subsystem from its initial goals to its final real-world impacts.

1. Objectives & Background (Left Grey Blocks)

This section defines the systemic issues the accel subsystem was created to solve.

  • Standardization: Establishes a unified, consistent interface across diverse AI hardware types such as NPUs, TPUs, and custom ASICs.
  • De-fragmentation: Eliminates the chaotic era of vendor-specific, closed, or fragmented custom drivers.
  • Code Reusability: Leverages the mature and battle-tested DRM (Direct Rendering Manager) framework specifically tailored for “headless” (compute-only) devices.
  • Cloud Readiness: Lays the foundation for secure, efficient multi-tenancy and robust hardware resource isolation in data centers.

2. Key Features (Center Blue Blocks)

These are the core technical mechanisms implemented inside the Linux kernel to achieve the defined goals.

  • DRM-Based Framework: Reuses the underlying GPU subsystem architecture to manage headless compute chips smoothly within drivers/accel/.
  • GEM / TTM Memory Mgmt: Adapts established graphics memory management technologies (GEM and TTM) to efficiently route massive AI tensor data.
  • Unified IOCTL & API: Exposes standardized device nodes (e.g., /dev/accel/accelX) directly to user-space applications.

3. Real-World Effects & Benefits (Right White Blocks)

This section outlines the concrete performance gains and development advantages delivered to hardware vendors and AI developers.

  • For Hardware Vendors (Intel, AMD, Qualcomm, etc.): Enables faster, highly standardized integration of physical drivers directly into the upstream mainline Linux kernel.
  • For System Performance: Prevents system memory fragmentation, radically slashes host-to-device latency, and accelerates the loading speeds of massive LLM (Large Language Model) weights.
  • For AI Framework Development: Significantly simplifies the engineering efforts required to build and optimize upper-layer AI runtimes and frameworks like PyTorch, AMD ROCm, and Intel OneAPI.

The Linux kernel’s accel subsystem leverages the proven DRM framework and GEM/TTM memory management to standardize diverse AI hardware interfaces, thereby eliminating vendor driver fragmentation, slashing data latency for LLMs, and drastically simplifying cloud multi-tenancy and AI framework development.

#LinuxKernel #AIAccelerator #ComputeAccelerators #NPU #GPU #DRM #KernelArchitecture #OpenSource #PyTorch #LLM #CloudComputing