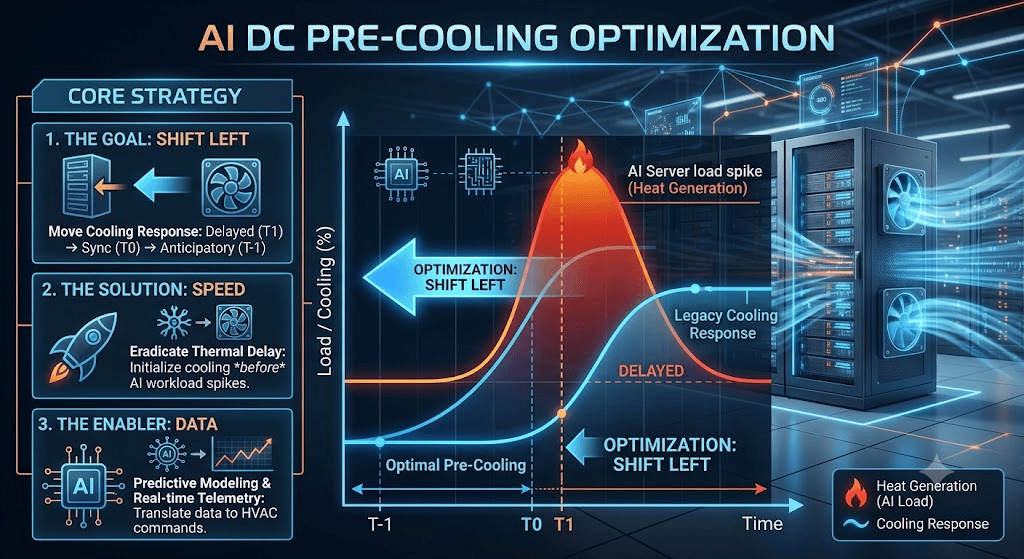
This image is an infographic that visually explains “AI DC PRE-COOLING OPTIMIZATION.”
Main Graph (Right Side): This section plots Load/Cooling capacity (Y-axis) against Time (X-axis).
Red Curve: Represents a massive spike in “Heat Generation” caused by surging AI server workloads.
Dark Blue Line (Legacy Cooling): Shows how traditional cooling systems react with a significant delay (starting around T1), allowing heat to build up before responding.
Light Blue Line (Optimal Pre-Cooling): This is the core message. Highlighted by large glowing arrows, the graph illustrates the “Shift Left” optimization. It shows the cooling response initiating proactively at (T-1)—well before the heat spike occurs. The background enhances this with 3D renderings of modern server racks and flowing blue cooling air.
Core Strategy (Left Panel): This section breaks down the three elements required to achieve this optimization, accompanied by icons.
The Goal (SHIFT LEFT): Moving the cooling response backward in time from a delayed state (T1), to synchronized (T0), and ultimately to an anticipatory state (T-1).
The Solution (SPEED): Emphasizes eradicating thermal delay by initializing cooling before the AI workloads spike.
The Enabler (DATA): Highlights that predictive modeling and real-time telemetry are essential to instantly translate data into actionable HVAC commands.
Summary
This infographic visually demonstrates the necessity and mechanism of a “Shift Left” pre-cooling strategy. It shows how leveraging real-time data to initiate cooling before AI workloads generate massive heat can effectively and preemptively manage data center thermal loads.
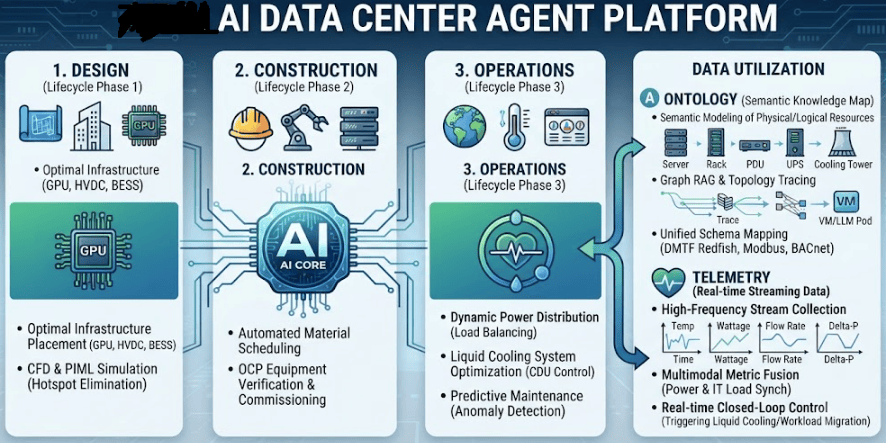
At the top of the image is the title “AI DATA CENTER AGENT PLATFORM”, outlining a system structured around three lifecycle phases and a Data Utilization sector, all orchestrated by the central ‘AI CORE’.
1. DESIGN (Lifecycle Phase 1)
Key Role: Determines optimal infrastructure layouts for high-density GPU clusters, 800V HVDC, and BESS.
Core Technology: Uses CFD and PIML simulations to preemptively eliminate thermal hotspots.
2. CONSTRUCTION (Lifecycle Phase 2)
Key Role: Automates material procurement scheduling and verifies installation compliance for OCP standard equipment.
Core Technology: Streamlines the commissioning process to eliminate human errors and enhance deployment efficiency.
3. OPERATIONS (Lifecycle Phase 3)
Key Role: Executes dynamic power distribution (load balancing) for real-time load fluctuations and optimizes liquid cooling via CDU control.
Core Technology: Performs predictive maintenance with anomaly detection to preemptively prevent failures.
4. DATA UTILIZATION
A. ONTOLOGY (Semantic Knowledge Map)
Defines hierarchical relationships among physical and logical resources (Servers, Racks, PDUs, UPS, Cooling Towers) using semantic modeling.
Utilizes Graph RAG and topology mapping to trace affected VMs or LLM serving Pods within milliseconds during a failure.
Integrates heterogeneous equipment data through standardized schemas (DMTF Redfish, Modbus, BACnet).
B. TELEMETRY (Real-time Streaming Data)
Collects high-frequency time-series streaming data including temperature, wattage, flow rate, and delta-P.
Fuses power infrastructure metrics with IT workload metrics to predict thermal and power peaks proactively.
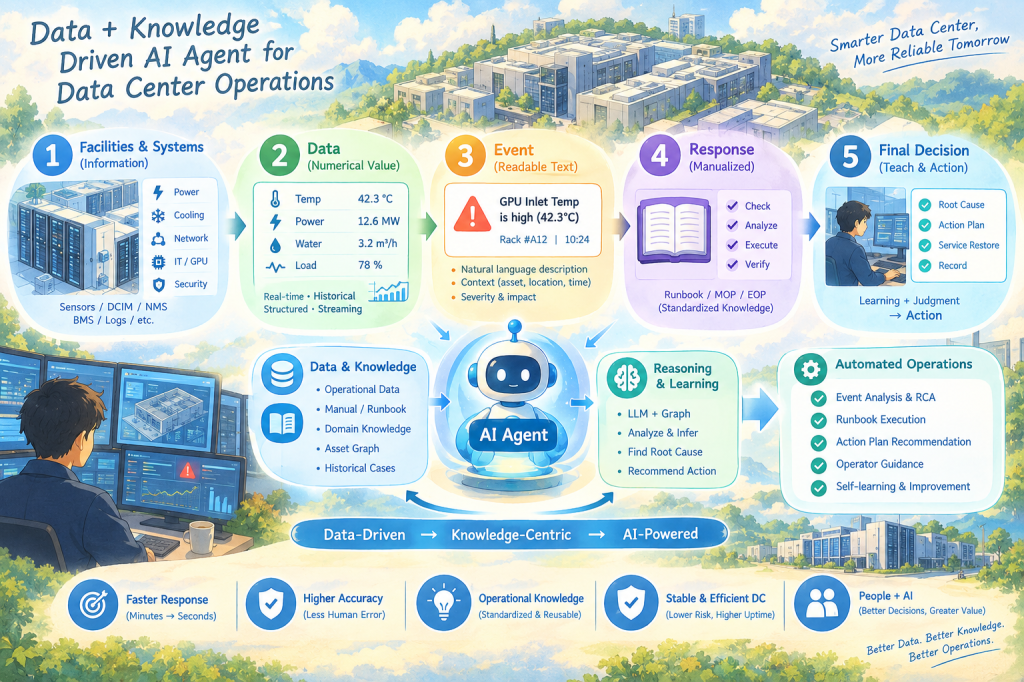
Data & Knowledge Driven AI Agent for Data Center Operations
This illustration describes how data center operations can evolve from facility data → operational knowledge → AI Agent → automated operations.
The key message is not simply that AI controls data center equipment.
Rather, it shows how AI Agents can connect operational data with accumulated human knowledge, understand operational situations, reason about incidents, and support or automate operational actions.
1. Facilities & Systems
The process starts with the physical infrastructure and operational systems of the data center.
The illustration represents:
Power
Cooling
Network
IT / GPU
Security
Environment
Sensors and systems continuously generate operational information.
Systems such as DCIM, NMS, BMS, and log platforms collect this information.
In simple terms:
Facilities generate information, and systems collect it.
2. Data — From Information to Metrics
Facility information is transformed into measurable operational data.
For example:
Temperature → 42.3°C
Power Load → 12.6 MW
Water Flow → 3.2 m³/h
Utilization → 78%
The important point is that the AI Agent uses both:
Real-time Data + Historical Data
Real-time data tells the Agent what is happening now, while historical data provides the operational context and previous experience.
3. Event — Turning Numbers into Meaning
Raw numbers are not always meaningful to operators.
Therefore, data is transformed into understandable events.
For example:
GPU Inlet Temperature is high (42.3°C)
Now the numerical value has become a meaningful operational event.
The event also contains context such as:
What happened + Where + When + Severity + Impact
This is important because the AI Agent does not need to operate only on raw numbers. It can reason about meaningful operational situations.
4. Response — Operational Knowledge
When an event occurs, traditional operations rely on manuals and experienced operators.
The illustration represents this knowledge through:
Runbook
MOP
EOP
SOP
Best Practices
A typical response process can be:
Check → Analyze → Execute → Verify
This represents the transformation of human experience into reusable operational knowledge.
Human Experience → Documentation → Operational Knowledge
This knowledge becomes one of the most important assets for the AI Agent.
5. Final Decision — Judgment & Action
The final stage goes beyond detecting an event.
The operational process becomes:
Root Cause → Action Plan → Service Restore → Record
Traditionally, experienced operators perform much of this reasoning manually.
With an AI Agent, operational data and knowledge can be combined to support:
Root-cause analysis
Action recommendations
Runbook execution
Operator guidance
Controlled automation
In a real data center, however, autonomous action should be governed by policies, safety controls, and human approval where required.
The Center of the Illustration — AI Agent
The AI Agent sits at the center because it connects Data and Knowledge.
Data
Operational Data
Facility & Asset Data
Event & Incident Data
Historical Cases
Asset / Relationship Data
Knowledge
Manuals
Runbooks
SOP / MOP / EOP
Domain Knowledge
Best Practices
Past Cases & Lessons
The Agent combines these two layers to perform:
Learn → Reason → Act
A simple way to express the concept is:
Data tells the Agent what is happening. Knowledge tells the Agent what it means and what to do.
The Core Message
The most important point of the illustration is that the AI Agent itself is not the foundation.
The real foundation is:
Data → Knowledge → AI Agent → Operations
Without accurate data, the Agent cannot reliably understand the current state.
Without structured operational knowledge, the Agent cannot reliably determine what the situation means or what response is appropriate.
Therefore, the real objective of AI-enabled data center operations is not simply:
“Deploy AI.”
It is:
“Make operational data and knowledge usable by AI.”
The Transformation of Data Center Operations
The bottom of the illustration shows:
Data-Driven → Knowledge-Centric → AI-Powered
This represents the evolution of operational models.
Traditional Operations
Human → Data → Manual Analysis → Manual Action
AI Agent-Based Operations
Data + Knowledge → AI Agent → Reasoning → Recommended / Controlled Action
The role of people does not disappear.
Instead, it changes.
AI handles repetitive monitoring, analysis, and operational assistance, while people focus more on judgment, decision-making, exception handling, and continuous improvement.
This is why the final concept is:
People + AI
rather than simply AI replaces People.
One-Sentence Summary
By connecting data generated from data center facilities with operational knowledge, an AI Agent can understand, reason, and support or automate operational actions—transforming human-centered operations into data- and knowledge-driven intelligent operations.
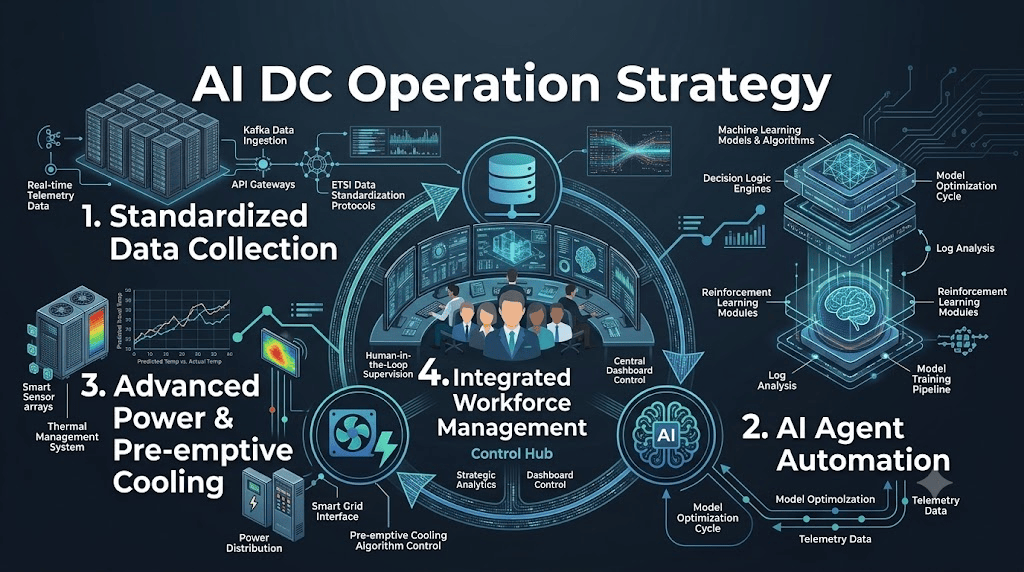
This image is a highly technical, professional infographic utilizing a dark blue and teal neon cybernetic aesthetic to illustrate the organic and automated ecosystem of AI Data Center operations. The overall layout features a continuous feedback loop where four core elements dynamically interact around a central command hub.
1. Standardized Data Collection (Top Left) This section represents the entry point for rapidly and accurately ingesting vast amounts of facility data. Depicting server racks alongside technical nodes like Kafka data pipelines, API Gateways, and standardization protocols (e.g., ETSI), it visually demonstrates the high-speed collection and standardization of real-time telemetry data from diverse infrastructure components.
2. AI Agent Automation (Right) Acting as the “brain” of the operation, this area processes the ingested data to execute intelligent control. Centered around a glowing AI brain icon, it highlights machine learning algorithms, reinforcement learning modules, and decision logic engines. It illustrates a system that goes beyond simple monitoring—where AI models continuously learn, run through model optimization cycles, and elevate the level of operational automation.
3. Advanced Power & Pre-emptive Cooling (Bottom Left) This section addresses the physical infrastructure required to handle the high-density heat and power demands typical of AI workloads. It features smart sensor arrays, power distribution units, and thermal management systems. Notably, a chart comparing “Predicted Temp vs. Actual Temp” visually proves the application of pre-emptive cooling algorithms—shifting from reactive cooling to data-driven, proactive thermal mitigation.
4. Integrated Workforce Management (Center) Positioned at the heart of the graphic, this is the Control Hub that orchestrates the entire advanced ecosystem. A team of professionals is shown surrounded by large dashboard monitors. This emphasizes that AI does not replace humans; rather, it empowers a highly skilled workforce to focus on “Human-in-the-Loop Supervision,” strategic analytics, and continuous data-driven improvement across the expanded data center footprint.
📌 Summary
This infographic illustrates that AI Data Center operations have evolved into an “intelligent, autonomous ecosystem.” It showcases a perfect virtuous cycle: Standardized data (1) feeds AI agents (2), which in turn drive proactive power and pre-emptive cooling infrastructure (3). Ultimately, an empowered, highly-skilled workforce (4) strategically orchestrates, verifies, and optimizes this entire continuous loop from a central control hub.
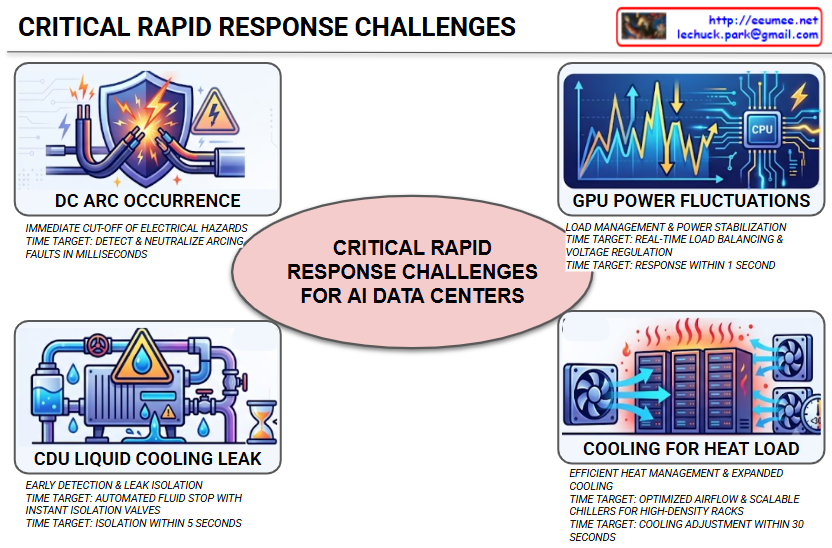
This image is an infographic structured around the central core theme, “CRITICAL RAPID RESPONSE CHALLENGES FOR AI DATA CENTERS,” presented within an oval, under the general title “CRITICAL RAPID RESPONSE CHALLENGES.”
It conveys the crucial message that as AI technology advancements cause data center power densities and heat loads to skyrocket, an extremely rapid response is absolutely essential whenever unexpected equipment failures or hazardous situations occur. Surrounding the central core theme, four specific threat scenarios and their target response times are detailed with corresponding visual icons.It conveys the crucial message that as AI technology advancements cause data center power densities and heat loads to skyrocket, an extremely rapid response is absolutely essential whenever unexpected equipment failures or hazardous situations occur. Surrounding the central core theme, four specific threat scenarios and their target response times are detailed with corresponding visual icons.
DC ARC OCCURRENCE – Top Left:
Visual Elements: Powerful sparks (arcs) are flying between electrical cables, with a shield and a warning sign featuring a lightning bolt symbol blocking them.
Description: An arc, which is a luminous electrical discharge across a gap in a circuit, poses a severe fire hazard. The infographic calls for an immediate cut-off of electrical hazards and specifically sets a target time to detect and neutralize arcing faults in milliseconds.
GPU POWER FLUCTUATIONS – Top Right:
Visual Elements: A combination of a wildly fluctuating line graph, a CPU chip icon labeled ‘CPU’, and a lightning bolt symbol.
Description: GPUs performing high-performance AI computations consume massive amounts of power, and consequently, the fluctuations in their power supply are significant. This can lead to system instability. To address this, load management and power stabilization are required, with a target response within 1 second achieved through real-time load balancing and voltage regulation.
CDU LIQUID COOLING LEAK – Bottom Left:
Visual Elements: A cooling system (CDU, Coolant Distribution Unit) composed of pipes, a pump, and a tank is actively dripping water droplets, accompanied by a warning triangle and an hourglass icon.
Description: A leak in the liquid cooling system used to cool high-density server racks can be fatal to sensitive electronic equipment. Early detection and leak isolation are the top priority, with a target to achieve isolation within 5 seconds by implementing an automated fluid stop with instant isolation valves.
COOLING FOR HEAT LOAD – Bottom Right:
Visual Elements: Hot heat icons are rising above multiple server racks, while powerful cooling fans around them are operating to circulate the air.
Description: Controlling the immense heat generated by the massive computations of AI servers is a cornerstone of data center operations. There is a need for efficient heat management and expanded cooling systems, with a target to complete a cooling adjustment within 30 seconds through optimized airflow and scalable chillers for high-density racks.
Summary
This infographic highlights four fatal risk factors related to power and thermal management that AI-dedicated data centers face. The key takeaway is the critical need for an extremely rapid, automated response, ranging from milliseconds to tens of seconds, when these issues occur to prevent major catastrophes such as system downtime or fire.This infographic highlights four fatal risk factors related to power and thermal management that AI-dedicated data centers face. The key takeaway is the critical need for an extremely rapid, automated response, ranging from milliseconds to tens of seconds, when these issues occur to prevent major catastrophes such as system downtime or fire.
This infographic provides a clear at-a-glance comparison of the changing cost structures between Traditional Data Centers and Artificial Intelligence (AI) Data Centers. It visualizes how the focus of costs for both building (CAPEX) and operating (OPEX) data centers is dramatically shifting in response to technological advancements and the explosion in AI demand.This infographic provides a clear at-a-glance comparison of the changing cost structures between Traditional Data Centers and Artificial Intelligence (AI) Data Centers. It visualizes how the focus of costs for both building (CAPEX) and operating (OPEX) data centers is dramatically shifting in response to technological advancements and the explosion in AI demand.
1. Overall Image Structure The image is split vertically down the middle, representing the ‘Traditional Data Center (Traditional DC)’ on the left and the ‘AI Data Center (AI DC)’ on the right. Each side is majorly categorized into ‘1. Build-out Costs (CAPEX)’, ‘2. Operating Costs (OPEX)’, and a bottom section dedicated to ‘Efficiency Focus’. Notably, the AI Data Center side features additional blocks for ‘Service & Damage Costs’ and ‘Risk Reduction’.
2. Detailed Breakdown
Comparison of Build-out Costs (CAPEX):
Traditional Data Center: Focuses on the general construction process of acquiring spacious Land (Terrain), building a standard structure (Building), and installing Power Infrastructure (Electrical Systems) and HVAC Systems (Cooling Systems).
AI Data Center: Shifts focus from simple construction to technology-intensive infrastructure. Instead of standard racks, High-Density Racks (HPC Racks) are densely packed, and to manage the immense heat, Direct Liquid Cooling (DLC) Systems are depicted as essential, replacing traditional air cooling. The visual density of the server cluster standing on the terrain is much higher.
Comparison of Operating Costs (OPEX):
Traditional Data Center: Shows a gradual and moderate increasing trend over time for all OPEX categories: Power (Energy Costs), Staff (Labor Costs), Maintenance (Facility Maintenance), and Water (Water Costs). There is a relative balance among the four categories.
AI Data Center: Completely breaks from the traditional trend. It shows an overwhelming and explosive increase in Power (Massive Energy Increase) costs, depicted as a gigantic orange-to-yellow bar chart. The text next to the chart explicitly states, “IT power is mandatory, hard to reduce.” Compared to the power costs, the costs for staff, maintenance, and water are displayed as relatively negligible. A flame shape is added next to the power icon, hinting at high heat generation.
AI Data Center Unique Elements: New Risks and Solutions
Service & Damage Costs: Visualizes how “GPU Server Damages” and “AI Service Interruptions”, which were not major OPEX categories in traditional data centers, have emerged as enormous damage costs in AI DCs. This is depicted through an exploding server rack and shattered block icons.
Risk Reduction: Presents “Staff Efficiency” as the critical key to reducing these fatal risks. It shows professional staff monitoring dashboards, with arrows connecting this efficient operation to solving problems like cooling inefficiency and ultimately preventing risks.
Efficiency Focus: The bottom section emphasizes ‘Cooling Energy Efficiency’ (smart sensors, airflow optimization) and ‘Operational Staff Efficiency’ (automation, expert tools) as common challenges for both types of data centers. On the AI DC side, this staff efficiency is re-emphasized as a critical driver for power management and risk reduction.
Summary
The core message of this infographic is the fundamental revolution in cost structures brought about by the transition to AI Data Centers. While Traditional Data Centers focused on the physical construction costs of land and buildings and a balance among various operational items, AI Data Centers see CAPEX concentrated in high-density and liquid cooling infrastructure, and at the operational stage, overwhelming power costs account for most of the OPEX. Furthermore, high-ticket damage costs like GPU server failures or service interruptions, which were negligible in traditional centers, have emerged as major new OPEX items, showing that predicting and preventing these fatal risks through expert operating staff has become the most important efficiency challenge, going beyond just saving electricity.The core message of this infographic is the fundamental revolution in cost structures brought about by the transition to AI Data Centers. While Traditional Data Centers focused on the physical construction costs of land and buildings and a balance among various operational items, AI Data Centers see CAPEX concentrated in high-density and liquid cooling infrastructure, and at the operational stage, overwhelming power costs account for most of the OPEX. Furthermore, high-ticket damage costs like GPU server failures or service interruptions, which were negligible in traditional centers, have emerged as major new OPEX items, showing that predicting and preventing these fatal risks through expert operating staff has become the most important efficiency challenge, going beyond just saving electricity.

 Lechuck Park