2 GPU Throttling

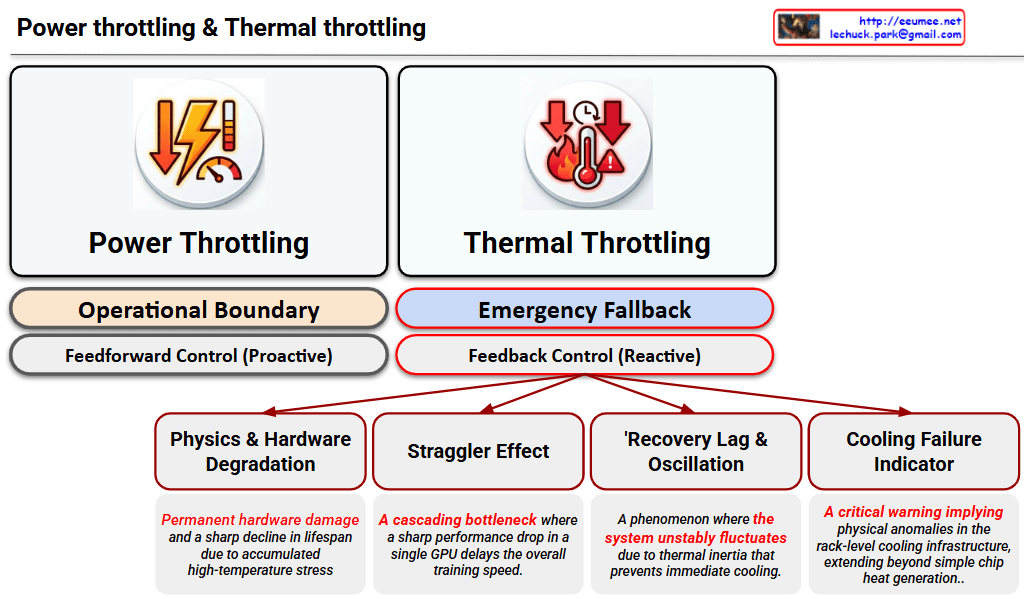
This image is a Visual Engineering diagram that contrasts the fundamental control mechanisms of Power Throttling and Thermal Throttling at a glance, specifically highlighting the critical impact thermal throttling has on the system.


1. Philosophical and Structural Contrast (Top Section)

The diagram places the two throttling methods side-by-side, clearly distinguishing them not just as similar performance limiters, but as mechanisms with completely different operational philosophies.

  • Left: Power Throttling
    • Operational Boundary: Indicates that this acts as a safety line, keeping the system operating ‘normally’ within its designed power limits.
    • Feedforward Control (Proactive): Specifies that this is a proactive control method that restricts input (power demand) before a negative result occurs, fundamentally preventing the issue from happening.
  • Right: Thermal Throttling
    • Emergency Fallback: Shows that this is not a normal operational state, but a ‘last line of defense’ triggered to prevent physical destruction.
    • Feedback Control (Reactive): Emphasizes that this is a reactive control method that drops clock speeds only after detecting the result (high heat exceeding the safe threshold).

2. Four Fatal Risks of Thermal Throttling (Bottom Tree Structure)

The core strength of the diagram lies in placing the sub-tree structure exclusively under Thermal Throttling. This highlights that this phenomenon goes beyond a simple performance drop, breaking down its complex, detrimental impacts on the infrastructure into four key factors:

  1. Physics & Hardware Degradation: Refers to direct damage to semiconductors (silicon) and the shortening of their lifespan (MTBF) due to the accumulated stress of high heat.
  2. Straggler Effect: Points out the bottleneck phenomenon in environments like distributed AI training. A delay in a single, thermally throttled node drags down the synchronization and data processing speed of the entire cluster.
  3. Thermal Inertia & Thermal Oscillations: Describes the unstable fluctuation of system performance. Because heat does not dissipate instantly (thermal inertia), the system repeatedly drops and recovers clock speeds, causing the performance to oscillate.
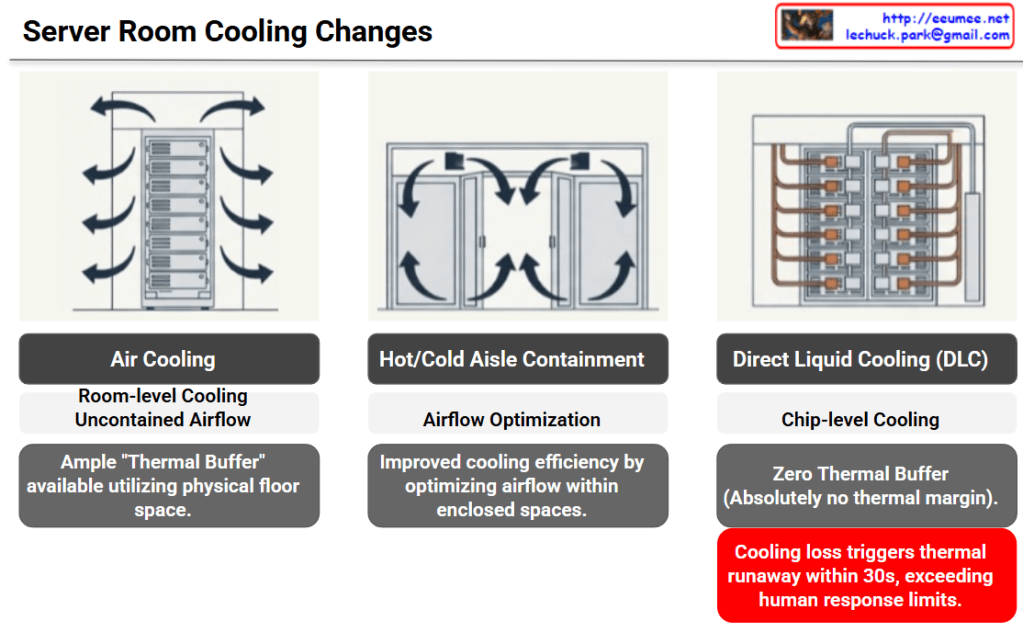
  4. Cooling Failure Indicator: Acts as a severe alarm. It implies that the issue extends beyond a hot chip—it indicates that the facility’s infrastructure, such as the rack-level Direct Liquid Cooling (DLC) capacity, has reached its physical limit or experienced an anomaly.

Overall Summary:

The diagram logically and intuitively delivers a powerful core message: “Power Throttling is a normal, proactive control within predictable bounds, whereas Thermal Throttling is a severe, reactive warning at both the hardware and infrastructure levels after control is lost.” It is an excellent piece of work that elegantly structures complex system operations using concise text and layout.

#DataCenter #AIInfrastructure #GPUCooling #ThermalThrottling #PowerThrottling #HardwareEngineering #HighPerformanceComputing #LiquidCooling #SystemArchitecture

DC Data Service Model


DC Data Service Model Overview

This diagram outlines the evolutionary roadmap of a Data Center (DC) Data Service Model. It illustrates how data center operations advance from basic monitoring to a highly autonomous, AI-driven environment. The model is structured across three functional pillars—Data, View, and Analysis—and progresses through three key service tiers.

Here is a breakdown of the evolving stages:

1. Basic Tier (The Foundation)

This is the foundational level, focusing on essential monitoring and billing.

  • Data: It begins with collecting Server Room Data via APIs.
  • View: Operators use a Server Room 2D View to track basic statuses like room layouts, rack placement, power consumption, and temperatures.
  • Analysis: The collected data is used to generate a basic Usage Report, primarily for customer billing.

2. Enhanced Tier (Real-time & Expanded Scope)

This tier broadens the monitoring scope and provides deeper operational insights.

  • Data: Data collection is expanded beyond the server room to include the Common Facility (Data Extension).
  • View: The user interface upgrades to a dynamic Dashboard that displays real-time operational trends.
  • Analysis: Reporting evolves into an Analysis Report, designed to extract deeper insights and improve overall service value.

3. The Bridge: Data Quality Up

Before transitioning to the ultimate AI-driven tier, there is a critical prerequisite layer. To effectively utilize AI, the system must secure data of High Precision & High Resolution. High-quality data is the fuel for the advanced services that follow.

4. Premium Tier (AI Agent as the Ultimate Orchestrator)

This is the ultimate goal of the model. The updated diagram highlights a clear, sequential flow where each advanced technology builds upon the last, culminating in a comprehensive AI Agent Service:

  • AI/ML Service: The high-quality data is first processed here to automatically detect anomalies and calculate optimizations (e.g., maximizing cooling and power efficiency).
  • Digital Twin: The analytical insights from the AI/ML layer are then integrated into a Digital Twin—a virtual, highly accurate replica of the physical data center used for real-time simulation and spatial monitoring.
  • AI Agent Service: This is the final and most critical layer. The AI Agent does not just sit alongside the other tools; it acts as the central brain. Through this final Agent Service, the capabilities of all preceding services are expanded and put into action. By leveraging the predictive power of the AI/ML models and the comprehensive visibility of the Digital Twin, the AI Agent can autonomously manage, resolve issues, and optimize the data center, maximizing the ultimate value of the entire data pipeline.

#DataCenter #DCIM #AIAgent #DigitalTwin #MachineLearning #ITOperations #TechInfrastructure #FutureOfTech #SmartDataCenter

Cooling Changes

The provided image illustrates the evolution of data center cooling methods and the corresponding increase in risk—specifically, the drastic reduction of available thermal buffer space—categorized into three stages.

Here is a breakdown of each cooling method shown:

1. Air Cooling

  • Method: The most traditional approach, providing room-level cooling with uncontained airflow.
  • Characteristics: The physical space of the server room acts as a sponge for heat. Because of this, there is an ample “Thermal Buffer” utilizing the floor space. If the cooling system fails, it takes some time for temperatures to reach critical levels.

2. Hot/Cold Aisle Containment

  • Method: Physically separates the cold intake air from the hot exhaust air to prevent them from mixing.
  • Characteristics: Focuses on Airflow Optimization. It significantly improves cooling efficiency by directing and controlling the airflow within enclosed spaces.

3. Direct Liquid Cooling (DLC)

  • Method: A high-density, chip-level cooling approach that brings liquid coolant directly to the primary heat-generating components (like CPUs or GPUs).
  • Characteristics: While cooling efficiency is maximized, there is Zero Thermal Buffer. There is absolutely no thermal margin provided by surrounding air or room volume.

💡 Core Implication (The Red Warning Box)

The ultimate takeaway of this slide is highlighted in the bottom right corner.

In a DLC environment, a loss of cooling triggers thermal runaway within 30 seconds. This speed fundamentally exceeds human response limits. It is no longer feasible for a facility manager to hear an alarm, diagnose the issue, and manually intervene before catastrophic failure occurs in modern, high-density servers.


Summary

  • Evolution of Efficiency: Data center cooling is shifting from broad, room-level air cooling to highly efficient, chip-level Direct Liquid Cooling (DLC).
  • Loss of Thermal Buffer: This transition completely eliminates the physical thermal margin, meaning there is zero room for error if the cooling system fails.
  • Automation is Mandatory: Because DLC cooling loss causes thermal runaway in under 30 seconds—faster than humans can react—AI-driven, automated operational agents are now essential to protect infrastructure.

#DataCenter #DataCenterCooling #DirectLiquidCooling #ThermalRunaway #AIOps #InfrastructureManagement

With Gemini

Data Center Changes

The Evolution of Data Centers

This infographic, titled “Data Center Changes,” visually explains how data center requirements are skyrocketing due to the shift from traditional computing to AI-driven workloads.

The chart compares three stages of data centers across two main metrics: Rack Density (how much power a single server rack consumes, shown on the vertical axis) and the overall Total Power Capacity (represented by the size and labels of the circles).

  • Traditional DC (Data Center): In the past, data centers ran at a very low rack density of around 2kW. The total power capacity required for a facility was relatively small, at around 10 MW.
  • Cloud-native DC: As cloud computing took over, the demands increased. Rack densities jumped to about 10kW, and the overall facility size grew to require around 100 MW of power.
  • AI DC: This is where we see a massive leap. Driven by heavy GPU workloads, AI data centers push rack densities beyond 100kW+. The scale of these facilities is enormous, demanding up to 1GW of power. The red starburst shape also highlights a new challenge: “Ultra-high Volatility,” meaning the power draw isn’t stable; it spikes violently depending on what the AI is processing.

The Three Core Challenges (Bottom Panels)

The bottom three panels summarize the key takeaways of transitioning to AI Data Centers:

  1. Scale (Massive Investment): Building a 1GW “Campus-scale” AI data center requires astronomical capital expenditure (CAPEX). To put this into perspective, the chart notes that just 10MW costs roughly 200 billion KRW (South Korean Won). Scaling that to 1GW is a colossal financial undertaking.
  2. Density (The Need for Liquid Cooling): Power density per rack is jumping from 2kW to 100kW—a 50x increase. Traditional air-conditioning cannot cool servers running this hot, meaning the industry must transition to advanced liquid cooling technologies.
  3. Volatility (Unpredictable Demands): Unlike traditional servers that run at a steady hum, AI GPU workloads change in real-time. A sudden surge in computing tasks instantly spikes both the electricity needed to run the GPUs and the cooling power needed to keep them from melting.

Summary

  • Data centers are undergoing a massive transformation from Traditional (10MW) and Cloud (100MW) models to gigantic AI Data Centers requiring up to 1 Gigawatt (1GW) of power.
  • Because AI servers use powerful GPUs, power density per rack is increasing 50-fold (up to 100kW+), forcing a shift from traditional air cooling to advanced liquid cooling.
  • This AI infrastructure requires staggering financial investments (CAPEX) and must be designed to handle extreme, real-time volatility in both power and cooling demands.

#DataCenter #AIDataCenter #LiquidCooling #GPU #CloudComputing #TechTrends #TechInfrastructure #CAPEX

With Gemini

Operation Evolutions

By following the red circle with the ‘Actions’ (clicking hand) icon, you can easily track how the control and operational authority shift throughout the four stages.

Stage 1: Human Control

  • Structure: Facility ➡️ Human Control
  • Description: This represents the most traditional, manual approach. Without a centralized data system, human operators directly monitor the facility’s status and manually execute all Actions based on their physical observations and judgment.

Stage 2: Data System

  • Structure: Facility ➡️ Data System ➡️ Human Control
  • Description: A monitoring or data system (like a dashboard) is introduced. Humans now rely on the data collected by the system to understand the facility’s condition. However, the final Actions are still manually performed by humans.

Stage 3: Agent Co-work

  • Structure: Facility ➡️ Data System ➡️ Agent Co-work ➡️ Human Control
  • Description: An AI Agent is introduced as an intermediary between the data system and the human operator. The AI analyzes the data and provides insights, recommendations, or assistance. Even with this support, the final decision-making and physical Actions remain entirely the human’s responsibility.

Stage 4: Autonomous (Auto-nomous)

  • Structure: Facility ➡️ Data System ➡️ Auto-nomous ↔️ Human Guide
  • Description: This is the ultimate stage of operational evolution. The authority to execute Actions has shifted from the human to the AI. The AI analyzes data, makes independent decisions, and autonomously controls the facility. The human’s role transitions from a direct controller to a ‘Human Guide’, supervising the AI and providing high-level directives. The two-way arrow indicates a continuous, interactive feedback loop where the human and AI collaborate to refine and optimize the system.

Summary:

This slide intuitively illustrates a paradigm shift in infrastructure operations: progressing from Direct Human Intervention ➡️ System-Assisted Cognition ➡️ AI-Assisted Operations (Co-work) ➡️ Fully Autonomous AI Control with Human Supervision.

#AIOps #AutonomousOperations #TechEvolution #DigitalTransformation #DataCenter #FacilityManagement #InfrastructureAutomation #SmartFacilities #AIAgents #FutureOfWork #HumanAndAI #Automation

with Gemini

The High Stakes of Ultra-High Density: Seconds to React, Massive Costs

This image visually compares the critical changes and risks that occur when a data center or IT infrastructure transitions to an “Ultra-high Density” environment across three key metrics.

1. Surge in Power Density (Top Row)

  • Past/Standard Environment (Blue): Racks typically operated at a power density of 4-10 kW per Rack.
  • Transition (Middle): The shift toward Ultra-high Density infrastructure (driven by AI, High-Performance Computing, etc.).
  • Current/Ultra-high Density (Red): Power density explodes to 100 kW per Rack, which is a 10-fold increase.

2. Drastic Drop in Response Time (Middle Row)

  • Past/Standard Environment: In the event of a cooling failure or system issue, operators had a comfortable golden window of 20-30 minutes to react before systems went down.
  • Transition: Focusing on the change in Response Time.
  • Current/Ultra-high Density: Due to the massive, instantaneous heat generation, the reaction window plummets to a mere 10-30 seconds. This makes manual human intervention practically impossible.

3. Explosion of Damage Costs (Bottom Row)

  • Past/Standard Environment: The financial loss caused by system downtime was around $10,000 (10K USD) per minute.
  • Transition: Focusing on the change in Damage costs.
  • Current/Ultra-high Density: Because of the high value of the equipment and the critical nature of the data being processed, the cost of downtime skyrockets to $100,000 (100K USD) per minute—a 10x increase.

💡 Overall Summary

The core message of this infographic is a strong warning: “In ultra-high density environments reaching 100kW per rack, the window for disaster response shrinks from minutes to mere seconds, while the financial loss per minute multiplies tenfold.” This perfectly illustrates why immediate, automated cooling and response systems (such as liquid cooling or AI-driven automation) are no longer optional, but mandatory for modern data centers.


#DataCenter #UltraHighDensity #HighDensityComputing #ITInfrastructure #Downtime #CostOfDowntime #RiskManagement

With Gemini

Legacy vs AI DC

Legacy DC vs. AI Factory

1. Legacy Data Center

  • Static Load: The flat line on the graph indicates that power and compute demands are stable, continuous, and highly predictable.
  • Air Cooling: Traditional fan-based air cooling systems are sufficient to manage the heat generated by standard, lower-density server racks.
  • Minutes Level Work: System responses, resource provisioning, and facility adjustments generally occur on a scale of minutes.
  • IT & OT Silo Ops: Information Technology (servers, networking) and Operational Technology (power, cooling facilities) are managed independently in isolated silos, with no real-time data exchange.

2. AI Factory (DC)

  • Dynamic/High-Density: The volatile, jagged graph illustrates how AI workloads create extreme, rapid power spikes and demand highly dense computing resources.
  • Liquid Cooling: The immense heat output from high-performance AI chips necessitates advanced liquid cooling solutions (represented by the water drop and circulation arrows) to maintain thermal efficiency.
  • Seconds Level Works: The physical infrastructure must be highly agile, detecting and responding to sudden dynamic workload changes and thermal shifts within seconds.
  • Workload Aware: The facility dynamically adapts its cooling and power based on real-time AI computing needs. Establishing this requires robust “IT/OT Data Convergence” and the utilization of “High-Fidelity Data” as key components of a broader “Digitalization” strategy.

Summary

  1. Legacy data centers are designed for predictable, static loads using traditional air cooling, with IT and facility operations (OT) isolated from one another.
  2. AI Factories must handle highly volatile, high-density workloads, making liquid cooling and instantaneous, seconds-level infrastructure responses mandatory.
  3. Transitioning to a true “Workload Aware” facility requires a strong “Digitalization” strategy centered around “IT/OT Data Convergence” and “High-Fidelity Data.”

#AIFactory #DataCenter #LiquidCooling #WorkloadAware #ITOTConvergence #HighFidelityData #Digitalization #AIInfrastructure

With Gemini