AI agent fro DC Operations

Data & Knowledge Driven AI Agent for Data Center Operations

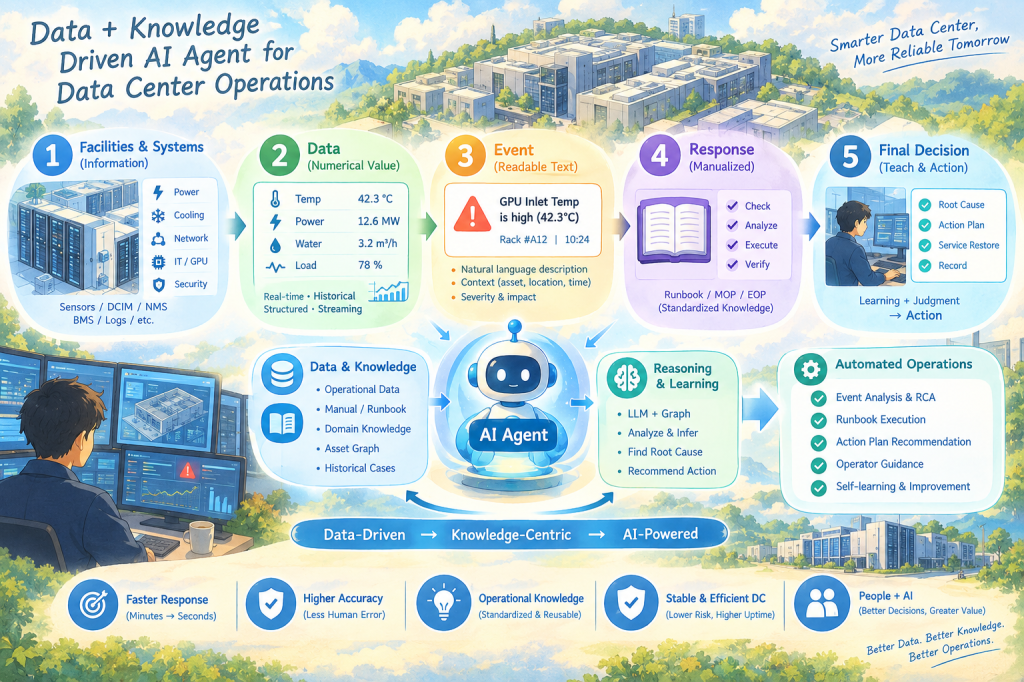
This illustration describes how data center operations can evolve from facility data → operational knowledge → AI Agent → automated operations.

The key message is not simply that AI controls data center equipment.

Rather, it shows how AI Agents can connect operational data with accumulated human knowledge, understand operational situations, reason about incidents, and support or automate operational actions.


1. Facilities & Systems

The process starts with the physical infrastructure and operational systems of the data center.

The illustration represents:

  • Power
  • Cooling
  • Network
  • IT / GPU
  • Security
  • Environment

Sensors and systems continuously generate operational information.

Systems such as DCIM, NMS, BMS, and log platforms collect this information.

In simple terms:

Facilities generate information, and systems collect it.


2. Data — From Information to Metrics

Facility information is transformed into measurable operational data.

For example:

  • Temperature → 42.3°C
  • Power Load → 12.6 MW
  • Water Flow → 3.2 m³/h
  • Utilization → 78%

The important point is that the AI Agent uses both:

Real-time Data + Historical Data

Real-time data tells the Agent what is happening now, while historical data provides the operational context and previous experience.


3. Event — Turning Numbers into Meaning

Raw numbers are not always meaningful to operators.

Therefore, data is transformed into understandable events.

For example:

GPU Inlet Temperature is high (42.3°C)

Now the numerical value has become a meaningful operational event.

The event also contains context such as:

What happened + Where + When + Severity + Impact

This is important because the AI Agent does not need to operate only on raw numbers. It can reason about meaningful operational situations.


4. Response — Operational Knowledge

When an event occurs, traditional operations rely on manuals and experienced operators.

The illustration represents this knowledge through:

  • Runbook
  • MOP
  • EOP
  • SOP
  • Best Practices

A typical response process can be:

Check → Analyze → Execute → Verify

This represents the transformation of human experience into reusable operational knowledge.

Human Experience → Documentation → Operational Knowledge

This knowledge becomes one of the most important assets for the AI Agent.


5. Final Decision — Judgment & Action

The final stage goes beyond detecting an event.

The operational process becomes:

Root Cause → Action Plan → Service Restore → Record

Traditionally, experienced operators perform much of this reasoning manually.

With an AI Agent, operational data and knowledge can be combined to support:

  • Root-cause analysis
  • Action recommendations
  • Runbook execution
  • Operator guidance
  • Controlled automation

In a real data center, however, autonomous action should be governed by policies, safety controls, and human approval where required.


The Center of the Illustration — AI Agent

The AI Agent sits at the center because it connects Data and Knowledge.

Data

  • Operational Data
  • Facility & Asset Data
  • Event & Incident Data
  • Historical Cases
  • Asset / Relationship Data

Knowledge

  • Manuals
  • Runbooks
  • SOP / MOP / EOP
  • Domain Knowledge
  • Best Practices
  • Past Cases & Lessons

The Agent combines these two layers to perform:

Learn → Reason → Act

A simple way to express the concept is:

Data tells the Agent what is happening.
Knowledge tells the Agent what it means and what to do.


The Core Message

The most important point of the illustration is that the AI Agent itself is not the foundation.

The real foundation is:

Data → Knowledge → AI Agent → Operations

Without accurate data, the Agent cannot reliably understand the current state.

Without structured operational knowledge, the Agent cannot reliably determine what the situation means or what response is appropriate.

Therefore, the real objective of AI-enabled data center operations is not simply:

“Deploy AI.”

It is:

“Make operational data and knowledge usable by AI.”


The Transformation of Data Center Operations

The bottom of the illustration shows:

Data-Driven → Knowledge-Centric → AI-Powered

This represents the evolution of operational models.

Traditional Operations

Human → Data → Manual Analysis → Manual Action

AI Agent-Based Operations

Data + Knowledge → AI Agent → Reasoning → Recommended / Controlled Action

The role of people does not disappear.

Instead, it changes.

AI handles repetitive monitoring, analysis, and operational assistance, while people focus more on judgment, decision-making, exception handling, and continuous improvement.

This is why the final concept is:

People + AI

rather than simply AI replaces People.


One-Sentence Summary

By connecting data generated from data center facilities with operational knowledge, an AI Agent can understand, reason, and support or automate operational actions—transforming human-centered operations into data- and knowledge-driven intelligent operations.

#AIDC #DataCenter #AIDataCenter #AIAgent #DataDriven #KnowledgeDriven #AIOps #DCIM #DataCenterOperations #OperationalAutomation #DigitalTransformation #DataAndKnowledge #IntelligentOperations #HumanAndAI

With ChatGPT
AI OPERATION LEARNING

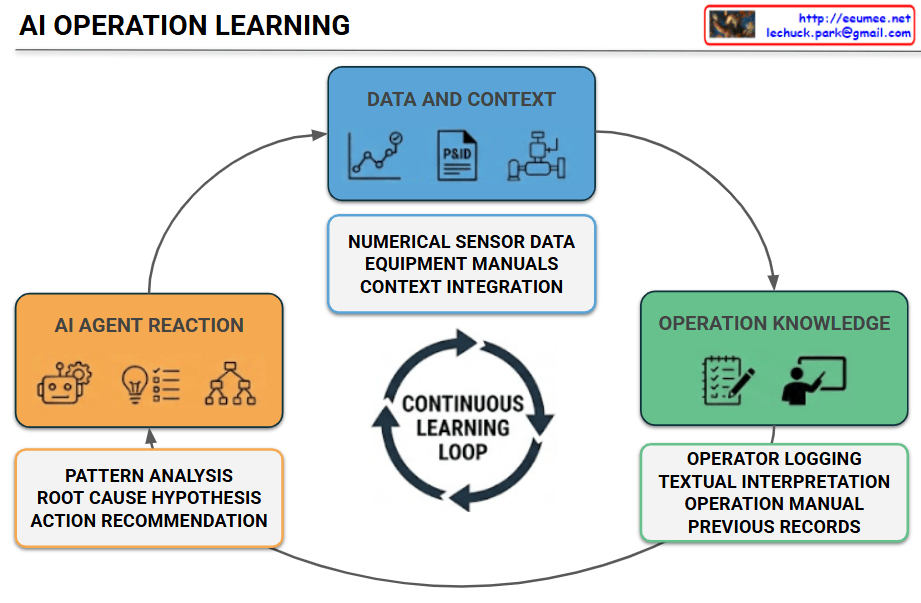
The provided image visualizes an architecture diagram titled “AI OPERATION LEARNING”, demonstrating how three core areas interact in a continuous cyclical workflow connected by circular arrows.

  • Data and Context (Top Cyan Box): Positioned as the starting point at the top, featuring icons of line graphs, P&ID schematics, and system blocks. The sub-box specifies Numerical Sensor Data, Equipment Manuals, and Context Integration, indicating that real-time sensor variations are paired with physical equipment documentation.
  • Operation Knowledge (Right Green Box): Accompanied by icons of a notepad with a pen and a presenting instructor. The lower sub-box outlines Operator Logging, Textual Interpretation, Operation Manual, and Previous Records, representing the stage where human operators record textual interpretations by referencing past logs and manuals.
  • AI Agent Reaction (Left Orange Box): Features icons of a robot face, a lightbulb representing ideas, and a decision tree structure. The lower sub-box lists Pattern Analysis, Root Cause Hypothesis, and Action Recommendation, showing how the AI analyzes data and suggests optimal countermeasures based on accumulated records.
  • Continuous Learning Loop (Center): Located right in the middle of the diagram with circular arrow loops, emphasizing that the process forms an endless virtuous cycle where the AI agent continuously learns and evolves through these operational steps.

Summary

The image cleanly summarizes an intelligent industrial operation learning cycle where numerical data shifts trigger operator text logging, which in turn feeds AI agent analysis and recommendation in an ongoing, self-improving loop.

#AIOperation #SmartFactory #ConditionMonitoring #KnowledgeManagement #AIAgent #ContinuousLearning #IndustrialAI

With Gemini

LLM Evaluations

The provided image is a flowchart diagram titled “LLM Evaluations.” It visually describes the workflow for evaluating an AI Agent’s responses and the iterative process of tuning prompts.

Here is a step-by-step description of the diagram’s flow:

  • Input Stage:
    • On the left side, there is a green block labeled “Question (Prompt).”
    • Below it, several supporting elements are listed: EVENT LOG, Config, Metrics, and Manual + @. These elements are grouped together within a light blue background, indicating they are all part of the prompt engineering or configuration process.
  • Processing Stage:
    • An arrow points from the input section to the central purple block labeled “AI Agent,” which features a cute, smiling robot icon underneath it. This shows the prompt being fed into the AI system.
  • Output & Evaluation Stage:
    • The AI Agent’s output travels via an arrow to a green block on the right labeled “Agent response Summary & Analysis.”
    • This response is directly compared (indicated by a black “VS” badge) against a grey block labeled “Answer Sheet.”
    • Attached to the “VS” badge is a blue circle that reads “By Another Agent.” This signifies that the comparative evaluation between the AI’s response and the correct answer sheet is performed automatically by a secondary AI agent.
  • Scoring & Feedback Stage:
    • The result of the comparison flows down into a large, burgundy circle labeled “SCORE.”
    • At the bottom left, there is a light blue circle labeled “Tuning Prompt.” A dashed purple arrow connects this circle directly to the “SCORE” circle, accompanied by the text “To get more .” This illustrates a feedback loop where prompts are iteratively tuned and improved to achieve better evaluation scores.
  • Additional Details:
    • In the top right corner, there is a small box containing a URL ([http://eeumee.net](http://eeumee.net)) and an email address (lechuck.park@gmail.com), likely indicating the creator or source of the diagram.

📝 Summary

This diagram illustrates the lifecycle of an automated LLM evaluation system. It shows how a prompt is processed by a primary AI agent, how the resulting response is evaluated against a golden answer sheet by a secondary AI agent to generate a score, and how that score drives the continuous tuning of the original prompt for better performance.This diagram illustrates the lifecycle of an automated LLM evaluation system. It shows how a prompt is processed by a primary AI agent, how the resulting response is evaluated against a golden answer sheet by a secondary AI agent to generate a score, and how that score drives the continuous tuning of the original prompt for better performance.

#LLM #AIAgent #PromptEngineering #LLMEvaluation #ArtificialIntelligence #PromptTuning #AIWorkflow

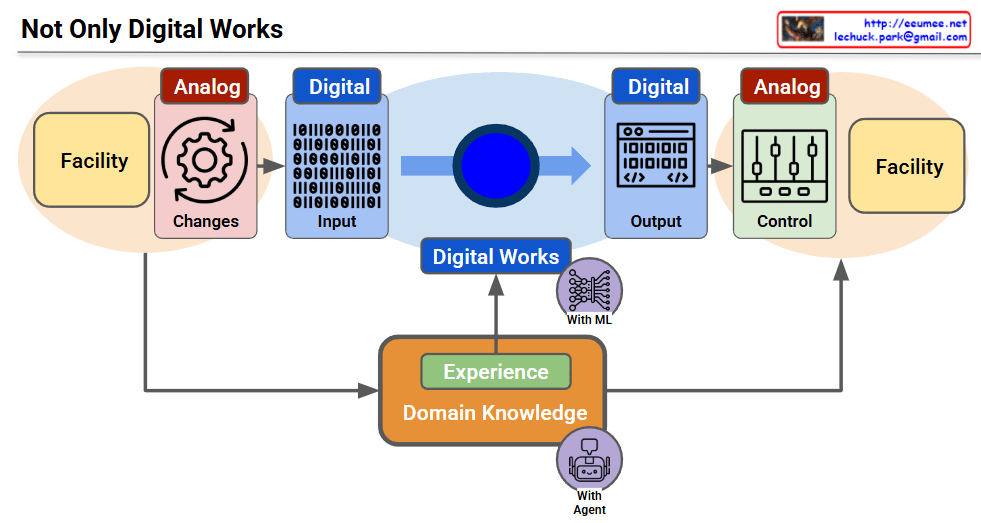
Not Only Digital Works

This diagram, titled “Not Only Digital Works,” illustrates how the physical analog world and the digital realm interact to form a complete closed-loop architecture.

The overall flow of the image is as follows:

  • Phase 1: Analog to Digital (Data Collection) The system detects analog Changes occurring in the physical Facility on the left. These analog signals are then converted into binary digital Input data (represented by 0s and 1s) and transmitted to the central system.
  • Phase 2: Digital Computation Powered by Domain Knowledge (Core Processing) The transmitted data is processed in the central Digital Works area. This is where the core philosophy of the diagram is revealed. Rather than relying solely on raw data computation, the system actively integrates field Experience and Domain Knowledge from the bottom section. This expertise is combined with Machine Learning (With ML) technologies to elevate simple calculations into intelligent analysis.
  • Phase 3: Digital to Analog (Intelligent Control) Once the analysis is complete, a digital Output is generated. This data is translated back into analog Control signals to operate the actual physical Facility on the right. During this step, an AI Agent (With Agent)—empowered by the embedded domain knowledge—steps in to execute precise, autonomous control over the physical infrastructure.

📝 Summary

The diagram showcases the architecture of a Cyber-Physical System (CPS) where facility statuses are converted into digital data, processed, and cycled back as control signals. The core message it emphasizes is that “true intelligent automation is not achieved merely through software computation (Digital Works), but is only realized when deep field ‘Experience’ and ‘Domain Knowledge’ are seamlessly integrated with Machine Learning and AI Agents.”The diagram showcases the architecture of a Cyber-Physical System (CPS) where facility statuses are converted into digital data, processed, and cycled back as control signals. The core message it emphasizes is that “true intelligent automation is not achieved merely through software computation (Digital Works), but is only realized when deep field ‘Experience’ and ‘Domain Knowledge’ are seamlessly integrated with Machine Learning and AI Agents.”

#NotOnlyDigitalWorks #CyberPhysicalSystems #DigitalTransformation #DomainKnowledge #MachineLearning #AIAgent #InfrastructureAutomation #SmartFacility

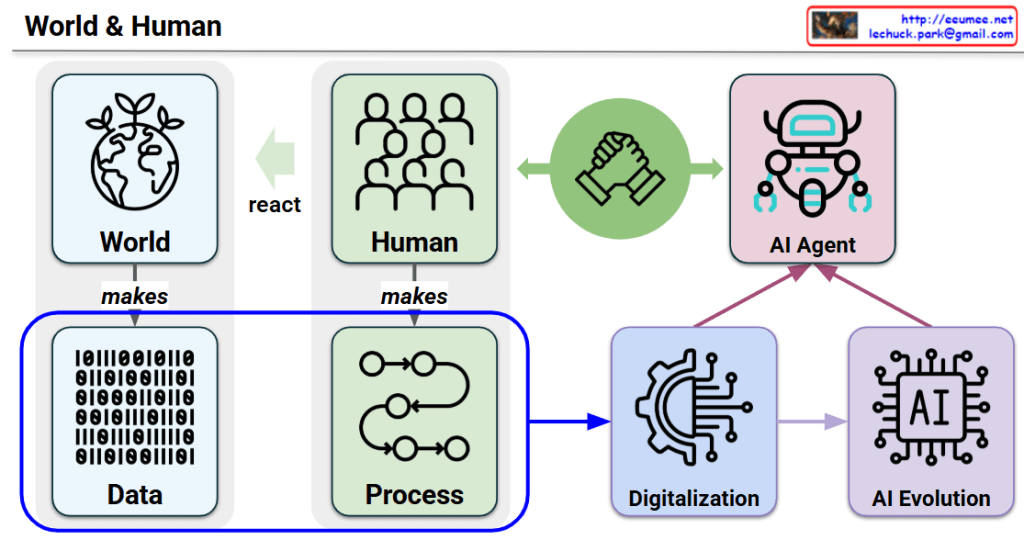
World & Human, and AI

Architectural Breakdown: World & Human

This diagram illustrates how the interactions between the world and humanity generate the fundamental assets (Data and Processes) that drive digitalization, leading to the evolution of AI and the ultimate realization of a collaborative AI Agent.

1. The Core Loop: World & Human

  • World -> Data (makes): The physical world continuously generates vast amounts of raw Data, symbolized by the binary code (0 and 1).
  • Human -> Process (makes): Human society organizes actions, workflows, and logic to create structured Processes.
  • Human -> World (react): Humans constantly observe, adapt, and react to the changing environment of the world, completing the foundational feedback loop.

2. The Engine of Value: Digitalization & AI Evolution

  • Digitalization: When the accumulated Data and structured Processes (enclosed in the blue boundary) are integrated, they undergo Digitalization, transforming manual workflows into automated, systemic operations.
  • AI Evolution: Digitalized systems provide the infrastructure and training ground for AI Evolution, moving from simple automation to advanced, self-learning AI architectures.

3. The Ultimate Goal: Human-AI Collaboration

  • AI Agent: The convergence of digitalization and AI evolution culminates in the creation of an autonomous AI Agent.
  • The Handshake (Partnership): The green bidirectional arrow and the handshake icon at the center emphasize that the ultimate destination of this evolution is not total automation or human replacement, but a symbiotic human-AI partnership where both entities collaborate seamlessly.

#AIAgent #DigitalTransformation #Digitalization #AIConversations #HumanAIPartnership #DataArchitecture #TechVisualization #AIEvolution #FutureOfWork #TechInfographics

With Gemini

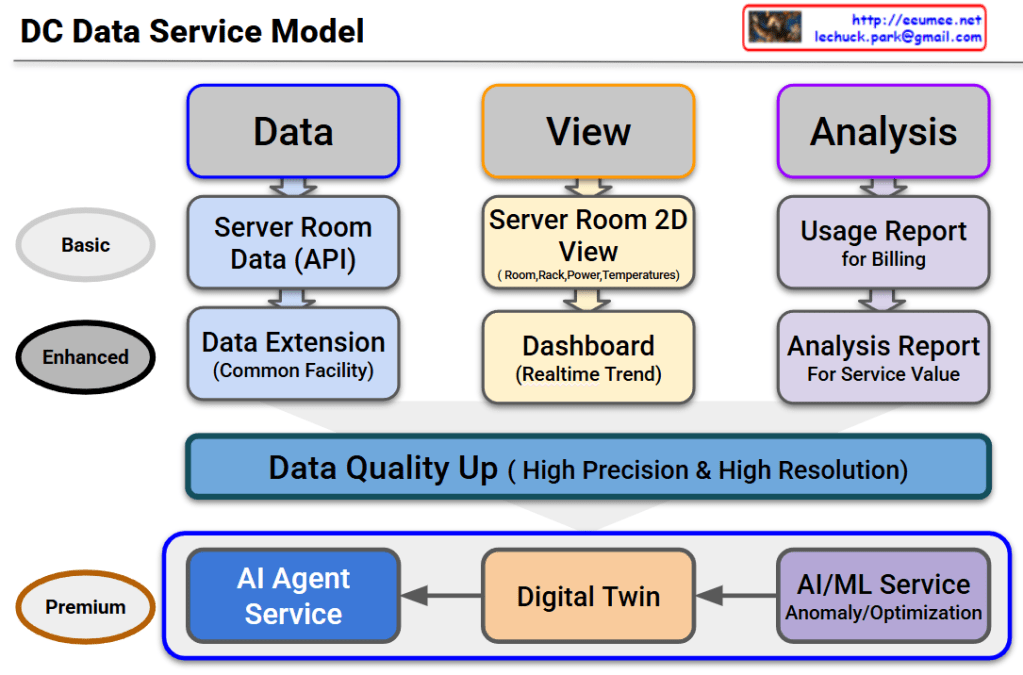
DC Data Service Model


DC Data Service Model Overview

This diagram outlines the evolutionary roadmap of a Data Center (DC) Data Service Model. It illustrates how data center operations advance from basic monitoring to a highly autonomous, AI-driven environment. The model is structured across three functional pillars—Data, View, and Analysis—and progresses through three key service tiers.

Here is a breakdown of the evolving stages:

1. Basic Tier (The Foundation)

This is the foundational level, focusing on essential monitoring and billing.

  • Data: It begins with collecting Server Room Data via APIs.
  • View: Operators use a Server Room 2D View to track basic statuses like room layouts, rack placement, power consumption, and temperatures.
  • Analysis: The collected data is used to generate a basic Usage Report, primarily for customer billing.

2. Enhanced Tier (Real-time & Expanded Scope)

This tier broadens the monitoring scope and provides deeper operational insights.

  • Data: Data collection is expanded beyond the server room to include the Common Facility (Data Extension).
  • View: The user interface upgrades to a dynamic Dashboard that displays real-time operational trends.
  • Analysis: Reporting evolves into an Analysis Report, designed to extract deeper insights and improve overall service value.

3. The Bridge: Data Quality Up

Before transitioning to the ultimate AI-driven tier, there is a critical prerequisite layer. To effectively utilize AI, the system must secure data of High Precision & High Resolution. High-quality data is the fuel for the advanced services that follow.

4. Premium Tier (AI Agent as the Ultimate Orchestrator)

This is the ultimate goal of the model. The updated diagram highlights a clear, sequential flow where each advanced technology builds upon the last, culminating in a comprehensive AI Agent Service:

  • AI/ML Service: The high-quality data is first processed here to automatically detect anomalies and calculate optimizations (e.g., maximizing cooling and power efficiency).
  • Digital Twin: The analytical insights from the AI/ML layer are then integrated into a Digital Twin—a virtual, highly accurate replica of the physical data center used for real-time simulation and spatial monitoring.
  • AI Agent Service: This is the final and most critical layer. The AI Agent does not just sit alongside the other tools; it acts as the central brain. Through this final Agent Service, the capabilities of all preceding services are expanded and put into action. By leveraging the predictive power of the AI/ML models and the comprehensive visibility of the Digital Twin, the AI Agent can autonomously manage, resolve issues, and optimize the data center, maximizing the ultimate value of the entire data pipeline.

#DataCenter #DCIM #AIAgent #DigitalTwin #MachineLearning #ITOperations #TechInfrastructure #FutureOfTech #SmartDataCenter

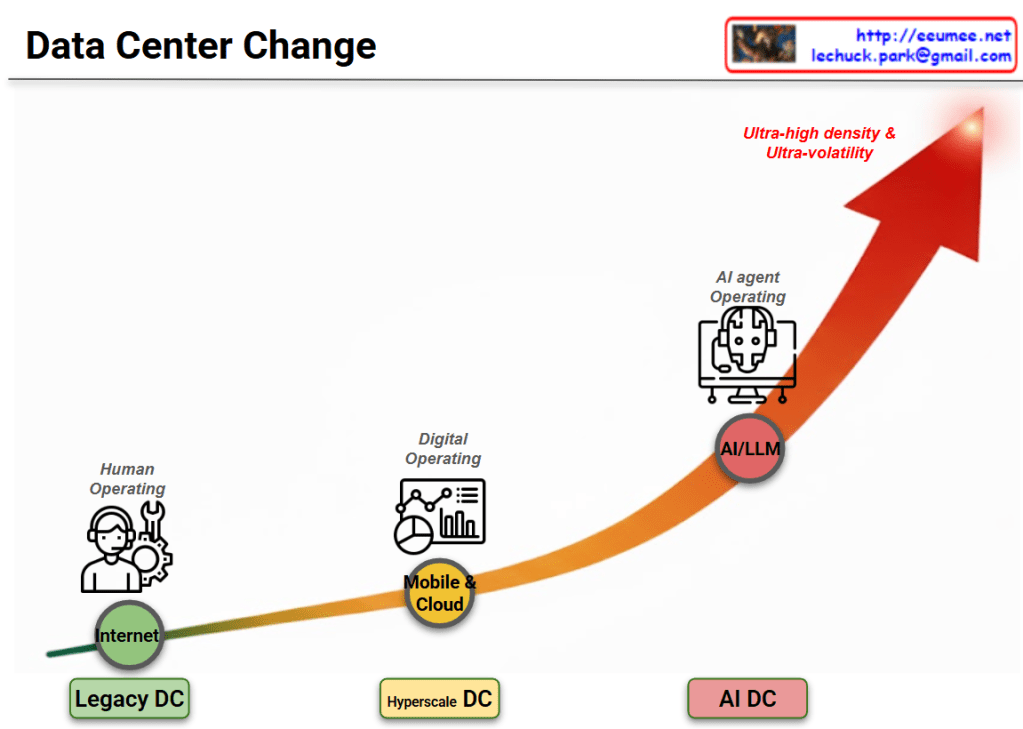
DC Changes

Image Analysis: The Evolution of Infrastructure

This diagram illustrates the evolutionary progression of infrastructure environments and operational methodologies over time. The upward-pointing arrow indicates the escalating complexity, density, and sophistication of these technologies.

  • Phase 1: Internet Era
    • Environment: Legacy Data Center
    • Core Technology: Internet
    • Operating Model: Human Operating
    • Characteristics: The foundational stage where human operators physically monitor and control the infrastructure, relying heavily on manual intervention and traditional toolsets.
  • Phase 2: Mobile & Cloud Era
    • Environment: Hyperscale Data Center
    • Core Technology: Mobile & Cloud
    • Operating Model: Digital Operating
    • Characteristics: A digital transformation phase designed to handle explosive data growth. This stage utilizes dashboards, analytics, and automated systems to significantly improve operational efficiency and scale.
  • Phase 3: Artificial Intelligence Era
    • Environment: AI Data Center
    • Core Technology: AI/LLM (Large Language Models)
    • Operating Model: AI Agent Operating
    • Characteristics: A highly advanced stage where an AI-driven agent takes over the integrated operations of the platform. It functions autonomously to manage and optimize the system, specifically to cope with the “Ultra-high density & Ultra-volatility” characteristic of modern AI workloads.

Summary

The diagram outlines a fundamental paradigm shift in infrastructure management. It traces the journey from early, manual-heavy environments to digitalized systems, ultimately culminating in an advanced era where an AI-driven agent autonomously manages operations for AI Data Centers, expertly handling environments defined by extreme density and volatility.

#DataCenter #AIAgent #LLM #Hyperscale #DigitalOperating #InfrastructureEvolution #UltraHighDensity #TechTrends


With Gemini