Co-Work

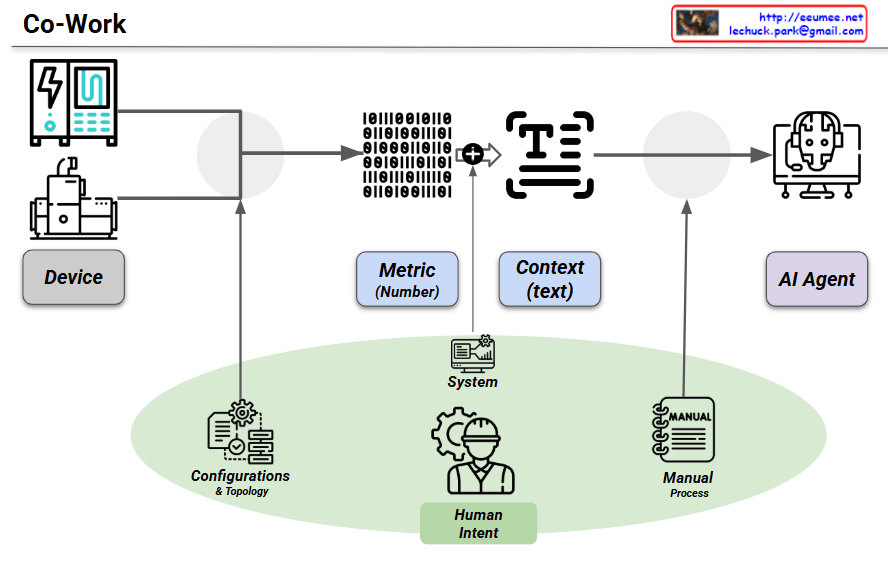
This image, titled “Co-Work,” illustrates a strategic framework for Event-Centric AIOps. It demonstrates how raw telemetry from physical infrastructure is transformed into structured, actionable intelligence for an AI Agent, fundamentally driven by human expertise.

1. Data Generation and Extraction

  • Device to Metric: Physical infrastructure (Device) generates raw operational data.
  • The Role of Configurations: This data is extracted into quantitative Metric (Number) formats. This extraction is guided by Configurations & Topology, which represents the structural configurations and network topology. This ensures the system understands the physical and logical layout of the devices.

2. Contextualization

  • Metric to Context: Raw numerical data lacks operational meaning on its own. It is transformed into readable Context (text), effectively converting raw telemetry into event logs suitable for LLM-based analysis.
  • The Role of System: This conversion is executed by the System, which acts as the Data Processing Operating System. It defines the rules and logic for how raw numbers are processed, correlated, and translated into meaningful operational states.

3. AI Agent Integration

  • Context to AI Agent: The structured, contextualized text is delivered to the AI Agent for analysis, root cause identification, or predictive tasks.
  • The Role of Manual: The AI Agent’s understanding is heavily enriched by the Manual, which encompasses text-based operating manuals, standard operating procedures (SOPs), and historical troubleshooting data. This provides the AI with established guidelines for how to interpret and react to specific scenarios.

4. The Foundation: Human Intent

The green foundational layer, Human Intent, is the most critical aspect of this architecture. Configurations, System, and Manual are the three core elements and systems that are actively built and managed by humans. They dictate the rules, structural layout, and historical knowledge that guide the AI. This ensures that the AI Agent does not operate in a vacuum, but rather functions safely and effectively within the strict boundaries of human operational intent.

Summary

The “Co-Work” architecture visualizes a collaborative AIOps framework where raw device metrics are systematically transformed into contextualized text. By leveraging three key human-managed components—Configurations (topology), Systems (data processing), and Manuals (historical/procedural text)—the architecture bridges the gap between physical hardware and AI. It ensures the AI Agent receives highly structured, context-rich event data to perform accurate and reliable infrastructure management.

#AIOps #EventCentricAIOps #AIDataCenter #HumanInTheLoop #Telemetry #LLM #ITOperations

Sensors for AI DC Rack

Architecture Walkthrough: High-Density AI Rack Monitoring Topology

This diagram illustrates a comprehensive monitoring framework tailored for next-generation, high-density AI Data Centers. As rack power densities scale upward of 40kW to over 100kW, the integration of high-density power delivery and advanced liquid cooling demands a unified telemetry layer. The architecture symmetrically bifurcates these critical operations into two primary domains: Power Distribution & Electrical Infrastructure (left, in yellow) and Liquid Cooling & Thermal Management (right, in blue).

1. Power Infrastructure Telemetry (Left Domain)

  • Busbar (Top Left): Focuses on tracking surface temperatures at copper/aluminum busway joints using contact or non-contact infrared (IR) sensors. This mitigates the risk of thermal runaway caused by mechanical loosening or joint degradation.
  • Tap-off Box (Middle Left): Monitors the critical junction where power is tapped from the main busway to individual racks. Telemetry captures internal ambient temperatures and circuit breaker contact wear to prevent nuisance tripping under heavy GPU loads.
  • Rack PDU (Bottom Left): Delivers granular power quality (PQ) analytics. Beyond basic billing metrics, it utilizes high-speed sampling to capture transient events—such as voltage sags, swells, and total harmonic distortion (THD)—triggered by sudden LLM training state transitions.

2. Liquid Cooling & Thermal Management (Right Domain)

  • Cold Aisle / Rear (Top Right): Provides 3D micro-climate profiling of the rack enclosure. Using sensor grids (top, middle, bottom), it tracks cold air intake and maps exhaust air behavior to instantaneously flag localized hot spots or individual server fan failures.
  • QD (Quick Disconnect) Valve (Middle Right): Positions high-sensitivity leak detection ropes or optical fluid sensors directly at the fluid mating interfaces of individual GPU server blades. This safeguards expensive IT assets against coolant escape.
  • Manifold / CDU (Bottom Right): Serves as the central hydronic balancing hub. By cross-referencing volumetric flow rate (LPM), differential pressure (Delta P), and differential temperature ($\Delta T$) across supply and return lines, the system continuously calculates the exact real-time heat rejection load in kW.

Executive Summary: The Imperative of High-Fidelity Infrastructure Telemetry

In a modern AI Data Center, the sheer density of accelerated computing clusters renders traditional, coarse facility monitoring completely obsolete. To ensure maximum uptime and operational efficiency, telemetry must undergo a paradigm shift governed by two critical vectors:

1. High Precision & High Resolution

Because GPU workloads scale from idle to maximum power in microseconds, sensors must feature ultra-high sampling rates (millisecond-level resolution for electrical transients) and high precision (milli-degree sensitivity for liquid thermal loops). Coarse, averaged data masks dangerous micro-spikes that degrade hardware components over time. High-resolution telemetry is the baseline requirement for capturing the true, unvarnished physical state of the infrastructure.

2. From Phenomena to Precursors (Omens)

Traditional data center monitoring is reactive—it alerts operators to a phenomenon (e.g., “Rack temperature has exceeded $85^\circ\text{C}$”), which usually means the failure has already occurred.

Conversely, high-fidelity, continuous data allows an AIOps engine to identify precursors or omens—the microscopic anomalies that precede a disaster. For instance:

  • A fractional, steady rise in busbar temperature relative to a static workload implies micro-vibration joint loosening (Thermal Degradation Precursor).
  • A subtle drift in the dielectric constant near a fluid coupling signals a microscopic weep before it transforms into a catastrophic spray (Leak Precursor).
  • A minor, localized spike in differential pressure (Delta P) combined with a micro-drop in flow rate alerts the system to initial strainer clogging before fluid starvation throttles the GPUs.

By capturing these subtle “signs” rather than waiting for the “symptom,” data centers can transition from reactive firefighting to fully automated, self-healing predictive maintenance.

#AIDataCenter #LiquidCooling #DirectToChip #AIOps #InfrastructureTelemetry #HighDensityComputing #PredictiveMaintenance #DataCenterArchitecture #TechnicalVisualization #SmartInfrastructure

With Gemini

PI-DLinear(Physics-Informed DLinear)


PI-DLinear (Physics-Informed DLinear)

The provided image is a structured infographic slide titled “PI-DLinear (Physics-Informed DLinear).” It visually organizes the model’s core features into four distinct, color-coded columns:

1. Physics-Informed Loss Function (Blue Column)

This section focuses on how physical laws are integrated into the model’s learning process.

  • #Hybrid Objective: It explains that the model integrates data fidelity with physical governing equations.
  • #Physical Constraints: It states that the model penalizes thermodynamically impossible predictions (e.g., violating energy conservation or heat transfer laws).
  • #Mathematical Formulation: It provides the core equation for the loss function: Ltotal = Ldata + Lphysic.

2. Harness Engineering & Safe Control (Purple Column)

This column emphasizes the safety and control aspects for AI operations.

  • #Operational Scaffolding: It describes the model as acting as a strict guardrail for autonomous AI-driven agents.
  • #Boundary Adherence: It guarantees that forecasts and control actions remain within safe, predefined physical boundaries, completely preventing critical hallucinations.

3. Robust OOD (Out-of-Distribution) Extrapolation (Green Column)

This section highlights the model’s reliability during unexpected scenarios.

  • #Anomaly Resilience: It notes that the model maintains highly rational trajectories during unprecedented emergencies (like sudden chiller failures) where pure data-driven models would collapse.
  • #Predictive Diagnostics: It points out that the model delivers accurate fault propagation forecasting, which directly enables a drastic reduction in MTTR (Mean Time To Repair).

4. Structural Simplicity & Computational Efficiency (Red Column)

The final column outlines the architectural benefits of the model.

  • #Linear Decomposition: It explains that the model splits time-series into trend and remainder components using highly interpretable linear layers, bypassing heavy attention mechanisms.
  • #High-Throughput Inference: It emphasizes that the model is exceptionally lightweight and fast, making it optimal for real-time DevOps, edge deployments, and multi-center scaling.

Summary

The infographic effectively presents PI-DLinear as a powerful hybrid model for time-series forecasting. By combining the computational speed and simplicity of linear architectures with the strict mathematical boundaries of physical laws, it creates a highly reliable AI tool. It is specifically designed to handle unexpected anomalies safely and efficiently, making it ideal for critical infrastructure management where AI hallucinations cannot be tolerated.

#PIDLinear #PhysicsInformedAI #TimeSeriesForecasting #AIOps #MachineLearning #SafeAI #PredictiveMaintenance #HarnessEngineering

With Gemini

AI Agent : Bring Up


Visualizing the Evolution of an AI Agent: The “Bring UP” Process

This infographic, titled “AI Agent : Bring UP,” effectively illustrates the evolutionary journey of an Artificial Intelligence from a raw, untrained model to a fully functional, real-world agent. It uses a powerful “nurturing” metaphor to emphasize that building a reliable AI is not a plug-and-play event, but a continuous process of guidance.

Here is the step-by-step breakdown of the AI’s journey:

1. The Starting Point: Probabilistic & Unaligned

  • Visual: The basic, blank-faced robot on the far left.
  • Meaning: This represents the raw AI (such as a base LLM). At this initial stage, the AI is merely a probabilistic engine. It predicts outputs based on statistical likelihoods but fundamentally lacks an understanding of the user’s true intent, operational goals, or constraints. It is a powerful tool, but it is “unaligned.”

2. The Critical Phase: Feedback-Driven Nurturing

  • Visual: The central nexus featuring a parent holding a child, flanked by documents (data) and social interaction icons (likes/comments).
  • Meaning: This is the most crucial step—the “Human-in-the-Loop” process. The parent-child icon symbolizes that an AI must be nurtured. To bridge the gap between a raw model and a useful agent, it requires the injection of specific contextual data (documents) and continuous, iterative human feedback (represented by the interaction icons).

3. The Final Goal: Contextual Adaptation

  • Visual: The advanced, confident robot standing in front of a globe on the right.
  • Meaning: Having successfully passed through the nurturing phase, the AI is no longer just a text generator. It has adapted to complex, real-world contexts (the globe). It is now an aligned, goal-oriented “Agent” capable of understanding its environment and executing tasks accurately.

💡 The Key Takeaway

The most important message is captured in the footer: “AI doesn’t come perfect.”

Many people expect out-of-the-box perfection from AI, but this diagram clearly debunks that myth. To unlock an AI’s true execution capabilities, you cannot skip the middle step. It mandates a step-by-step nurturing process to align the technology with your specific objectives. Perfection is not the starting point; it is the result of continuous guidance.


#AIAgents #ArtificialIntelligence #AIAlignment #HumanInTheLoop #MachineLearning #TechVisualization #AIOps #LLM #TechLeadership #Innovation

With Gemini

Road to the Automation

Diagram Description: The Paradigm Shift to Autonomous Operations

This infographic, titled “Road to the Automation,” visually explains the evolution from traditional, rule-based automation to a highly reliable, data-driven autonomous architecture.

  • The Traditional Approach (Top Flow):The upper section outlines the conventional path of automation. It transitions from a general “Automation” state to a “Programmatic” structure, ultimately relying on a standard, predefined logic: “If (Analysis) Then (Action).” This represents a system that reacts based on statically programmed rules.
  • The Start of True Automation (Bottom Flow):The core philosophy of the diagram lies in the lower, shaded area labeled “The Start of the Automation.” It asserts that true autonomous operation does not start with logic, but with “Data.”
    • The Quality Gate: The raw data must meet a strict standard of “High-Fidelity Data Quality,” which is defined by a comprehensive, four-pillar framework: Higher Accuracy, Higher Precision, Higher Resolution, and Higher Completeness.
    • Generating Systemic Trust: As the high-fidelity data feeds into the “If (Analysis)” phase, it concurrently establishes “Near 100% Confidence.”
    • Triggering Safe Action: This near-perfect confidence level is the critical catalyst. It provides the necessary systemic trust to safely execute the “then (Action).” This implies that a system can only act autonomously and safely when the underlying data quality eliminates uncertainty.
  • The Continuous Loop:Finally, an arrow points from the bottom automated framework back to the initial “Automation” block, illustrating a feedback loop. It shows that high-quality, confidence-backed autonomous actions are what continuously elevate and refine the entire automation ecosystem.

#AIOps #DataQuality #AutonomousSystems #InfrastructureAutomation #HighFidelityData #DataDriven #TechVisualization

Fault Detection and Recovery: Data Pipeline


Fault Detection and Recovery: Data Pipeline

This architecture illustrates an advanced, six-stage, end-to-end data pipeline designed for an AI-driven infrastructure agent. It demonstrates how raw telemetry is systematically transformed into actionable, automated remediation through two primary phases.

Phase 1: Contextualization & Summary

This phase is dedicated to building a high-resolution, stateful understanding of the infrastructure. It takes raw alerts and layers them with critical physical and logical context.

  • Level 0: Event Log (Generated By Metrics with Meta)The foundation of the pipeline. High-precision logs and telemetry are ingested from DCIM/BMS systems. Crucially, this stage performs chattering filtering and noise reduction to isolate genuine anomalies from meaningless alerts.
  • Level 1: Configuration Augmentation (Static Metadata Mapping)Raw events are enriched by integrating with the CMDB. By mapping static metadata to the alerts, the system performs precise asset identification, tagging, and labeling to know exactly which component is affected.
  • Level 2: Connection Configuration Augmentation (Impact Scope & Topology)The pipeline maps the isolated asset against physical and logical topologies (such as Single Line Diagrams and P&IDs). This enables the system to track dependencies and accurately calculate the blast radius or impact scope of a fault.
  • Level 3: STATEFUL Management (Maintaining State Continuity)Moving beyond isolated, point-in-time alerts, this level links current events with historical context and event flows. It ensures data integrity and maintains a continuous, stateful tracking of the system’s health.

Phase 2: Resolution & Feedback

With a fully contextualized baseline established, the pipeline shifts from situational awareness to intelligent diagnosis and automated remediation.

  • Level 4: RCA Analysis (Deep Root Cause Extraction)During an event storm, the system performs advanced correlation analysis and historical trouble-ticket matching. It sifts through the cascading symptoms to pinpoint the deep root cause (RCA) of the failure.
  • Level 5: Action Provision (Guide & Feedback)In the final stage, the platform leverages RAG (Retrieval-Augmented Generation) to instantly surface the most relevant Emergency Operating Procedures (EOP). By incorporating a Human-in-the-loop (HITL) feedback mechanism, expert operators validate the actions, allowing the AI model to continuously undergo autonomous learning and refine its future responses.

Summary

This data pipeline elegantly maps the journey from raw infrastructure noise to intelligent, automated resolution. By progressively layering static configuration data, topology mapping, and stateful tracking over high-precision logs, the architecture effectively neutralizes event storms. Ultimately, it empowers AI-driven agents to deliver highly accurate root cause analyses and RAG-assisted operational guides, creating a resilient system that continuously learns and improves through expert human feedback.

#AIOps #DataCenterArchitecture #RootCauseAnalysis #SystemObservability #RAG #FaultDetection #Telemetry #HumanInTheLoop #InfrastructureAutomation #TechInfographic

With Gemini

Data for DC

1. The Three Core Data Types (Top Section)

At the top, the diagram maps out the primary real-time and structural data inputs flowing from the infrastructure:

  • Meta: This represents the foundational metadata of the facility—the physical and logical configuration of equipment like generators, server racks, and liquid cooling units. It acts as the anchor point for the entire monitoring ecosystem.
  • Metric: Illustrated by the gauge, this is the continuous, time-series telemetry data. It includes critical real-time performance indicators, such as power loads, latency, or the return temperature from cooling units.
  • Event Log: The document icon on the right captures asynchronous system logs, alerts, and warnings (e.g., error thresholds being breached or state changes).

2. The Knowledge Base / RAG Corpus (Bottom Section)

The bottom half categorizes the facility’s documentation across its lifecycle. This perfectly outlines the corpus structure required to feed an AI’s Retrieval-Augmented Generation (RAG) system:

  • Install Stage (Static Knowledge): This is the baseline documentation established during construction and deployment. It includes Vendor Manuals, Technical Data Sheets, As-Built Drawings, CMDB, and Rack Elevations. Notice the dotted arrow showing how this static knowledge directly informs and establishes the “Meta” data above.
  • Operation Stage (Dynamic Operational Guide): This represents the evolving, lived intelligence of the facility. It captures structured response frameworks (SOP, MOP, EOP) alongside historical operational data like Trouble Tickets, RCA (Root Cause Analysis), and Maintenance Logs.

3. The Operation Process (Center)

The purple “Operation Process” node acts as the cognitive center or the execution engine. Real-time anomalies detected via Metrics and Event Logs flow into this process. The system then queries the Dynamic Operational Guide to find the correct standard operating procedures or historical RCA to resolve the issue. The resulting action or insight is then fed back into the central monitoring and management system.


Summary

This diagram elegantly maps out the data architecture of a modern facility. It visualizes how static foundational knowledge and dynamic operational history combine to inform real-time monitoring and incident response. By categorizing data into Meta, Metric, Event Logs, and structural lifecycle knowledge, it provides a clear, actionable framework for implementing data-driven operations, high-resolution observability, and AI-assisted automation platforms.

#DataCenterArchitecture #AIOps #RAG #InfrastructureObservability #SystemTelemetry #RootCauseAnalysis #TechInfographic

With Gemini