Adaptive Congestion Control

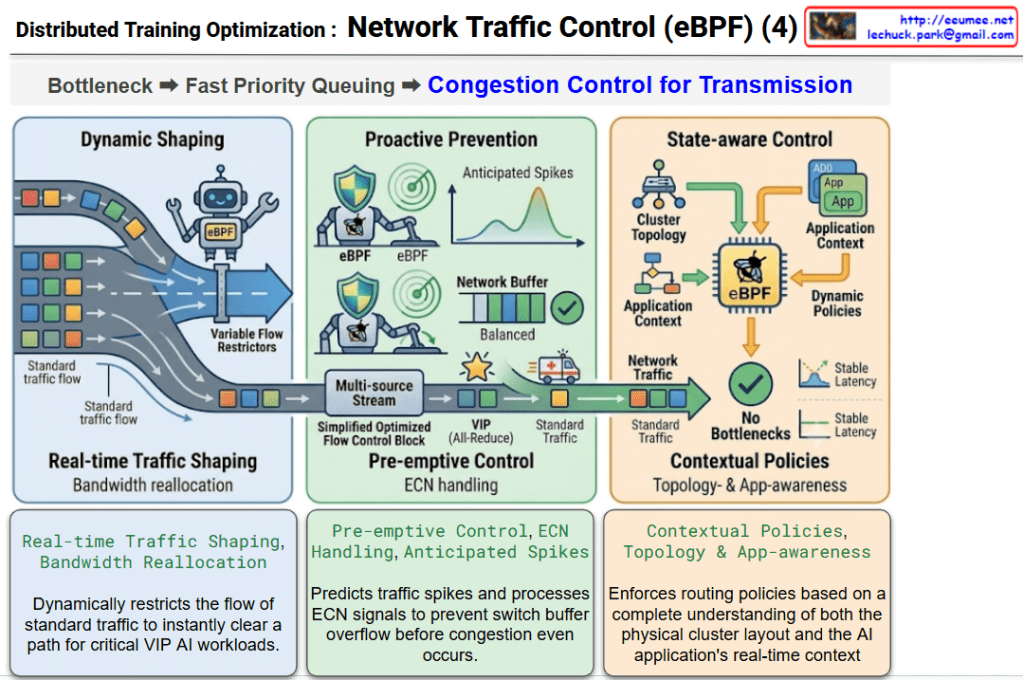
This infographic illustrates the three core mechanisms of “Adaptive Congestion Control,” showcasing how an eBPF-based controller goes beyond simple packet filtering to actively and intelligently manage network congestion in real-time.

1. Dynamic Shaping (Left Panel / Blue)

  • Keywords: Real-time Traffic Shaping, Bandwidth Reallocation
  • Description: Depicts an eBPF robot operating “Variable Flow Restrictors.” It performs real-time traffic shaping by dynamically adjusting the bandwidth allocated to standard traffic flows. It effectively narrows the path for regular packets to make room when critical VIP traffic needs to pass through.

2. Proactive Prevention (Center Panel / Green)

  • Keywords: Pre-emptive Control, ECN Handling, Anticipated Spikes
  • Description: Shows eBPF robots equipped with shields and radars, indicating the ability to foresee “Anticipated Spikes” in traffic. It handles ECN (Explicit Congestion Notification) to pre-emptively control flow and maintain balanced network buffers before overflow occurs. The bottom section visualizes VIP (All-Reduce) traffic bypassing standard traffic smoothly, akin to an ambulance clearing a traffic jam.

3. State-aware Control (Right Panel / Orange)

  • Keywords: Contextual Policies, Topology & App-awareness
  • Description: Illustrates the eBPF chip receiving data from both the “Cluster Topology” and the “Application Context.” This means the controller doesn’t just look at packets blindly; it enforces Dynamic Policies based on a holistic understanding of the AI application’s state and hardware layout, ultimately resulting in “No Bottlenecks” and “Stable Latency.”

📝 Summary

This diagram clearly visualizes the complete mechanism of Adaptive Congestion Control, where the eBPF controller 1) dynamically shapes bandwidth in real-time, 2) proactively prevents congestion by anticipating spikes, and 3) acts with full topology and application awareness to ensure uninterrupted, optimized network performance for AI workloads.

#AdaptiveCongestionControl #DynamicShaping #ProactivePrevention #StateAwareControl #eBPF #ECN #TrafficShaping #AINetworkOptimization

With Gemini

eBPF Traffic Controller Core Technologies

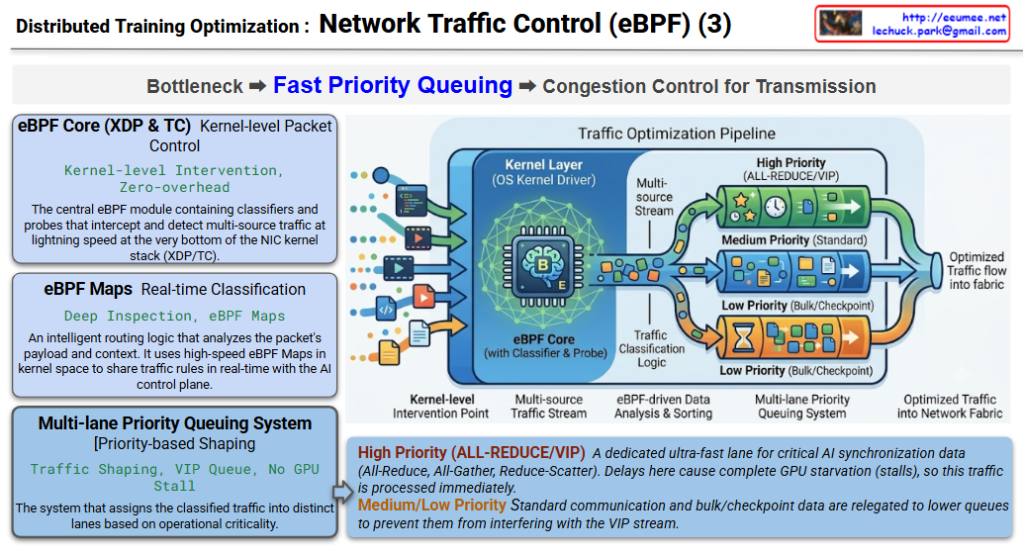
This section illustrates the control phase where mixed application traffic (Multi-source Stream) is intercepted at the lowest level of the OS, analyzed, and sorted into multiple lanes based on priority to ensure an optimized traffic flow into the network fabric.

  • eBPF Core (XDP & TC) [Kernel-level Packet Control]
    • Keywords: Kernel-level Intervention, Zero-overhead
    • Core: The central eBPF module containing classifiers and probes that intercept and detect multi-source traffic at lightning speed at the very bottom of the NIC kernel stack (XDP/TC).
  • Traffic Classification Logic (Powered by eBPF Maps) [Real-time Classification]
    • Keywords: Deep Inspection, eBPF Maps
    • Core: An intelligent routing logic that analyzes the packet’s payload and context. It uses high-speed eBPF Maps in kernel space to share traffic rules in real-time with the AI control plane.
  • Multi-lane Priority Queuing System [Priority-based Shaping]
    • Keywords: Traffic Shaping, VIP Queue, No GPU Stall
    • Core: The system that assigns the classified traffic into distinct lanes based on operational criticality.
      • High Priority (ALL-REDUCE/VIP): A dedicated ultra-fast lane for critical AI synchronization data (All-Reduce, All-Gather, Reduce-Scatter). Delays here cause complete GPU starvation (stalls), so this traffic is processed immediately.
      • Medium/Low Priority: Standard communication and bulk/checkpoint data are relegated to lower queues to prevent them from interfering with the VIP stream.

📝 Summary (Summary)

The eBPF Traffic Controller acts as an intelligent traffic cop inside the OS kernel. By identifying potential bottlenecks early and aggressively steering vital collective communication data (like All-Reduce) into Fast Priority Queues (VIP), it completely eliminates GPU starvation and ensures continuous, high-efficiency model training.

#eBPF #TrafficController #XDP_TC #PriorityQueuing #ZeroGPUStall #AllReduce #AllGather #NetworkOptimization

With Gemini

Distributed Training Optimization : Network Traffic Control (eBPF) – Bottleneck

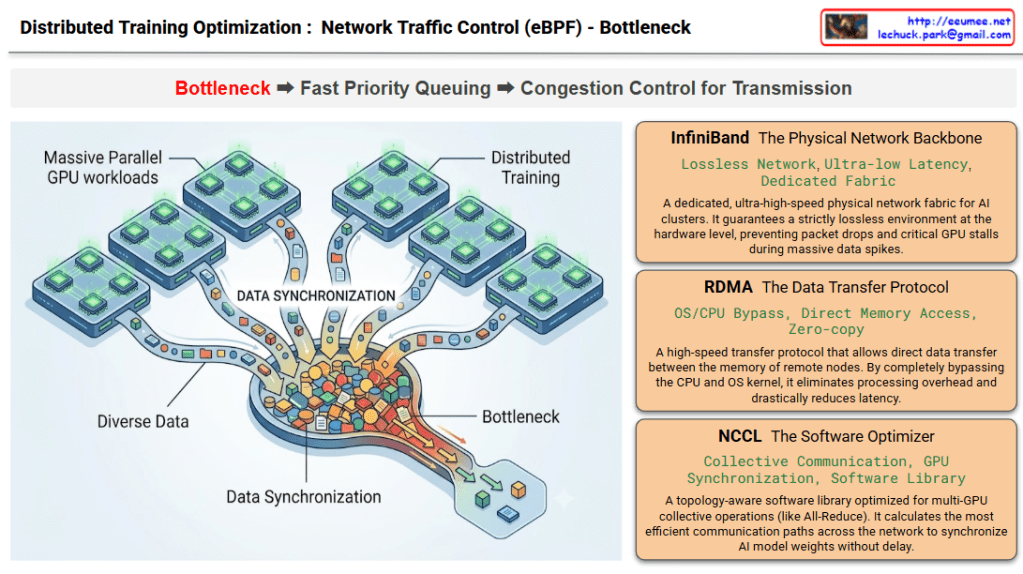
This infographic intuitively visualizes the “Bottleneck” phase—the very first step in network optimization for large-scale AI distributed training environments. It also outlines the three foundational infrastructure technologies involved in this process. As indicated by the red highlight on the word Bottleneck in the top workflow process, this specific diagram is entirely focused on defining the problem area.

1. Visual Context Description (Left Illustration)

  • The graphic on the left depicts a Massive Parallel GPU workloads environment, where numerous GPU clusters are operating simultaneously.
  • “Diverse Data” pouring out from each distinct GPU node converges into a massive, funnel-like channel labeled “DATA SYNCHRONIZATION.”
  • The illustration brilliantly captures a severe “Bottleneck” occurring as a massive volume of data packets (represented by the colorful blocks) attempts to squeeze through this narrow passage all at once, causing a massive traffic jam.

2. Core Infrastructure Technologies (Right Panels) The right side details the three core infrastructure stacks where this physical and logical data synchronization (and the resulting bottleneck) takes place.

  • InfiniBand (The Physical Network Backbone): A dedicated, ultra-high-speed physical network fabric for AI clusters. It guarantees a strictly lossless environment at the hardware level, preventing packet drops and critical GPU stalls during massive data spikes as seen on the left.
  • RDMA (The Data Transfer Protocol): A high-speed transfer protocol that allows direct data transfer between the memory of remote nodes. By completely bypassing the CPU and OS kernel, it eliminates processing overhead and drastically reduces latency.
  • NCCL (The Software Optimizer): A topology-aware software library optimized for multi-GPU collective operations (like All-Reduce). It calculates the most efficient communication paths across the network to synchronize AI model weights without delay.

📝 Summary

This diagram defines the problem state by using a funnel metaphor to visualize the inevitable network bottleneck that occurs when multiple GPUs synchronize data during distributed AI training. Simultaneously, it serves as an introductory technical overview, clearly outlining the keyword-centric roles of the underlying infrastructure stack—InfiniBand, RDMA, and NCCL—that handles this immense traffic.

#AIInfrastructure #DistributedTraining #NetworkBottleneck #DataCenter #InfiniBand #RDMA #NCCL #GPUCluster

With Gemini

Distributed Training Optimization : Network Traffic Control (eBPF)

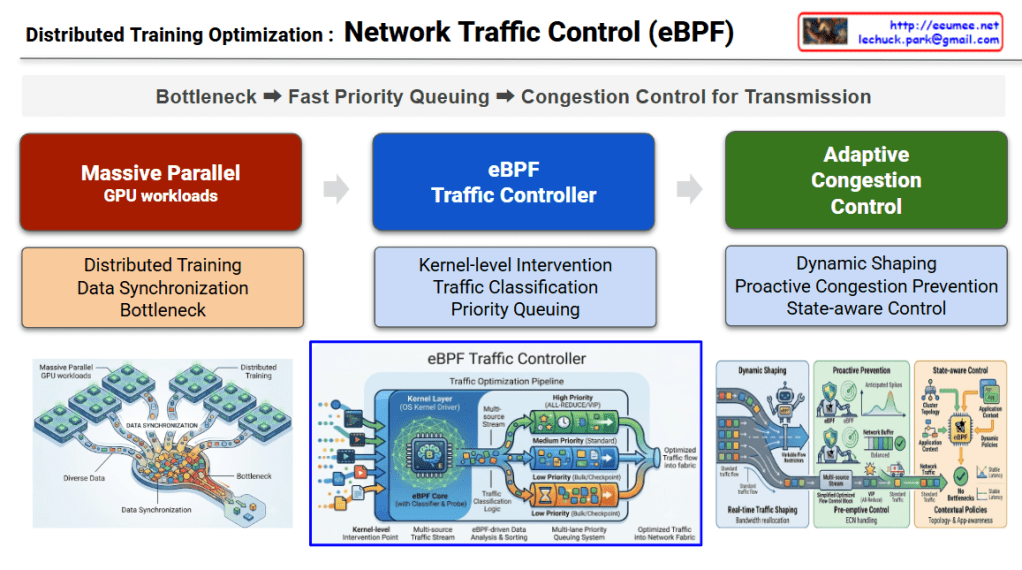
The diagram, titled “Distributed Training Optimization: Network Traffic Control,” outlines a core 3-stage optimization pipeline. It logically unfolds the process of identifying and solving the problem following the top flow path: Bottleneck ➡️ Fast Priority Queuing ➡️ Congestion Control for Transmission.

1. Massive Parallel GPU Workloads

  • Visual Description: The red section on the left and the illustration below it depict “Diverse Data” pouring out from multiple GPU cluster nodes and converging into a single, narrow bottleneck.
  • Core Meaning: It illustrates the Data Synchronization traffic that is essential during the Distributed Training of AI models. It structurally highlights the inevitable network bottleneck that occurs when countless GPUs attempt to exchange computational results simultaneously.

2. eBPF Traffic Controller

  • Visual Description: The central blue section introduces the core control engine designed to resolve the aforementioned bottleneck. The lower illustration shows complex traffic being neatly sorted into three pipes (priority lanes) at the OS Kernel Driver layer.
  • Core Meaning: It demonstrates Kernel-level Intervention, allowing access to network packets without massive overhead. Following the Traffic Classification logic, the system implements Priority Queuing: mission-critical traffic directly affecting training speed (like All-Reduce) is routed to the top ‘High Priority (VIP)’ queue, while standard storage traffic goes to the ‘Low Priority’ queue.

3. Adaptive Congestion Control

  • Visual Description: The green section on the right depicts the dynamic management of queued traffic as it is transmitted into the actual network fabric. The illustration shows eBPF agents adjusting valves in real-time (Dynamic Shaping), predicting and preventing network spikes (Proactive Prevention), and maintaining stable traffic flow based on the overall application context (State-aware Control).
  • Core Meaning: Beyond simple prioritization, it proactively monitors network switch buffer states and overall infrastructure congestion to flexibly adjust transmission rates. Ultimately, this creates a flawless, optimized data flow with zero latency.

📝 Summary

This diagram visualizes the complete pipeline for maximizing communication efficiency in AI data centers. To resolve the inevitable network bottlenecks caused by AI distributed training, it introduces an eBPF-based traffic controller operating at the lowest kernel level to prioritize traffic, and executes adaptive congestion control reflecting real-time network states to ensure seamless data transmission.

#AIDataCenter #eBPF #DistributedTraining #TrafficControl #InfrastructureEngineering #GPUCluster #AIOps #NetworkOptimization

With Gemini

Network Monitoring For Facilities

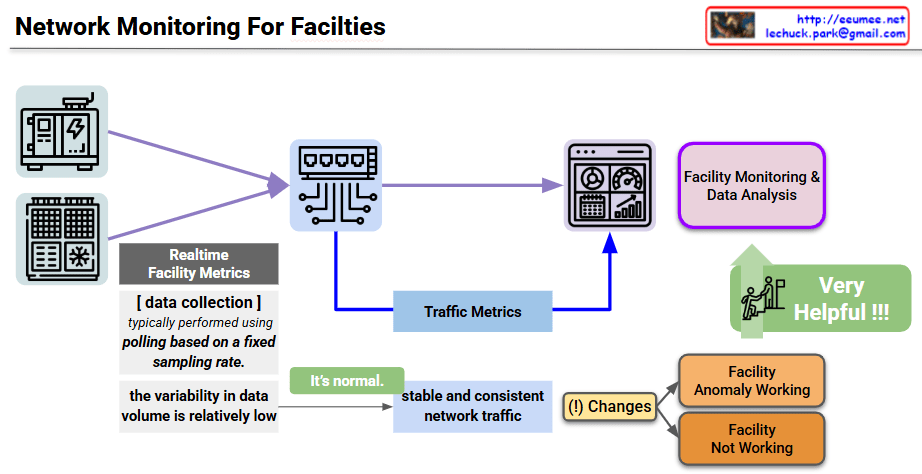
The provided image is a conceptual diagram illustrating how to monitor the status and detect anomalies in critical industrial facility infrastructure (such as power and cooling) through network traffic patterns. I also noticed the author’s information (Lechuck) in the top right corner! Let’s break down the main data flow and core ideas of your diagram step-by-step.

1. Realtime Facility Metrics

  • Target: Physical facility equipment such as generators (power infrastructure) and HVAC/cooling units.
  • Collection Method: A central monitoring server primarily uses a Polling method, requesting and receiving status data from the equipment based on a fixed sampling rate.
  • Characteristics: Because a specific amount of data is exchanged at designated times, the variability in data volume during normal operation is relatively low.

2. Traffic Metrics (Inferring Status via Traffic Characteristics)

This section contains the core insight of the diagram. Beyond just analyzing the payload of the collected sensor data, the pattern of the network traffic itself is utilized as an indicator of the facility’s health.

  • Normal State (It’s normal): When the equipment is operating normally, the network traffic occurs in a very stable and consistent manner in sync with the polling cycle.
  • Detecting Traffic Changes ((!) Changes): If a change occurs in this expected stable traffic pattern (e.g., traffic spikes, response delays, or disconnections), it is flagged as an anomaly in the facility.
  • Status Classification: Based on these abnormal traffic patterns, the system can infer whether the equipment is operating abnormally (Facility Anomaly Working) or has completely stopped functioning (Facility Not Working).

3. Facility Monitoring & Data Analysis

  • This architecture combines standard dashboard monitoring with Traffic Metrics extracted from network switches, feeding them into the data analysis system.
  • This cross-validation approach is highly effective for distinguishing between actual sensor data errors and network segment failures. As highlighted in the diagram, this ultimately improves the overall reliability of the facility monitoring system (Very Helpful !!!).

💡 Summary

This architecture presents a highly intuitive and efficient approach to data center and facility operations. By leveraging the network engineering characteristic that facility equipment communicates in regular patterns, it demonstrates an excellent monitoring logic. It allows operators to perform initial fault detection almost immediately simply by observing “changes in the consistency of network traffic,” even before conducting complex sensor data analysis.

#NetworkMonitoring #DataCenterOperations #FacilityManagement #TrafficAnalysis #AnomalyDetection #NetworkEngineering #ITInfrastructure #AIOps #SmartFacilities

With Gemini

AI Data Center Operation Platform Layer

The provided image illustrates the architecture of an AI DataCenter Operation Platform, mapping it out in five distinct stages from the physical foundation layer up to the top-tier artificial intelligence application layer.

The upward-pointing arrows depict the flow of raw data collected from the infrastructure, demonstrating the system’s upward evolution and how the data is ultimately utilized intelligently by AI.

Here is the breakdown of the core roles and components of each layer:

  • Layer 1: Facility & Physical Edge
    • Role: The foundational layer responsible for collecting data and controlling the physical infrastructure equipment of the data center, such as power and cooling systems.
    • Key Elements: High-Frequency Data Sampling, Precision Time Synchronization (Precision NTP/PTP), Standard Interfaces, and Zero-Latency Control & Redundancy. This layer focuses on extracting data and issuing control commands to hardware with extreme speed and accuracy.
  • Layer 2: Network Fabric
    • Role: The neural network of the data center. It reliably and rapidly transmits the massive amounts of collected data to the upper platforms without bottlenecks.
    • Key Elements: Non-blocking Leaf-Spine Architecture, Ultra-High-Speed Telemetry, and Integrated Security & NMS (Network Management System) Monitoring. These elements work together to efficiently handle large-scale traffic.
  • Layer 3: Control & Management (Integrated Control)
    • Role: The layer that integrates and normalizes heterogeneous data streaming in from various facilities and solutions to execute practical operations and management.
    • Key Elements: Operational Solution Convergence, Heterogeneous Data Normalization, Traffic-based Anomaly Detection, and Monitoring-Based Commissioning (MBCx). It acts as a critical gateway to identify infrastructure issues early and improve overall operational efficiency.
  • Layer 4: Analysis Platform
    • Role: The stage where refined data is stored, analyzed, and visualized, allowing administrators to intuitively grasp the system’s status at a glance.
    • Key Elements: Utilizes a High-Performance Time-Series Database (TSDB) to record state changes over time and provides Customized Views/Dashboards for tailored monitoring.
  • Layer 5: Intelligent Expansion
    • Role: The ultimate destination of this platform. It is the highest layer where AI autonomously operates and optimizes the data center, leveraging the well-organized data provided by the lower layers.
    • Key Elements: Generative AI Agent (LLM+RAG), Digital Twin technology, ML-based Automated Power/Cooling Control, and Intelligent Report Generation.

This blueprint clearly demonstrates the overall solution architecture: precisely collecting and transmitting raw data from hardware facilities (Layers 1-2), standardizing, storing, and analyzing that data (Layers 3-4), and ultimately achieving advanced, autonomous operations through intelligent, automatic control of power and cooling systems via a Generative AI Agent (Layer 5).


#AIDataCenter #AIOps #DataCenterManagement #GenerativeAI #DigitalTwin #NetworkFabric #ITInfrastructure #SmartDataCenter #MachineLearning #TechArchitecture

With Gemini