Data Center Changes

The Evolution of Data Centers

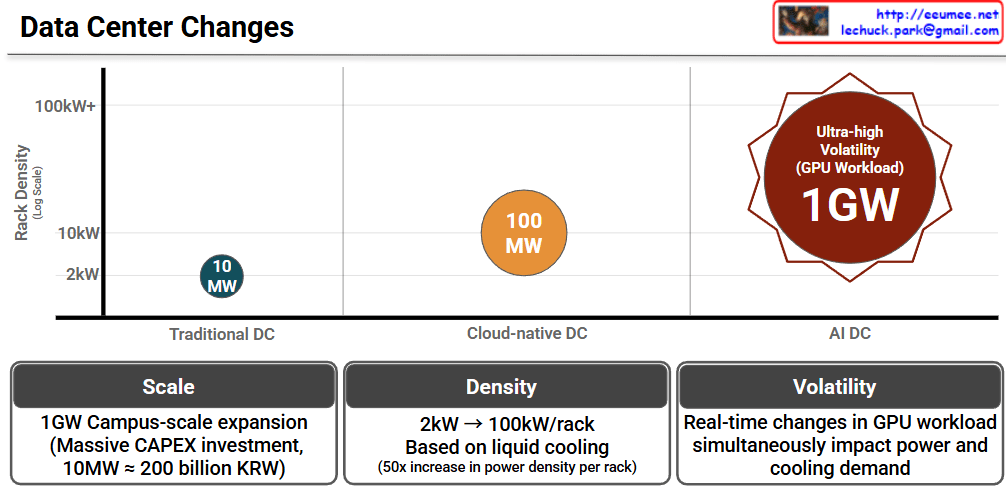
This infographic, titled “Data Center Changes,” visually explains how data center requirements are skyrocketing due to the shift from traditional computing to AI-driven workloads.

The chart compares three stages of data centers across two main metrics: Rack Density (how much power a single server rack consumes, shown on the vertical axis) and the overall Total Power Capacity (represented by the size and labels of the circles).

  • Traditional DC (Data Center): In the past, data centers ran at a very low rack density of around 2kW. The total power capacity required for a facility was relatively small, at around 10 MW.
  • Cloud-native DC: As cloud computing took over, the demands increased. Rack densities jumped to about 10kW, and the overall facility size grew to require around 100 MW of power.
  • AI DC: This is where we see a massive leap. Driven by heavy GPU workloads, AI data centers push rack densities beyond 100kW+. The scale of these facilities is enormous, demanding up to 1GW of power. The red starburst shape also highlights a new challenge: “Ultra-high Volatility,” meaning the power draw isn’t stable; it spikes violently depending on what the AI is processing.

The Three Core Challenges (Bottom Panels)

The bottom three panels summarize the key takeaways of transitioning to AI Data Centers:

  1. Scale (Massive Investment): Building a 1GW “Campus-scale” AI data center requires astronomical capital expenditure (CAPEX). To put this into perspective, the chart notes that just 10MW costs roughly 200 billion KRW (South Korean Won). Scaling that to 1GW is a colossal financial undertaking.
  2. Density (The Need for Liquid Cooling): Power density per rack is jumping from 2kW to 100kWโ€”a 50x increase. Traditional air-conditioning cannot cool servers running this hot, meaning the industry must transition to advanced liquid cooling technologies.
  3. Volatility (Unpredictable Demands): Unlike traditional servers that run at a steady hum, AI GPU workloads change in real-time. A sudden surge in computing tasks instantly spikes both the electricity needed to run the GPUs and the cooling power needed to keep them from melting.

Summary

  • Data centers are undergoing a massive transformation from Traditional (10MW) and Cloud (100MW) models to gigantic AI Data Centers requiring up to 1 Gigawatt (1GW) of power.
  • Because AI servers use powerful GPUs, power density per rack is increasing 50-fold (up to 100kW+), forcing a shift from traditional air cooling to advanced liquid cooling.
  • This AI infrastructure requires staggering financial investments (CAPEX) and must be designed to handle extreme, real-time volatility in both power and cooling demands.

#DataCenter #AIDataCenter #LiquidCooling #GPU #CloudComputing #TechTrends #TechInfrastructure #CAPEX

With Gemini

Peak Shaving with Data

Graph Interpretation: Power Peak Shaving in AI Data Centers

This graph illustrates the shift in power consumption patterns from traditional data centers to AI-driven data centers and the necessity of “Peak Shaving” strategies.

1. Standard DC (Green Line – Left)

  • Characteristics: Shows “Stable” power consumption.
  • Interpretation: Traditional server workloads are relatively predictable with low volatility. The power demand stays within a consistent range.

2. Training Job Spike (Purple Line – Middle)

  • Characteristics: Significant fluctuations labeled “Peak Shaving Area.”
  • Interpretation: During AI model training, power demand becomes highly volatile. The spikes (peaks) and valleys represent the intensive GPU cycles required during training phases.

3. AI DC & Massive Job Starting (Red Line – Right)

  • Characteristics: A sharp, vertical-like surge in power usage.
  • Interpretation: As massive AI jobs (LLM training, etc.) start, the power load skyrockets. The graph shows a “Pre-emptive Analysis & Preparation” phase where the system detects the surge before it hits the maximum threshold.

4. ESS Work & Peak Shaving (Purple Dotted Box – Top Right)

  • The Strategy: To handle the “Massive Job Starting,” the system utilizes ESS (Energy Storage Systems).
  • Action: Instead of drawing all power from the main grid (which could cause instability or high costs), the ESS discharges stored energy to “shave” the peak, smoothing out the demand and ensuring the AI DC operates safely.

Summary

  1. Volatility Shift: AI workloads (GPU-intensive) create much more extreme and unpredictable power spikes compared to standard data center operations.
  2. Proactive Management: Modern AI Data Centers require pre-emptive detection and analysis to prepare for sudden surges in energy demand.
  3. ESS Integration: Energy Storage Systems (ESS) are critical for “Peak Shaving,” providing the necessary power buffer to maintain grid stability and cost efficiency.

#DataCenter #AI #PeakShaving #EnergyStorage #ESS #GPU #PowerManagement #SmartGrid #TechInfrastructure #AIDC #EnergyEfficiency

with Gemini

AI Triangle


๐Ÿ“ The AI Triangle: Core Pillars of Evolution

1. Data: The Fuel for AI

Data serves as the essential raw material that determines the intelligence and accuracy of AI models.

  • Large-scale Datasets: Massive volumes of information required for foundational training.
  • High-quality/High-fidelity: The emphasis on clean, accurate, and reliable data to ensure superior model performance.
  • Data-centric AI: A paradigm shift focusing on enhancing data quality rather than just iterating on model code.

2. Algorithms: The Brain of AI

Algorithms provide the logical framework and mathematical structures that allow machines to learn from data.

  • Deep Learning (Neural Networks): Multi-layered architectures inspired by the human brain to process complex information.
  • Pattern Recognition: The ability to identify hidden correlations and make predictions from raw inputs.
  • Model Optimization: Techniques to improve efficiency, reduce latency, and minimize computational costs.

3. Infrastructure: The Backbone of AI

The physical and digital foundation that enables massive computations and ensures system stability.

  • Computing Resources (IT Infra):
    • HPC & Accelerators: High-performance clusters utilizing GPUs, NPUs, and HBM/PIM for parallel processing.
  • Physical Infrastructure (Facilities):
    • Power Delivery: Reliable, high-density power systems including UPS, PDU, and smart energy management.
    • Thermal Management: Advanced cooling solutions like Liquid Cooling and Immersion Cooling to handle extreme heat from AI chips.
    • Scalability & PUE: Focus on sustainable growth and maximizing energy efficiency (Power Usage Effectiveness).

๐Ÿ“ Summary

  1. The AI Triangle represents the vital synergy between high-quality Data, sophisticated Algorithms, and robust Infrastructure.
  2. While data fuels the model and algorithms provide the logic, infrastructure acts as the essential backbone that supports massive scaling and operational reliability.
  3. Modern AI evolution increasingly relies on advanced facility management, specifically optimized power delivery and high-efficiency cooling, to sustain next-generation workloads.

#AITriangle #AIInfrastructure #DataCenter #DeepLearning #GPU #LiquidCooling #DataCentric #Sustainability #PUE #TechArchitecture

With Gemini

AI Workload with Power/Cooling


Breakdown of the “AI Workload with Power/Cooling” Diagram

This diagram illustrates the flow of Power and Cooling changes throughout the execution stages of an AI workload. It divides the process into five phases, explaining how data center infrastructure (Power, Cooling) reacts and responds from the start to the completion of an AI job.

Here are the key details for each phase:

1. Pre-Run (Preparation Phase)

  • Work Job: Job Scheduling.
  • Key Metric: Requested TDP (Thermal Design Power). It identifies beforehand how much heat the job is expected to generate.
  • Power/Cooling: PreCooling. This is a proactive measure where cooling levels are increased based on the predicted TDP before the job actually starts and heat is generated.

2. Init / Ramp-up (Initialization Phase)

  • Work Job: Context Loading. The process of loading AI models and data into memory.
  • Key Metric: HBM Power Usage. The power consumption of High Bandwidth Memory becomes a key indicator.
  • Power/Cooling: As VRAM operates, Power consumption begins to rise (Power UP).

3. Execution (Execution Phase)

  • Work Job: Kernel Launch. The point where actual computation kernels begin running on the GPU.
  • Key Metric: Power Draw. The actual amount of electrical power being drawn.
  • Power/Cooling: Instant Power Peak. A critical moment where power consumption spikes rapidly as computation begins in earnest. The stability of the power supply unit (PSU) is vital here.

4. Sustained (Heavy Load Phase)

  • Work Job: Heavy Load. Continuous heavy computation is in progress.
  • Key Metric: Thermal/Power Cap. Monitoring against set limits for temperature or power.
  • Power/Cooling:
    • Throttling: If “What-if” scenarios occur (such as power supply leaks or reaching a Thermal Over-Limit), protection mechanisms activate. DVFS (Dynamic Voltage and Frequency Scaling) triggers Throttling (Down Clock) to protect the hardware.

5. Cooldown (Completion Phase)

  • Work Job: Job Complete.
  • Key Metric: Power State. The state changes to “Change Down.”
  • Power/Cooling: Although the job is finished, Residual Heat remains in the hardware. Instead of shutting off fans immediately, Ramp-down Control is used to cool the equipment gradually and safely.

Summary & Key Takeaways

This diagram demonstrates that managing AI infrastructure goes beyond simply “running a job.” It requires active control of the infrastructure (e.g., PreCooling, Throttling, Ramp-down) to handle the specific characteristics of AI workloads, such as rapid power spikes and high heat generation.

Phase 1 (PreCooling) for proactive heat management and Phase 4 (Throttling) for hardware protection are the core mechanisms determining the stability and efficiency of an AI Data Center.


#AI #ArtificialIntelligence #GPU #HPC #DataCenter #AIInfrastructure #DataCenterOps #GreenIT #SustainableTech #SmartCooling #PowerEfficiency #PowerManagement #ThermalEngineering #TDP #DVFS #Semiconductor #SystemArchitecture #ITOperations

With Gemini

Data Center Shift with AI

Data Center Shift with AI

This diagram illustrates how data centers are transforming as they enter the AI era.

๐Ÿ“… Timeline of Technological Evolution

The top section shows major technology revolutions and their timelines:

  • Internet ’95 (Internet era)
  • Mobile ’07 (Mobile era)
  • Cloud ’10 (Cloud era)
  • Blockchain
  • AI(LLM) ’22 (Large Language Model-based AI era)

๐Ÿข Traditional Data Center Components

Conventional data centers consisted of the following core components:

  • Software
  • Server
  • Network
  • Power
  • Cooling

These were designed as relatively independent layers.

๐Ÿš€ New Requirements in the AI Era

With the introduction of AI (especially LLMs), data centers require specialized infrastructure:

  1. LLM Model – Operating large language models
  2. GPU – High-performance graphics processing units (essential for AI computations)
  3. High B/W – High-bandwidth networks (for processing large volumes of data)
  4. SMR/HVDC – Switched-Mode Rectifier/High-Voltage Direct Current power systems
  5. Liquid/CDU – Liquid cooling/Cooling Distribution Units (for cooling high-heat GPUs)

๐Ÿ”— Key Characteristic of AI Data Centers: Integrated Design

The circular connection in the center of the diagram represents the most critical feature of AI data centers:

Tight Interdependency between SW/Computing/Network โ†” Power/Cooling

Unlike traditional data centers, in AI data centers:

  • GPU-based computing consumes enormous power and generates significant heat
  • High B/W networks consume additional power during massive data transfers between GPUs
  • Power systems (SMR/HVDC) must stably supply high power density
  • Liquid cooling (Liquid/CDU) must handle high-density GPU heat in real-time

These elements must be closely integrated in design, and optimizing just one element cannot guarantee overall system performance.

๐Ÿ’ก Key Message

AI workloads require moving beyond the traditional layer-by-layer independent design approach of conventional data centers, demanding that computing-network-power-cooling be designed as one integrated system. This demonstrates that a holistic approach is essential when building AI data centers.


๐Ÿ“ Summary

AI data centers fundamentally differ from traditional data centers through the tight integration of computing, networking, power, and cooling systems. GPU-based AI workloads create unprecedented power density and heat generation, requiring liquid cooling and HVDC power systems. Success in AI infrastructure demands holistic design where all components are co-optimized rather than independently engineered.

#AIDataCenter #DataCenterEvolution #GPUInfrastructure #LiquidCooling #AIComputing #LLM #DataCenterDesign #HighPerformanceComputing #AIInfrastructure #HVDC #HolisticDesign #CloudComputing #DataCenterCooling #AIWorkloads #FutureOfDataCenters

With Claude

CDU ( OCP Project Deschutes ) Numbers

OCP CDU (Deschutes) Standard Overview

The provided visual summarizes the key performance metrics of the CDU (Cooling Distribution Unit) that adheres to the OCP (Open Compute Project) ‘Project Deschutes’ specification. This CDU is designed for high-performance computing environments, particularly for massive-scale liquid cooling of AI/ML workloads.


Key Performance Indicators

  • System Availability: The primary target for system availability is 99.999%. This represents an extremely high level of reliability, with less than 5 minutes and 15 seconds of downtime per year.
  • Thermal Load Capacity: The CDU is designed to handle a thermal load of up to 2,000 kW, which is among the highest thermal capacities in the industry.
  • Power Usage: The CDU itself consumes 74 kW of power.
  • IT Flow Rate: It supplies coolant to the servers at a rate of 500 GPM (approximately 1,900 LPM).
  • Operating Pressure: The overall system operating pressure is within a range of 0-130 psig (approximately 0-900 kPa).
  • IT Differential Pressure: The pressure difference required on the server side is 80-90 psi (approximately 550-620 kPa).
  • Approach Temperature: The approach temperature, a key indicator of heat exchange efficiency, is targeted at โ‰ค3โˆ˜C. A lower value is better, as it signifies more efficient heat removal.

Why Cooling is Crucial for GPU Performance

Cooling has a direct and significant impact on GPU performance and stability. Because GPUs are highly sensitive to heat, if they are not maintained within an optimal temperature range, they will automatically reduce their performance through a process called thermal throttling to prevent damage.

The ‘Project Deschutes’ CDU is engineered to prevent this by handling a massive thermal load of 2,000 kW with a powerful 500 GPM flow rate and a low approach temperature of โ‰ค3โˆ˜C. This robust cooling capability ensures that GPUs can operate at their maximum potential without being limited by heat, which is essential for maximizing performance in demanding AI workloads.

with Gemini