DC Data Service Model


DC Data Service Model Overview

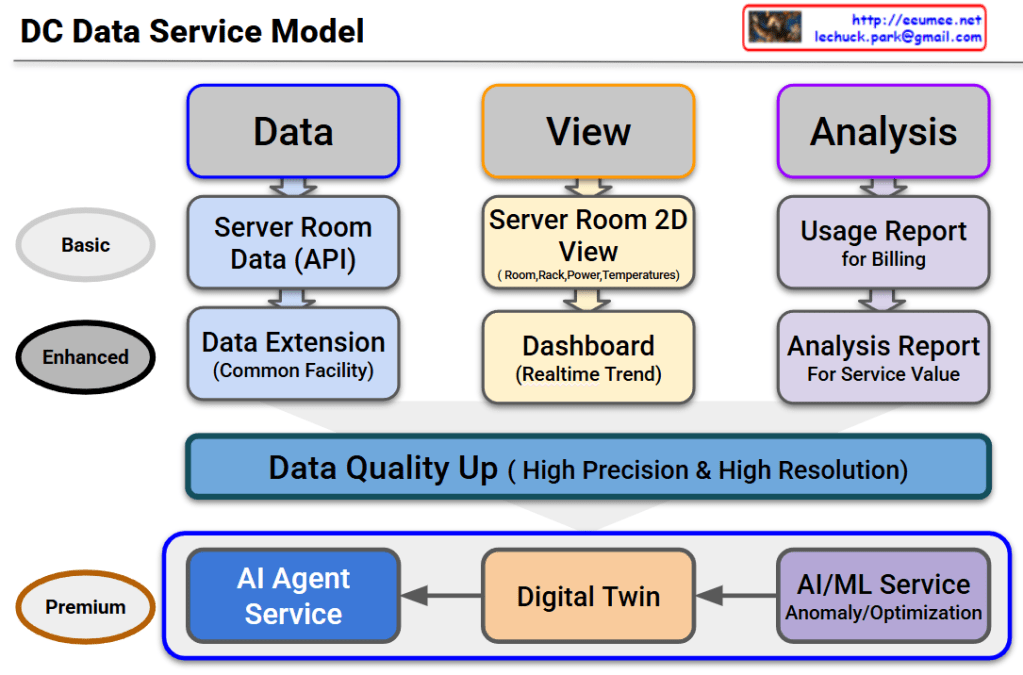
This diagram outlines the evolutionary roadmap of a Data Center (DC) Data Service Model. It illustrates how data center operations advance from basic monitoring to a highly autonomous, AI-driven environment. The model is structured across three functional pillars—Data, View, and Analysis—and progresses through three key service tiers.

Here is a breakdown of the evolving stages:

1. Basic Tier (The Foundation)

This is the foundational level, focusing on essential monitoring and billing.

  • Data: It begins with collecting Server Room Data via APIs.
  • View: Operators use a Server Room 2D View to track basic statuses like room layouts, rack placement, power consumption, and temperatures.
  • Analysis: The collected data is used to generate a basic Usage Report, primarily for customer billing.

2. Enhanced Tier (Real-time & Expanded Scope)

This tier broadens the monitoring scope and provides deeper operational insights.

  • Data: Data collection is expanded beyond the server room to include the Common Facility (Data Extension).
  • View: The user interface upgrades to a dynamic Dashboard that displays real-time operational trends.
  • Analysis: Reporting evolves into an Analysis Report, designed to extract deeper insights and improve overall service value.

3. The Bridge: Data Quality Up

Before transitioning to the ultimate AI-driven tier, there is a critical prerequisite layer. To effectively utilize AI, the system must secure data of High Precision & High Resolution. High-quality data is the fuel for the advanced services that follow.

4. Premium Tier (AI Agent as the Ultimate Orchestrator)

This is the ultimate goal of the model. The updated diagram highlights a clear, sequential flow where each advanced technology builds upon the last, culminating in a comprehensive AI Agent Service:

  • AI/ML Service: The high-quality data is first processed here to automatically detect anomalies and calculate optimizations (e.g., maximizing cooling and power efficiency).
  • Digital Twin: The analytical insights from the AI/ML layer are then integrated into a Digital Twin—a virtual, highly accurate replica of the physical data center used for real-time simulation and spatial monitoring.
  • AI Agent Service: This is the final and most critical layer. The AI Agent does not just sit alongside the other tools; it acts as the central brain. Through this final Agent Service, the capabilities of all preceding services are expanded and put into action. By leveraging the predictive power of the AI/ML models and the comprehensive visibility of the Digital Twin, the AI Agent can autonomously manage, resolve issues, and optimize the data center, maximizing the ultimate value of the entire data pipeline.

#DataCenter #DCIM #AIAgent #DigitalTwin #MachineLearning #ITOperations #TechInfrastructure #FutureOfTech #SmartDataCenter

New Risk @ AI DC

Overview: New Risks at AI Data Centers

The image outlines the infrastructure challenges faced by modern AI Data Centers (AI DC), specifically focusing on the high demands placed on hardware like GPUs. It divides these challenges into two primary categories: Power Risk and Cooling Risk.

The central graphic illustrates that the core AI processing units (Brains/GPUs) are entirely dependent on these two foundational elements.


⚡ Power Risk

This section highlights issues related to power supply and infrastructure (such as Power Diversification, ESS, and 800V HVDC).

  • Power Supply Shortage (GPU Power Throttling): When the facility cannot provide enough power, GPUs slow down to compensate.
    • Impacts: Delays in AI workloads, financial losses due to lost data checkpoints, and the collapse of synchronization across the entire computing cluster.
  • Rapid Power Fluctuations: Sudden spikes or drops in the power supply.
    • Impacts: Voltage sag, electrical resonance in external grids, and reduced lifespan or physical damage to backup power systems like generators and UPS (Uninterruptible Power Supplies).
  • Power Quality Degradation: When the provided electricity is “noisy” or unstable.
    • Impacts: Malfunctions in protective electrical relays, overheating of server Power Supply Units (PSUs), and unexplained network communication errors.

❄️ Cooling Risk

This section focuses on the challenges of managing the massive heat generated by AI workloads, specifically looking at Liquid Cooling and changes in Cooling Distribution Unit (CDU) environments.

  • Cooling Supply Shortage (GPU Thermal Throttling): When the cooling system cannot remove heat fast enough, GPUs slow down to prevent melting.
    • Impacts: Delays in AI workloads, reduced lifespan and increased defects in GPUs, and long-term damage to surrounding server equipment.
  • Leakage Occurrence: Physical leaks in the liquid cooling system.
    • Impacts: Immediate equipment burnout (short circuits), risk of electrical arc flashes and fires, and cascading system shutdowns due to a loss of pressure in the cooling loop.
  • Cooling Water Quality Deterioration: When the liquid used for cooling becomes contaminated or degrades.
    • Impacts: Formation of localized “hot-spots” where cooling fails, a sharp decline in overall cooling efficiency, and mechanical wear and tear on the CDU pumps.

📝 Summary

  1. AI Data Centers face critical new infrastructure risks divided into two main categories: supplying massive amounts of power and managing extreme heat.
  2. Power-related risks (shortages, fluctuations, and poor quality) lead to severe workload delays, cluster synchronization failures, and damage to backup generators.
  3. Cooling-related risks (insufficient cooling, leaks, and poor water quality) cause thermal throttling, severe hardware damage, and potentially catastrophic fires.

#AIDataCenter #DataCenterInfrastructure #GPUPower #LiquidCooling #DataCenterRisk #ThermalThrottling #TechInfrastructure

With Gemini

Data Center Changes

The Evolution of Data Centers

This infographic, titled “Data Center Changes,” visually explains how data center requirements are skyrocketing due to the shift from traditional computing to AI-driven workloads.

The chart compares three stages of data centers across two main metrics: Rack Density (how much power a single server rack consumes, shown on the vertical axis) and the overall Total Power Capacity (represented by the size and labels of the circles).

  • Traditional DC (Data Center): In the past, data centers ran at a very low rack density of around 2kW. The total power capacity required for a facility was relatively small, at around 10 MW.
  • Cloud-native DC: As cloud computing took over, the demands increased. Rack densities jumped to about 10kW, and the overall facility size grew to require around 100 MW of power.
  • AI DC: This is where we see a massive leap. Driven by heavy GPU workloads, AI data centers push rack densities beyond 100kW+. The scale of these facilities is enormous, demanding up to 1GW of power. The red starburst shape also highlights a new challenge: “Ultra-high Volatility,” meaning the power draw isn’t stable; it spikes violently depending on what the AI is processing.

The Three Core Challenges (Bottom Panels)

The bottom three panels summarize the key takeaways of transitioning to AI Data Centers:

  1. Scale (Massive Investment): Building a 1GW “Campus-scale” AI data center requires astronomical capital expenditure (CAPEX). To put this into perspective, the chart notes that just 10MW costs roughly 200 billion KRW (South Korean Won). Scaling that to 1GW is a colossal financial undertaking.
  2. Density (The Need for Liquid Cooling): Power density per rack is jumping from 2kW to 100kW—a 50x increase. Traditional air-conditioning cannot cool servers running this hot, meaning the industry must transition to advanced liquid cooling technologies.
  3. Volatility (Unpredictable Demands): Unlike traditional servers that run at a steady hum, AI GPU workloads change in real-time. A sudden surge in computing tasks instantly spikes both the electricity needed to run the GPUs and the cooling power needed to keep them from melting.

Summary

  • Data centers are undergoing a massive transformation from Traditional (10MW) and Cloud (100MW) models to gigantic AI Data Centers requiring up to 1 Gigawatt (1GW) of power.
  • Because AI servers use powerful GPUs, power density per rack is increasing 50-fold (up to 100kW+), forcing a shift from traditional air cooling to advanced liquid cooling.
  • This AI infrastructure requires staggering financial investments (CAPEX) and must be designed to handle extreme, real-time volatility in both power and cooling demands.

#DataCenter #AIDataCenter #LiquidCooling #GPU #CloudComputing #TechTrends #TechInfrastructure #CAPEX

With Gemini

AI DC Power Risk with BESS


Technical Analysis: The Impact of AI Loads on Weak Grids

1. The Problem: A Threat to Grid Stability

Large-scale AI loads combined with “Weak Grids” (where the Short Circuit Ratio, or SCR, is less than 3) significantly threaten power grid stability.

  • AI Workload Characteristics: These loads are defined by sudden “Step Power Changes” and “Pulse-type Profiles” rather than steady consumption.
  • Sensitivity: NERC (2025) warns that the decrease in voltage-sensitive loads and the rise of periodic workloads are major drivers of grid instability.

2. The Vicious Cycle of Instability

The images illustrate a four-stage downward spiral triggered by the interaction between AI hardware and a fragile power infrastructure:

  • Voltage Dip: As AI loads suddenly spike, the grid’s high impedance causes a temporary but sharp drop in voltage levels. This degrades #PowerQuality and causes #VoltageSag.
  • Load Drop: When voltage falls too low, protection systems trigger a sudden disconnection of the load ($P \rightarrow 0$). This leads to #ServiceDowntime and massive #LoadShedding.
  • Snap-back: As the grid tries to recover or the load re-engages, there is a rapid and sudden power surge. This creates dangerous #Overvoltage and #SurgeInflow.
  • Instability: The repetition of these fluctuations leads to waveform distortion and oscillation. Eventually, this causes #GridCollapse and a total #LossOfControl.

3. The Solution: BESS as a Reliability Asset

The final analysis reveals that a Battery Energy Storage System (BESS) acts as the critical circuit breaker for this vicious cycle.

  • Fast Response Buffer: BESS provides immediate energy injection the moment a dip is detected, maintaining voltage levels.
  • Continuity Anchor: By holding the voltage steady, it prevents protection systems from “tripping,” ensuring uninterrupted operation for AI servers.
  • Shock Absorber: During power recovery, BESS absorbs excess energy to “smooth” the transition and protect sensitive hardware from spikes.
  • The Grid-forming Stabilizer: It uses active waveform control to stop oscillations, providing the “virtual inertia” needed to prevent total grid collapse.

Summary

  1. AI Load Dynamics: The erratic “pulse” nature of AI power consumption acts as a physical shock to weak grids, necessitating a new layer of protection.
  2. Beyond Backup Power: In this context, BESS is redefined as a Reliability Asset that transforms a “Weak Grid” into a resilient “Strong Grid” environment.
  3. Operational Continuity: By filling gaps, absorbing shocks, and anchoring the grid, BESS ensures that AI data centers remain operational even during severe transient events.

#BESS #GridStability #AIDataCenter #PowerQuality #WeakGrid #EnergyStorage #NERC2025 #VoltageSag #VirtualInertia #TechInfrastructure

with Gemini

Peak Shaving with Data

Graph Interpretation: Power Peak Shaving in AI Data Centers

This graph illustrates the shift in power consumption patterns from traditional data centers to AI-driven data centers and the necessity of “Peak Shaving” strategies.

1. Standard DC (Green Line – Left)

  • Characteristics: Shows “Stable” power consumption.
  • Interpretation: Traditional server workloads are relatively predictable with low volatility. The power demand stays within a consistent range.

2. Training Job Spike (Purple Line – Middle)

  • Characteristics: Significant fluctuations labeled “Peak Shaving Area.”
  • Interpretation: During AI model training, power demand becomes highly volatile. The spikes (peaks) and valleys represent the intensive GPU cycles required during training phases.

3. AI DC & Massive Job Starting (Red Line – Right)

  • Characteristics: A sharp, vertical-like surge in power usage.
  • Interpretation: As massive AI jobs (LLM training, etc.) start, the power load skyrockets. The graph shows a “Pre-emptive Analysis & Preparation” phase where the system detects the surge before it hits the maximum threshold.

4. ESS Work & Peak Shaving (Purple Dotted Box – Top Right)

  • The Strategy: To handle the “Massive Job Starting,” the system utilizes ESS (Energy Storage Systems).
  • Action: Instead of drawing all power from the main grid (which could cause instability or high costs), the ESS discharges stored energy to “shave” the peak, smoothing out the demand and ensuring the AI DC operates safely.

Summary

  1. Volatility Shift: AI workloads (GPU-intensive) create much more extreme and unpredictable power spikes compared to standard data center operations.
  2. Proactive Management: Modern AI Data Centers require pre-emptive detection and analysis to prepare for sudden surges in energy demand.
  3. ESS Integration: Energy Storage Systems (ESS) are critical for “Peak Shaving,” providing the necessary power buffer to maintain grid stability and cost efficiency.

#DataCenter #AI #PeakShaving #EnergyStorage #ESS #GPU #PowerManagement #SmartGrid #TechInfrastructure #AIDC #EnergyEfficiency

with Gemini