Overview: New Power Architecture in AI DC
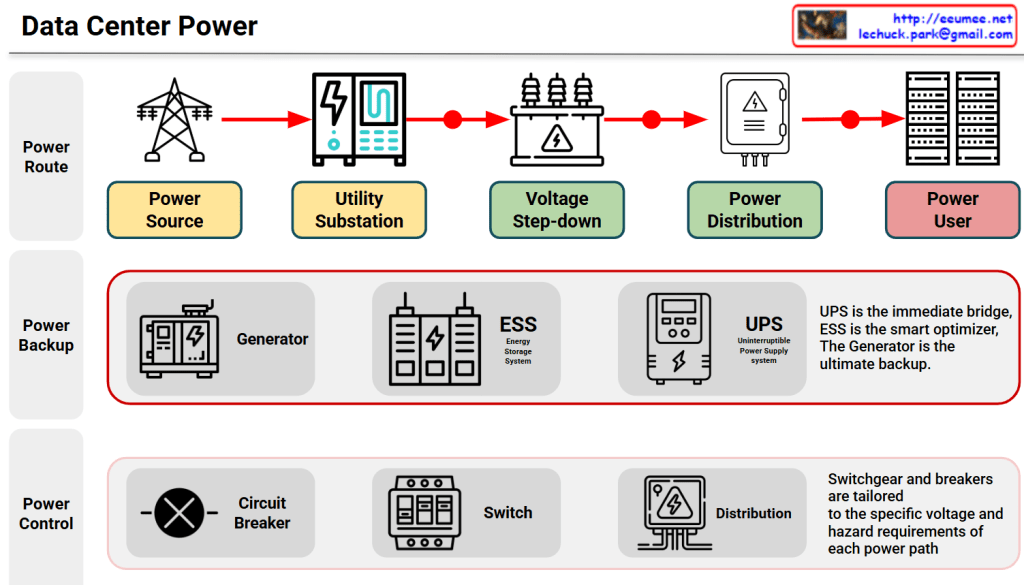
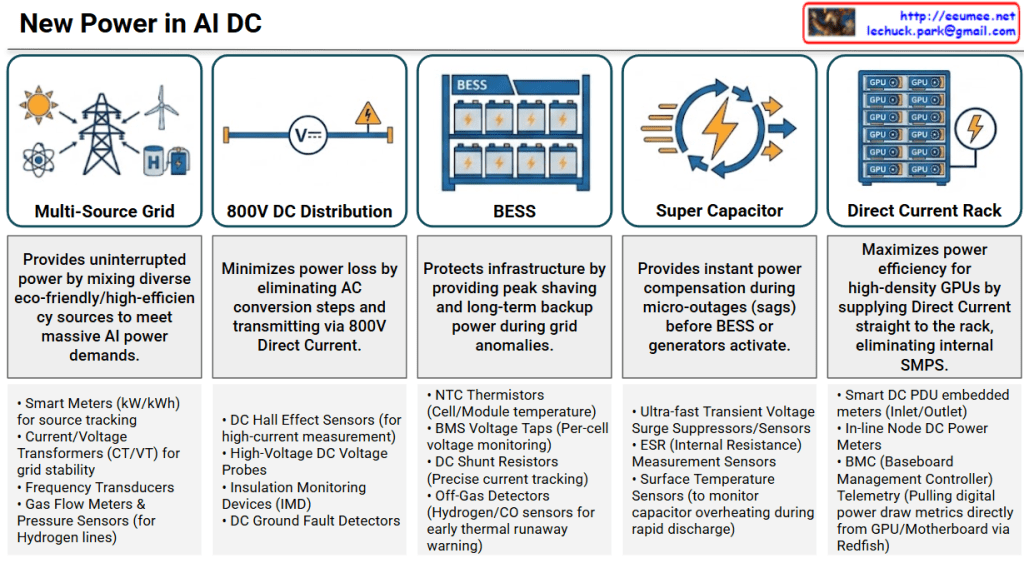
This infographic outlines a multi-layered, hybrid power infrastructure designed to meet the colossal, dynamic power demands of modern AI factories. The system progresses from varied facility-level power sources down to logic-level components, integrated into a unified direct-current environment. The primary objectives are to minimize conversion losses, ensure uninterrupted operation, and provide granular, digital telemetry for proactive management.
The Five Stages of Power Flow
1. Multi-Source Grid (Grid Receiving)
- Icon: A convergence of diverse sources, including power transmission towers (Grid), solar, wind turbines, atom/SMR, and hydrogen lines.
- Role: Provides uninterrupted mixed power from green and high-efficiency sources to meet massive AI power demands.
- Key Metrics: Supply volume/dependency per source (Grid vs. Microgrid), grid frequency and voltage stability, SMR/Hydrogen fuel status, and facility-level carbon footprint (PUE/CUE).
2. 800V DC Distribution (Direct Current Busbar)
- Icon: A straight high-voltage DC busbar with the “V—” DC symbol and a high-voltage warning indicator.
- Role: Minimizes power conversion loss by eliminating several AC conversion steps and transmitting power at 800V High-Voltage Direct Current (HVDC).
- Key Metrics: Main Busbar DC voltage/current, voltage drop and line loss rate, and insulation resistance/ground fault detection.
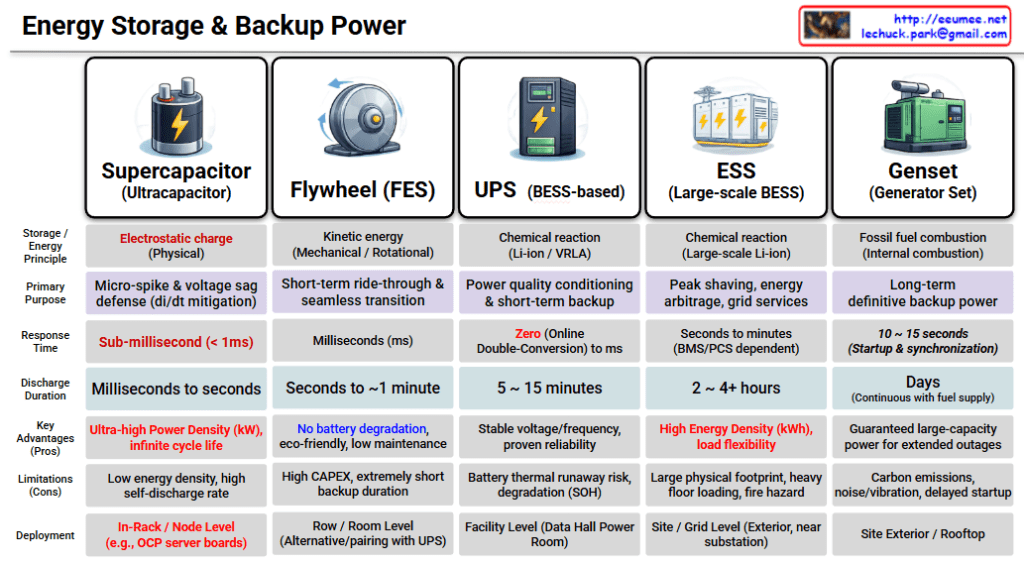
3. BESS (Battery Energy Storage System) (Modular Storage Racks)
- Icon: Multiple modular industrial battery storage racks.
- Role: Protects infrastructure via peak shaving (reducing peak grid load) and provides long-term backup power during grid anomalies or outages.
- Key Metrics: State of Charge (SoC) & State of Health (SoH), cell/module-level temperature and thermal runaway detection, real-time C-rate, and available capacity.
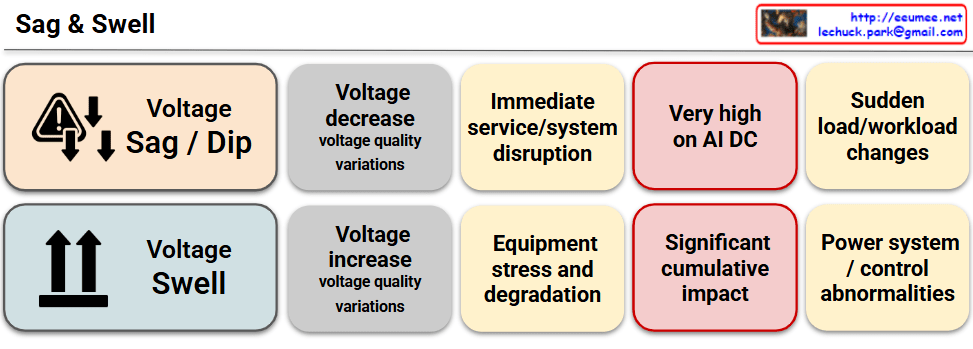
4. Super Capacitor (Ultra-short Power Compensation) (Rapid Compensation Loop)
- Icon: A dynamic lightning bolt with rapid response arrows in a circular flow.
- Role: Provides instant power compensation during micro-outages (voltage sags/sags) to bridge the millisecond gap before BESS or generators can activate.
- Key Metrics: Voltage sag detection response time (ms), ride-through time, equivalent series resistance (ESR), and cycle life.
5. Direct Current Rack (DC-Powered GPU Rack) (DC Rack Inlet)
- Icon: A high-density server rack populated with GPU nodes. A distinct DC power input is connected, and the rack does not require a bulky internal AC/DC power supply unit.
- Role: Maximizes power efficiency for high-density GPUs by supplying direct current straight to the rack, completely eliminating the internal SMPS conversion stage.
- Key Metrics: Total rack power consumption (kW), DC PDU voltage/current and top/bottom balance, and GPU node-level power draw.
Summary
This infographic describes a multi-layered hybrid power architecture designed for AI data centers. The architecture progresses from a diverse array of power sources—including a 1. Multi-Source Grid (renewable, hydrogen, SMR)—through to a central 2. 800V DC Distribution busbar, all integrated into a unified hybrid direct-current environment. The system balances hybrid loads by combining the immediate, millisecond response of the 4. Super Capacitor (ride-through) with the long-term backup and peak-shaving capabilities of the 3. BESS (modular battery storage). This facility-level infrastructure ultimately provides direct, conversion-free power to the 5. Direct Current Rack (DC-powered GPU rack). A critical innovation of this architecture is the facility-to-IT handshake, where digital telemetry (PDU, node meters, Redfish telemetry from GPUs) enables granular Root Cause Analysis (RCA) to instantly separate facility faults (flow/voltage anomalies) from IT server faults (component degradation/thermal throttling).
#AIDC #PowerInfrastructure #800VDC #DirectCurrent #BESS #SuperCapacitor #GreenEnergy #Hydrogen #SMR #GPUDensity #PowerTelemetry
With Gemini