Power Capping in the Linux kernel

Power Capping in the Linux Kernel

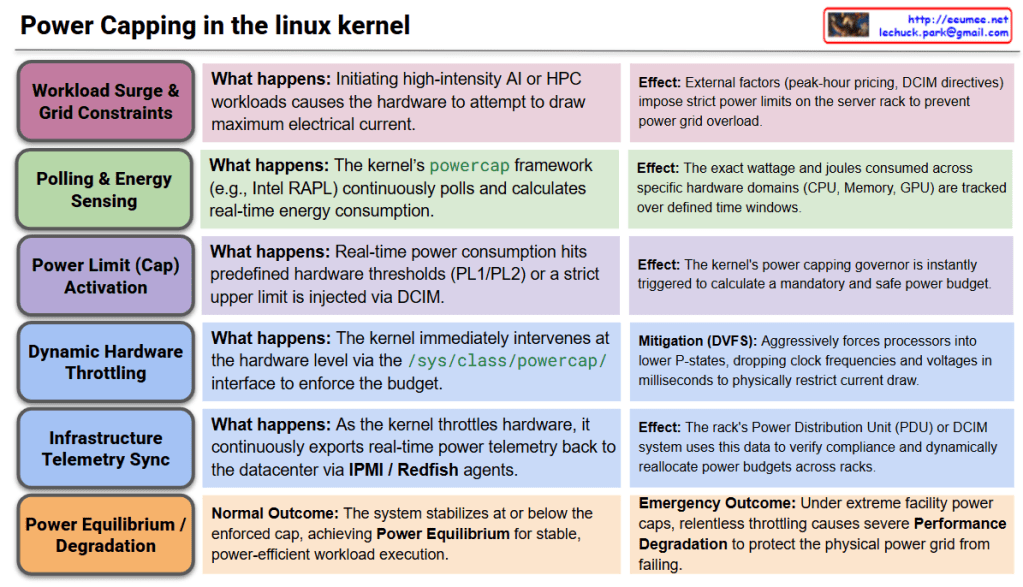
This architecture outlines the closed-loop logic flow of the Linux kernel’s powercap framework. It details how the kernel enforces strict energy limits on hardware to manage heavy AI workloads while coordinating with the datacenter’s external power grid and infrastructure.

  • Stage 1: Workload Surge & Power Grid ConstraintsWhen high-intensity AI or HPC workloads are dispatched, the hardware immediately attempts to draw maximum electrical current. Concurrently, external factors—such as peak-hour electricity pricing, facility power limits, or a Datacenter Infrastructure Management (DCIM) directive—may impose strict power constraints on the server rack.
  • Stage 2: Polling & Energy SensingTo monitor power draw, the kernel’s powercap framework utilizes hardware interfaces like Intel RAPL (Running Average Power Limit) or AMD Node Manager. It continuously polls and calculates real-time energy consumption, tracking the exact wattage and joules consumed across specific hardware domains (CPU, memory, GPU) over defined time windows.
  • Stage 3: Power Limit (Cap) ActivationIf the real-time power consumption hits predefined hardware thresholds (such as PL1 or PL2 limits), or if an external DCIM system injects a strict upper power limit via the /sys/class/powercap/ interface, the kernel’s power capping governor is instantly triggered into action.
  • Stage 4: Dynamic Hardware Throttling (Local Mitigation)To enforce the mandatory power budget, the kernel immediately intervenes at the hardware level. It aggressively utilizes DVFS (Dynamic Voltage and Frequency Scaling) to force the processors into lower P-states, dropping clock frequencies and voltages within milliseconds to physically restrict the electrical current draw.
  • Stage 5: Infrastructure Telemetry Sync (Global Mitigation)As the kernel throttles the hardware, it continuously exports real-time power telemetry back to the datacenter’s control plane via IPMI/Redfish agents. The rack’s Power Distribution Unit (PDU) or DCIM system uses this data to verify compliance with the power cap, allowing the facility to dynamically reallocate power budgets across different server racks.
  • Stage 6: Power Equilibrium / Performance Degradation
    • Normal Outcome: The system successfully stabilizes at or below the enforced power cap, achieving Power Equilibrium. The workload continues to execute stably, though at a dynamically calculated, power-efficient pace.
    • Emergency/Degraded Outcome: If the datacenter imposes an extreme power cap (e.g., during a facility power emergency), the kernel will relentlessly throttle the hardware. This causes severe Performance Degradation for the workload, but it successfully prevents catastrophic outcomes like tripping the datacenter’s power breakers.

Summary

  • The Linux kernel uses frameworks like RAPL to continuously monitor and calculate the exact energy consumption of server components during heavy workloads.
  • When hardware limits are reached or external datacenter power caps are applied, the kernel instantly throttles CPU/GPU frequencies and voltages to restrict electrical draw.
  • This system ensures the server stays strictly within its assigned power budget, sacrificing raw performance if necessary to protect the datacenter’s physical power grid from failing.

#LinuxKernel #PowerCapping #RAPL #PowerManagement #DataCenterInfrastructure #GreenComputing #HPC #DCIM #EnergyEfficiency

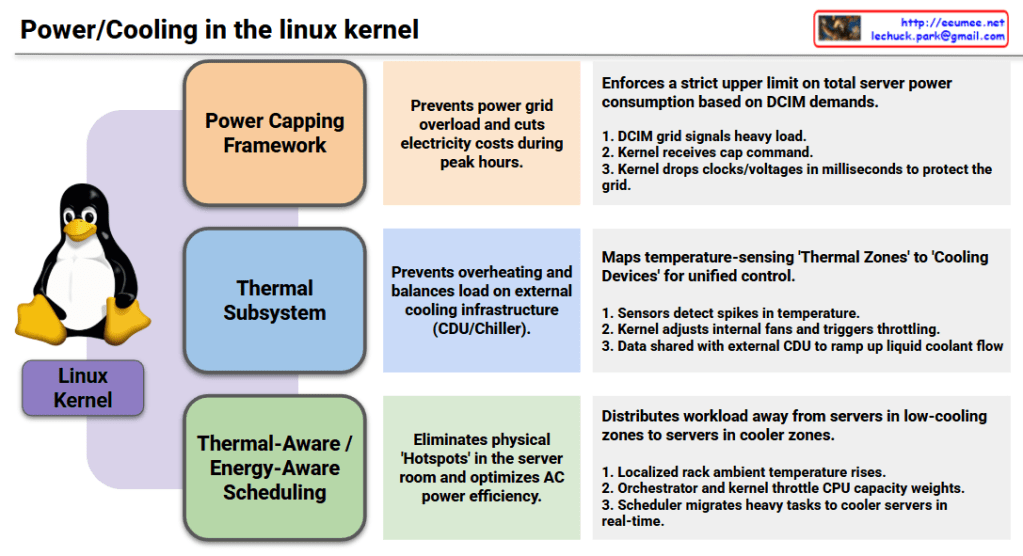
Power/Cooling in the linux kernel

1. Power Capping Framework

  • Objective (Center): Prevents power grid overload and cuts electricity costs during peak hours.
  • Mechanism (Right): Enforces a strict upper limit on total server power consumption based on DCIM (Datacenter Infrastructure Management) demands.
    1. The DCIM grid signals a heavy load status.
    2. The Linux kernel receives the specific power capping command.
    3. The kernel immediately drops processor clocks and voltages in milliseconds to protect the local power grid.

2. Thermal Subsystem

  • Objective (Center): Prevents hardware overheating and balances the load on external cooling infrastructure, such as Coolant Distribution Units (CDUs) and chillers.
  • Mechanism (Right): Maps temperature-sensing ‘Thermal Zones’ directly to hardware ‘Cooling Devices’ for unified, holistic control.
    1. Hardware sensors detect sudden spikes in internal temperature.
    2. The kernel dynamically adjusts internal server fans and triggers safety throttling.
    3. Temperature telemetry data is actively shared with the external datacenter CDU to ramp up liquid coolant flow rates.

3. Thermal-Aware / Energy-Aware Scheduling

  • Objective (Center): Eliminates physical ‘Hotspots’ within the server room layout and optimizes overall air conditioning (AC) power efficiency.
  • Mechanism (Right): Distributes heavy workloads away from physical servers trapped in low-cooling zones to servers located in cooler zones.
    1. The localized ambient temperature around a specific server rack rises.
    2. The datacenter orchestrator and the kernel work together to throttle the target CPU’s capacity weights.
    3. The Linux scheduler automatically migrates heavy compute tasks to cooler servers across the room in real-time.

Modern Linux has evolved beyond managing isolated servers; it now acts as a holistic orchestrator that treats the datacenter’s power grid, liquid cooling loops, and air conditioning as a single, unified organism.

#LinuxKernel #PowerManagement #ThermalSubsystem #EnergyAwareScheduling #DatacenterInfrastructure #DCIM #LiquidCooling #GreenComputing #HPC #InfrastructureAutomation #CloudInfrastructure

With Gemini

DC Data Service Model


DC Data Service Model Overview

This diagram outlines the evolutionary roadmap of a Data Center (DC) Data Service Model. It illustrates how data center operations advance from basic monitoring to a highly autonomous, AI-driven environment. The model is structured across three functional pillars—Data, View, and Analysis—and progresses through three key service tiers.

Here is a breakdown of the evolving stages:

1. Basic Tier (The Foundation)

This is the foundational level, focusing on essential monitoring and billing.

  • Data: It begins with collecting Server Room Data via APIs.
  • View: Operators use a Server Room 2D View to track basic statuses like room layouts, rack placement, power consumption, and temperatures.
  • Analysis: The collected data is used to generate a basic Usage Report, primarily for customer billing.

2. Enhanced Tier (Real-time & Expanded Scope)

This tier broadens the monitoring scope and provides deeper operational insights.

  • Data: Data collection is expanded beyond the server room to include the Common Facility (Data Extension).
  • View: The user interface upgrades to a dynamic Dashboard that displays real-time operational trends.
  • Analysis: Reporting evolves into an Analysis Report, designed to extract deeper insights and improve overall service value.

3. The Bridge: Data Quality Up

Before transitioning to the ultimate AI-driven tier, there is a critical prerequisite layer. To effectively utilize AI, the system must secure data of High Precision & High Resolution. High-quality data is the fuel for the advanced services that follow.

4. Premium Tier (AI Agent as the Ultimate Orchestrator)

This is the ultimate goal of the model. The updated diagram highlights a clear, sequential flow where each advanced technology builds upon the last, culminating in a comprehensive AI Agent Service:

  • AI/ML Service: The high-quality data is first processed here to automatically detect anomalies and calculate optimizations (e.g., maximizing cooling and power efficiency).
  • Digital Twin: The analytical insights from the AI/ML layer are then integrated into a Digital Twin—a virtual, highly accurate replica of the physical data center used for real-time simulation and spatial monitoring.
  • AI Agent Service: This is the final and most critical layer. The AI Agent does not just sit alongside the other tools; it acts as the central brain. Through this final Agent Service, the capabilities of all preceding services are expanded and put into action. By leveraging the predictive power of the AI/ML models and the comprehensive visibility of the Digital Twin, the AI Agent can autonomously manage, resolve issues, and optimize the data center, maximizing the ultimate value of the entire data pipeline.

#DataCenter #DCIM #AIAgent #DigitalTwin #MachineLearning #ITOperations #TechInfrastructure #FutureOfTech #SmartDataCenter

Data Center Mgt. System Req.

System Components (Top Level)

Six core components:

  • Facility: Data center physical infrastructure
  • Data List: Data management and cataloging
  • Data Converter: Data format conversion
  • Network: Network infrastructure
  • Server: Server hardware
  • Software (Database): Applications and database systems

Universal Mandatory Requirements

Fundamental requirements applied to ALL components:

  • Stability (24/7 HA): 24/7 High Availability – All systems must operate continuously without interruption
  • Performance: Optimal performance assurance – All components must meet required performance levels

Component-Specific Additional Requirements

1. Data List

  • Sampling Rate, Computing Power, HW/SW Interface

2. Data Converter

  • Data Capacity, Computing Power, Program Logic (control facilities), High Availability

3. Network

  • Private NW, Bandwidth, Architecture (L2/L3, Ring/Star), UTP/Optic, Management Include

4. Server

  • Computing Power, Storage Sizing, High Availability, External (Public Network)

5. Software/Database

  • Data Integrity, Cloud-like High Availability & Scale-out, Monitoring, Event Management, Analysis (AI)

This architecture emphasizes that stability and performance are fundamental prerequisites for data center operations, with each component having its own specific additional requirements built upon these two essential foundation requirements.

With Claude

log with the LLM

From Claude with some prompting
This image represents an “Alarm log with the LLM” system. The key components and functionality are as follows:

  1. NMS (Network Management System): A monitoring system that collects and displays alarm data.
  2. Text-based Event-driven Syslog: A system that logs events and alarm data in real-time text format. Syslog provides immediate data that is easily collected from existing environments.
  3. DCIM (Data Center Infrastructure Management): A system that manages the physical infrastructure of a data center, including alarms and monitoring.
  4. AI: An artificial intelligence component that utilizes a Large Language Model (LLM) for learning.
  5. 1-minute alarm analysis results and solutions: From a real-time monitoring perspective, this analyzes immediate alarm situations and provides solutions.
  6. 1-month alarm analysis: This long-term analysis of alarm data identifies anticipated problems. The analysis results can be used to provide a chatbot-based status query and response environment.

Overall, this system can provide powerful alarm management capabilities through real-time monitoring and predictive analysis.

Lechuck History

From Claude with some prompting
“Lechuck History” diagram demonstrates the following technical career progression:

  1. “with Computer” section:
    • Advanced from C-based programming to system programming, O&M solutions, and network programming
    • Possess deep understanding of Linux kernel, RTOS, and TCP/IP stack
    • Performed “Single-Handedly A to Z” tasks in web service analysis/monitoring
    • Grew into the role of a software engineer
  2. “with People” section:
    • Gained experience in large ISP data centers, system management, large-scale network operations management, and CDN development/management
    • Developed skills to optimize and maximize existing system infrastructure
    • Created new service solutions including D/C business web portals, NMS big-data, DCIM, packet analysis customer solutions, and data analysis platforms
    • Managed “Big DC Op. System Design & DevOps”, demonstrating ability to handle customer-facing roles and collaborate with various partners

Additional key competencies:

  1. Maintain continuous interest in new technologies
  2. Possess the ability to quickly learn based on a solid understanding of fundamentals
  3. Currently enjoy learning cutting-edge technologies including AI and Quantum computing

This career path and skill set demonstrate the profile of a professional who continuously grows and pursues innovation in a rapidly changing technological environment.

BAS + EPMS + @ = DCIM

From Claude with some prompting
This image illustrates the distinction between BAS (Building Automation System), EPMS (Energy Power Management System), and DCIM (Data Center Infrastructure Management), explaining their development and relationships.

  1. BAS (Building Automation System):
    • Focuses on general buildings
    • Emphasizes water management and HVAC (cooling) systems
    • Named “BAS” because water and air conditioning were crucial elements in building management
    • Primarily deals with low-power usage environments
    • Includes water control, cooling control, flow control, and pipe/plumbing management
  2. EPMS (Energy Power Management System):
    • Specialized for high-power usage environments
    • Concentrates on power generation, distribution, and control
    • Developed separately from BAS due to the unique complexities of high-power environments
  3. DCIM (Data Center Infrastructure Management):
    • Tailored for data center environments
    • Integrates functions of both BAS and EPMS
    • Manages power (EPMS) and cooling/environmental (BAS) aspects
    • Addresses additional requirements specific to data centers

The diagram clearly shows the background and characteristics of each system’s development:

  • BAS evolved from the need to manage water and air conditioning in general buildings
  • EPMS developed separately due to the specific requirements of high-power environments
  • DCIM integrates and expands on BAS and EPMS functionalities to meet the complex needs of data centers

The formula “BAS + EPMS + @ = DCIM” indicates that DCIM incorporates the functions of BAS and EPMS, while also including additional management capabilities (@) specific to data centers.

This structure effectively demonstrates how each system has specialized and evolved to suit particular environments and requirements, and how they are ultimately integrated in DCIM for comprehensive management of data center infrastructures.