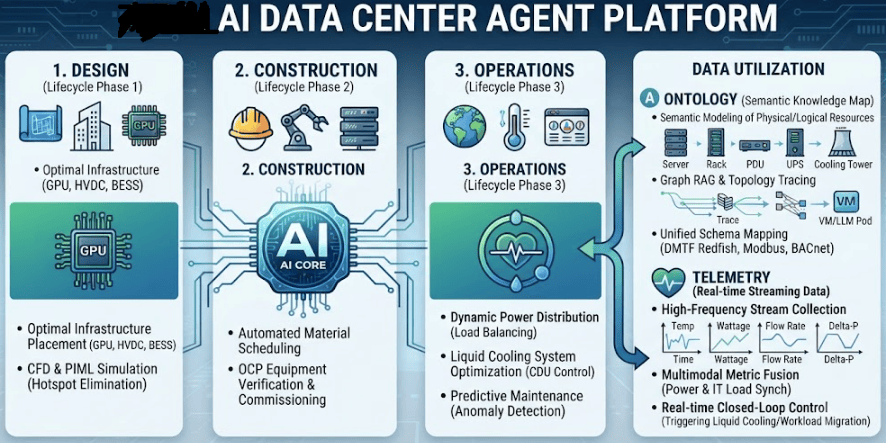
At the top of the image is the title “AI DATA CENTER AGENT PLATFORM”, outlining a system structured around three lifecycle phases and a Data Utilization sector, all orchestrated by the central ‘AI CORE’.
1. DESIGN (Lifecycle Phase 1)
Key Role: Determines optimal infrastructure layouts for high-density GPU clusters, 800V HVDC, and BESS.
Core Technology: Uses CFD and PIML simulations to preemptively eliminate thermal hotspots.
2. CONSTRUCTION (Lifecycle Phase 2)
Key Role: Automates material procurement scheduling and verifies installation compliance for OCP standard equipment.
Core Technology: Streamlines the commissioning process to eliminate human errors and enhance deployment efficiency.
3. OPERATIONS (Lifecycle Phase 3)
Key Role: Executes dynamic power distribution (load balancing) for real-time load fluctuations and optimizes liquid cooling via CDU control.
Core Technology: Performs predictive maintenance with anomaly detection to preemptively prevent failures.
4. DATA UTILIZATION
A. ONTOLOGY (Semantic Knowledge Map)
Defines hierarchical relationships among physical and logical resources (Servers, Racks, PDUs, UPS, Cooling Towers) using semantic modeling.
Utilizes Graph RAG and topology mapping to trace affected VMs or LLM serving Pods within milliseconds during a failure.
Integrates heterogeneous equipment data through standardized schemas (DMTF Redfish, Modbus, BACnet).
B. TELEMETRY (Real-time Streaming Data)
Collects high-frequency time-series streaming data including temperature, wattage, flow rate, and delta-P.
Fuses power infrastructure metrics with IT workload metrics to predict thermal and power peaks proactively.
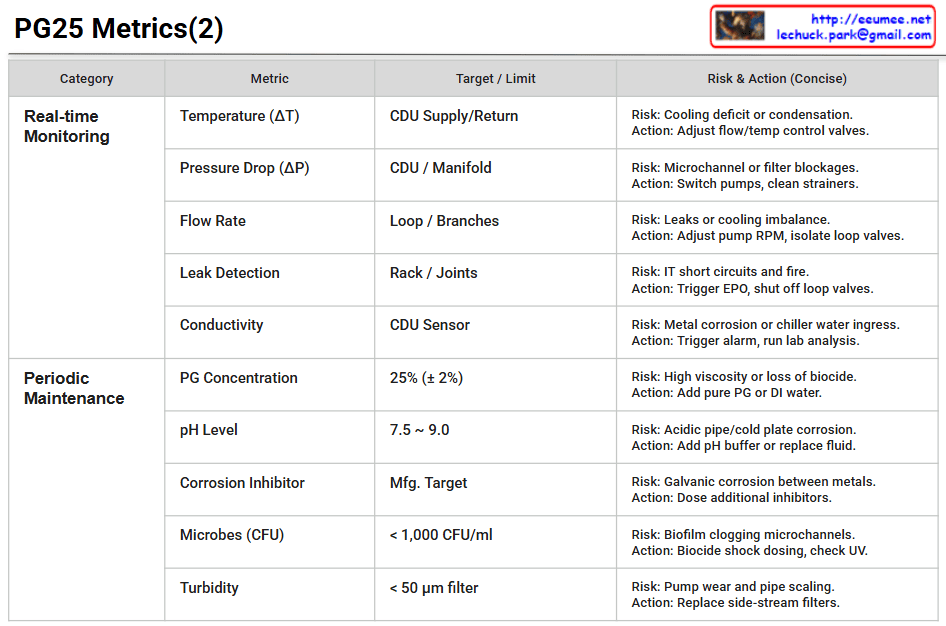
The table categorizes the key metrics required to safely manage a Coolant Distribution Unit (CDU) and its secondary cooling loop using a 25% Propylene Glycol (PG25) mixture into two main sections:
Real-time Monitoring: This section focuses on physical states that require immediate attention. It includes Temperature (ΔT), Pressure Drop (ΔP), Flow Rate, Leak Detection, and Conductivity.
Example: It highlights that a leak at the rack or joints poses a risk of IT short circuits and fire, dictating immediate actions such as triggering the Emergency Power Off (EPO) and shutting off the loop valves.
Periodic Maintenance: This section covers the chemical and biological fluid quality checks that must be performed regularly. It sets targets for PG Concentration (25% ± 2%), pH Level (7.5 ~ 9.0), Corrosion Inhibitor, Microbes (< 1,000 CFU/ml), and Turbidity/Filtration (< 50 μm).
Example: To mitigate the risk of biofilms clogging the tightly packed microchannels, it advises taking actions like biocide shock dosing or checking the UV sterilization system.
📌 Summary
This document is a practical, structured matrix designed for data center operators. It explicitly outlines the essential operational telemetry, potential hardware and fluid risks, and precise mitigation actions needed to maintain a reliable and highly efficient liquid cooling infrastructure.
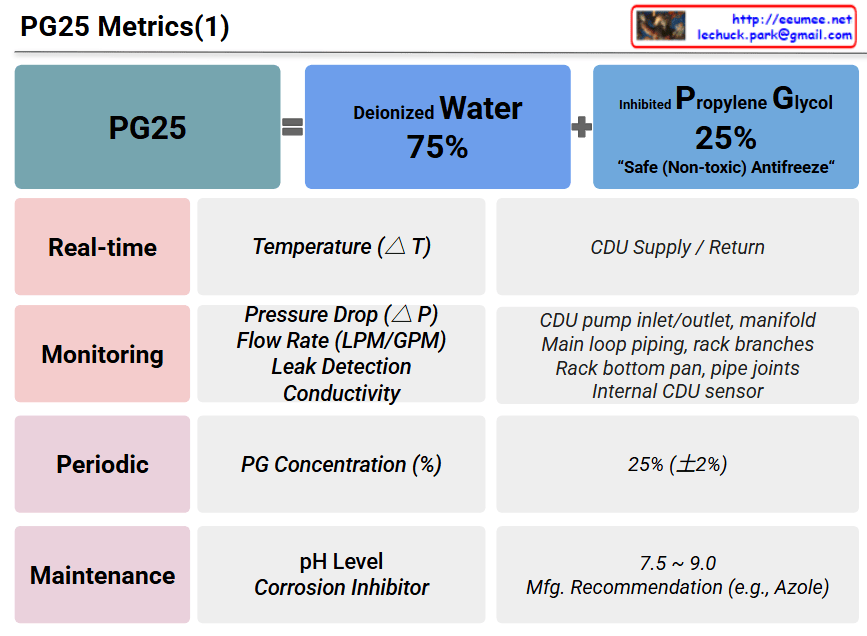
This image file (image_a2495a.png) is a presentation slide titled “PG25 Metrics(1).” It explains the chemical composition of PG25, a cooling fluid often used in liquid cooling systems, and details the key metrics required to manage it effectively.
1. Composition of PG25 (Top Section)
PG25 is defined as a mixture of two primary components.
Deionized Water: 75%
Inhibited Propylene Glycol: 25%
This specific formula is described as a “Safe (Non-toxic) Antifreeze.”
2. Management Metrics (Bottom Table)
The table below categorizes the management metrics into four distinct phases based on frequency and purpose:
Real-time:
Metrics: Temperature change ($\Delta T$)
Location/Reference: CDU (Coolant Distribution Unit) Supply / Return lines
Monitoring:
Metrics: Pressure Drop ($\Delta P$), Flow Rate (LPM/GPM), Leak Detection, and Conductivity
Location/Reference: CDU pump inlet/outlet and manifold, Main loop piping and rack branches, Rack bottom pan and pipe joints, Internal CDU sensor
Periodic:
Metrics: PG (Propylene Glycol) Concentration (%)
Location/Reference: Maintained at 25% ($\pm 2\%$)
Maintenance:
Metrics: pH Level, Corrosion Inhibitor
Location/Reference: pH level kept between 7.5 and 9.0; Corrosion inhibitors managed per Manufacturer’s Recommendation (e.g., Azole)
📝 Summary
This slide provides a systematic guide for maintaining the optimal condition of PG25 cooling fluid (75% Deionized Water + 25% Propylene Glycol) used in liquid cooling applications. It breaks down the fluid management process into Real-time, Monitoring, Periodic, and Maintenance phases, clearly outlining the essential metrics (temperature, pressure, flow rate, concentration, pH) and target values for each stage.
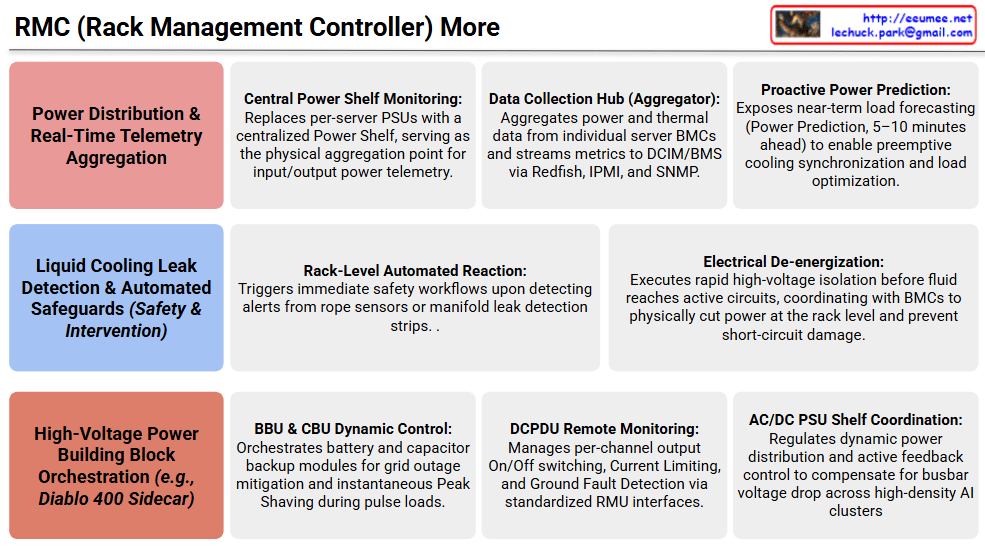
This infographic, titled “RMC (Rack Management Controller) More,” details the three advanced core roles and operational capabilities of the RMC (or RMU) in high-density AI data center environments across three color-coded horizontal rows.
1. Power Distribution & Real-Time Telemetry Aggregation
The top pink row covers IT-domain centralized power management and data aggregation.
Central Power Shelf Monitoring: Replaces per-server PSUs with a centralized Power Shelf, serving as the physical aggregation point for input/output power telemetry.
Data Collection Hub (Aggregator): Aggregates power and thermal data from individual server BMCs and streams metrics to DCIM/BMS via Redfish, IPMI, and SNMP.
Proactive Power Prediction: Exposes near-term load forecasting (Power Prediction, 5–10 minutes ahead) to enable preemptive cooling synchronization and load optimization.
The middle green row outlines safety workflows and physical intervention capabilities for liquid cooling architectures.
Rack-Level Automated Reaction: Triggers immediate safety workflows upon detecting alerts from rope sensors or manifold leak detection strips.
Electrical De-energization: Executes rapid high-voltage isolation before fluid reaches active circuits, coordinating with BMCs to physically cut power at the rack level and prevent short-circuit damage.
3. High-Voltage Power Building Block Orchestration (e.g., Diablo 400 Sidecar)
The bottom blue row highlights hardware-level orchestration across high-voltage power components.
BBU & CBU Dynamic Control: Orchestrates battery and capacitor backup modules for grid outage mitigation and instantaneous Peak Shaving during pulse loads.
DCPDU Remote Monitoring: Manages per-channel output On/Off switching, Current Limiting, and Ground Fault Detection via standardized RMU interfaces.
AC/DC PSU Shelf Coordination: Regulates dynamic power distribution and active feedback control to compensate for busbar voltage drop across high-density AI clusters.
Summary
This infographic highlights the evolution of the RMC from a passive monitoring unit to an active, rack-scale brain. It operates as an IT telemetry neural hub aggregating real-time BMC data and power forecasts, a safety intervention authority enforcing electrical de-energization during liquid cooling leaks, and a power orchestrator managing complex building blocks (BBU, CBU, DCPDU, PSU) in next-generation high-voltage architectures like Diablo 400.
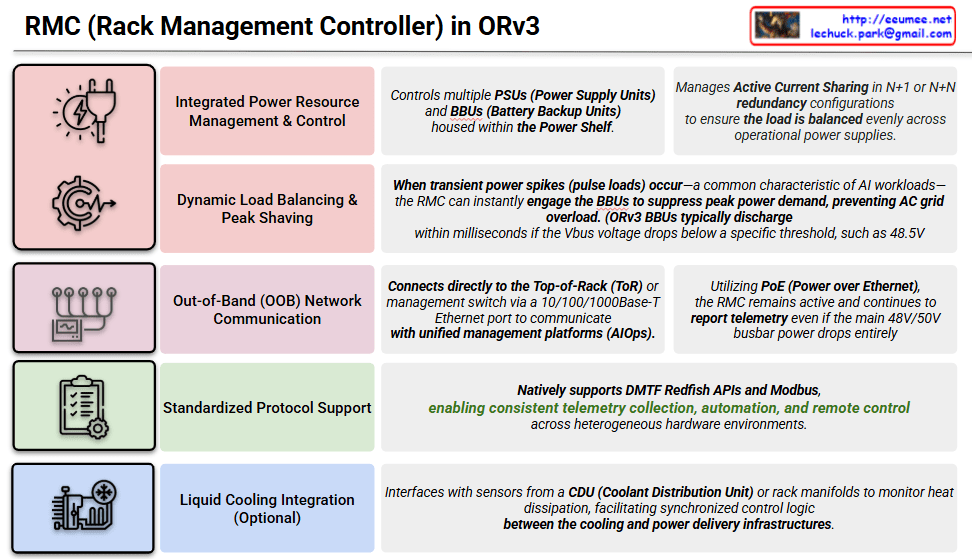
This image is an infographic that intuitively explains the five key functions of the RMC (Rack Management Controller) defined in the Open Compute Project (OCP) Open Rack v3 (ORv3) specification. Each function is categorized into a color-coded row, featuring a representative icon and title on the left, paired with a detailed description on the right.
1. Integrated Power Resource Management & Control
Icon: A gear with a power plug and a lightning bolt.
Detailed Description: This function controls multiple PSUs (Power Supply Units) and BBUs (Battery Backup Units) housed within the Power Shelf. It manages Active Current Sharing in N+1 or N+N redundancy configurations to ensure the load is balanced evenly across operational power supplies. This optimizes power efficiency and reliability.
2. Dynamic Load Balancing & Peak Shaving
Icon: A gear with a wave graph.
Detailed Description: When transient power spikes (pulse loads) occur—a common characteristic of AI workloads—the RMC can instantly engage the BBUs to suppress peak power demand, preventing AC grid overload. Note that ORv3 BBUs typically discharge within milliseconds if the Vbus voltage drops below a specific threshold, such as 48.5V.
3. Out-of-Band (OOB) Network Communication
Icon: A metering device with multiple cable connections.
Detailed Description: It connects directly to the Top-of-Rack (ToR) or management switch via a 10/100/1000Base-T Ethernet port to communicate with unified management platforms (AIOps). Utilizing PoE (Power over Ethernet), the RMC remains active and continues to report telemetry even if the main 48V/50V busbar power drops entirely, ensuring high availability of management functions.
4. Standardized Protocol Support
Icon: A clipboard with a checklist and a gear.
Detailed Description: The RMC natively supports DMTF Redfish APIs and Modbus. This enables consistent telemetry collection, automation, and remote control across heterogeneous hardware environments, facilitating interoperability in multi-vendor data centers.
5. Liquid Cooling Integration (Optional)
Icon: A gear shaped like a cooling system with piping and a fan.
Detailed Description: This optional feature interfaces with sensors from a CDU (Coolant Distribution Unit) or rack manifolds to monitor heat dissipation. This facilitates synchronized control logic between the cooling and power delivery infrastructures for holistic rack management.
Summary
This image illustrates the five core values of the RMC, a critical component of the OCP ORv3 standard rack. The RMC provides essential capabilities for advanced data center infrastructure management, including maximizing power efficiency, handling sudden power spikes typical of AI workloads, and maintaining management operations via PoE even during main power failures. Additionally, it addresses the complex demands of modern data centers through standardized protocol support and optional integration with liquid cooling systems.
This infographic provides a clear at-a-glance comparison of the changing cost structures between Traditional Data Centers and Artificial Intelligence (AI) Data Centers. It visualizes how the focus of costs for both building (CAPEX) and operating (OPEX) data centers is dramatically shifting in response to technological advancements and the explosion in AI demand.This infographic provides a clear at-a-glance comparison of the changing cost structures between Traditional Data Centers and Artificial Intelligence (AI) Data Centers. It visualizes how the focus of costs for both building (CAPEX) and operating (OPEX) data centers is dramatically shifting in response to technological advancements and the explosion in AI demand.
1. Overall Image Structure The image is split vertically down the middle, representing the ‘Traditional Data Center (Traditional DC)’ on the left and the ‘AI Data Center (AI DC)’ on the right. Each side is majorly categorized into ‘1. Build-out Costs (CAPEX)’, ‘2. Operating Costs (OPEX)’, and a bottom section dedicated to ‘Efficiency Focus’. Notably, the AI Data Center side features additional blocks for ‘Service & Damage Costs’ and ‘Risk Reduction’.
2. Detailed Breakdown
Comparison of Build-out Costs (CAPEX):
Traditional Data Center: Focuses on the general construction process of acquiring spacious Land (Terrain), building a standard structure (Building), and installing Power Infrastructure (Electrical Systems) and HVAC Systems (Cooling Systems).
AI Data Center: Shifts focus from simple construction to technology-intensive infrastructure. Instead of standard racks, High-Density Racks (HPC Racks) are densely packed, and to manage the immense heat, Direct Liquid Cooling (DLC) Systems are depicted as essential, replacing traditional air cooling. The visual density of the server cluster standing on the terrain is much higher.
Comparison of Operating Costs (OPEX):
Traditional Data Center: Shows a gradual and moderate increasing trend over time for all OPEX categories: Power (Energy Costs), Staff (Labor Costs), Maintenance (Facility Maintenance), and Water (Water Costs). There is a relative balance among the four categories.
AI Data Center: Completely breaks from the traditional trend. It shows an overwhelming and explosive increase in Power (Massive Energy Increase) costs, depicted as a gigantic orange-to-yellow bar chart. The text next to the chart explicitly states, “IT power is mandatory, hard to reduce.” Compared to the power costs, the costs for staff, maintenance, and water are displayed as relatively negligible. A flame shape is added next to the power icon, hinting at high heat generation.
AI Data Center Unique Elements: New Risks and Solutions
Service & Damage Costs: Visualizes how “GPU Server Damages” and “AI Service Interruptions”, which were not major OPEX categories in traditional data centers, have emerged as enormous damage costs in AI DCs. This is depicted through an exploding server rack and shattered block icons.
Risk Reduction: Presents “Staff Efficiency” as the critical key to reducing these fatal risks. It shows professional staff monitoring dashboards, with arrows connecting this efficient operation to solving problems like cooling inefficiency and ultimately preventing risks.
Efficiency Focus: The bottom section emphasizes ‘Cooling Energy Efficiency’ (smart sensors, airflow optimization) and ‘Operational Staff Efficiency’ (automation, expert tools) as common challenges for both types of data centers. On the AI DC side, this staff efficiency is re-emphasized as a critical driver for power management and risk reduction.
Summary
The core message of this infographic is the fundamental revolution in cost structures brought about by the transition to AI Data Centers. While Traditional Data Centers focused on the physical construction costs of land and buildings and a balance among various operational items, AI Data Centers see CAPEX concentrated in high-density and liquid cooling infrastructure, and at the operational stage, overwhelming power costs account for most of the OPEX. Furthermore, high-ticket damage costs like GPU server failures or service interruptions, which were negligible in traditional centers, have emerged as major new OPEX items, showing that predicting and preventing these fatal risks through expert operating staff has become the most important efficiency challenge, going beyond just saving electricity.The core message of this infographic is the fundamental revolution in cost structures brought about by the transition to AI Data Centers. While Traditional Data Centers focused on the physical construction costs of land and buildings and a balance among various operational items, AI Data Centers see CAPEX concentrated in high-density and liquid cooling infrastructure, and at the operational stage, overwhelming power costs account for most of the OPEX. Furthermore, high-ticket damage costs like GPU server failures or service interruptions, which were negligible in traditional centers, have emerged as major new OPEX items, showing that predicting and preventing these fatal risks through expert operating staff has become the most important efficiency challenge, going beyond just saving electricity.
This diagram illustrates the closed-loop architecture of the Linux kernel’s thermal management subsystem, specifically detailing how it handles heavy AI workloads by coordinating both internal server hardware and external datacenter cooling infrastructure. The process is broken down into six sequential stages:
Stage 1: Workload InitializationWhen a high-intensity AI or LLM task is dispatched, it causes an immediate surge in electrical current across the hardware transistors. As a direct physical effect, the internal die temperature of the accelerator spikes within mere milliseconds.
Stage 2: Polling & SensingTo monitor this heat, the kernel utilizes hardware monitoring (hwmon) and ACPI drivers to continuously read data from internal Digital Thermal Sensors. This raw temperature data is mapped into an abstracted “Thermal Zone” and constantly compared against predefined safety thresholds known as “Trip Points.”
Stage 3: Trip Point & Governor ActivationIf the temperature crosses a specific threshold (such as a Warning Trip Point), it triggers a Thermal Governor, like the Intelligent Power Allocation (IPA) or Step Wise governor. This governor uses PID control algorithms to calculate a safe “Thermal Budget” that the hardware can sustain without damage.
Stage 4: Passive & Active CoolingBased on the calculated budget, the kernel initiates local mitigation through registered Cooling Devices. Active cooling involves instantly cranking up the internal server fan RPMs. Passive cooling relies on Dynamic Voltage and Frequency Scaling (DVFS), interacting with cpufreq to throttle clock speeds and lower voltages, thereby suppressing heat generation at the silicon level.
Stage 5: Infrastructure Telemetry SyncIf local cooling is insufficient to handle the load, the kernel exports real-time thermal telemetry via sysfs and IPMI/Redfish agents. The external datacenter infrastructure—specifically the Coolant Distribution Unit (CDU) or Chiller—receives this data and dynamically increases the liquid coolant flow rate directed to that specific server rack. ( Kernel works with BMC & DCIM/BMS.)
Stage 6: Thermal Equilibrium / EmergencyThe system continuously evaluates the outcome of these mitigations. Under normal conditions, the cooling capacity matches the heat generation, achieving a state of “Thermal Equilibrium” that allows the workload to run continuously and stably. However, if cooling fails and a Critical Trip Point is breached, the kernel immediately triggers an Emergency Shutdown to protect the hardware from permanent damage.
Summary
The Linux kernel continuously monitors hardware temperatures and maps them to virtual Thermal Zones to detect sudden heat spikes caused by heavy AI workloads.
Upon reaching safety thresholds, the kernel’s Thermal Governor simultaneously throttles CPU/GPU performance (local) and signals the datacenter’s CDU to increase liquid coolant flow (global).
This closed-loop system ultimately aims to achieve thermal equilibrium for stable high-performance computing, or safely halts the system if critical failure conditions are met.


 Lechuck Park