Silence Data Corruption

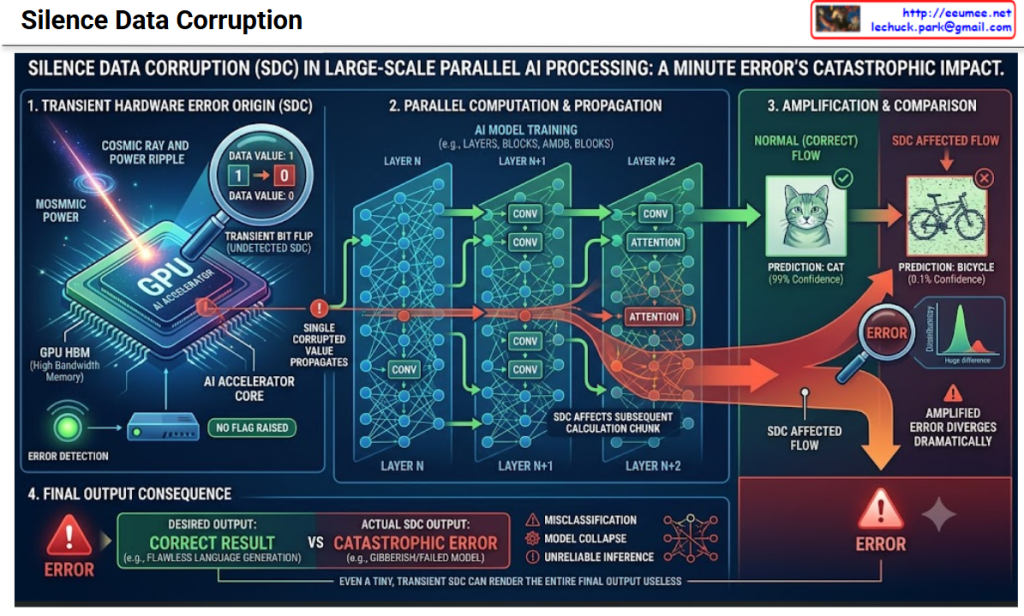
This infographic diagram illustrates the lifecycle of a single, minute, and transient error, showing how it goes undetected and exponentially amplifies through the layers of an AI model to cause a catastrophic final failure.

Step-by-Step Breakdown of the Diagram

The diagram is organized horizontally into four sequential stages, moving from the physical hardware level to the final AI application output.

Step 1: Transient Hardware Error Origin (SDC)

The leftmost section focuses on the physical cause of the error.

  • Context: We see a stylized GPU AI Accelerator and GPU HBM (High Bandwidth Memory), which represent the hardware infrastructure.
  • The Cause: An external physical event strikes the chip.
    • COSMIC RAY AND POWER RIPPLE: This represents high-energy particles from space or a minor voltage instability in the power supply. These events can deliver a tiny electrical charge to a critical component.
  • The Immediate Effect (Zoom in): This tiny charge hits a memory cell. As seen in the magnified view, it causes a TRANSIENT BIT FLIP (UNDETECTED SDC), instantly changing a data bit from 1 to 0.
  • The Essence of SDC (Red ‘!’): Crucially, the ERROR DETECTION sensor incorrectly assesses the situation, showing a green light and labeling it ‘NO FLAG RAISED.’ The system continues, unaware that the data has been corrupted. This is the ‘Silent’ aspect of SDC.

Step 2: Parallel Computation & Propagation

The central section illustrates how the corrupted value enters the AI model.

  • Structure: We see an AI MODEL TRAINING flow, distributed across massive parallel blocks (e.g., LAYERS, BLOCKS, AMDB, CONV, ATTENTION) like LAYER N, LAYER N+1, and LAYER N+2.
  • The Propagation Path:
    • Green Arrows (Normal Flow): Most of the data processed across the millions of nodes is correct.
    • Orange Arrows (SDC Affected Flow): The single flipped bit affects a small chunk of calculation in LAYER N. The diagram shows how this corruption (SDC AFFECTS SUBSEQUENT CALCULATION CHUNK) is passed on to LAYER N+1 and LAYER N+2, infecting and merging with a growing number of subsequent nodes as it progresses.

Step 3: Amplification & Comparison

The third section provides a striking side-by-side comparison of the final processed state.

  • Comparison:
    • Normal Flow: Had the error not occurred, the model would have made a PREDICTION: CAT (99% Confidence) with a high degree of accuracy and certainty.
    • SDC Affected Flow: The minute error, after cascading through thousands of parallel nodes and multiple layers, has been dramatically amplified. The model now makes a complete misclassification, with a non-sensical and low-confidence PREDICTION: BICYCLE (0.1% Confidence).
  • Graph (Error Divergence): The small SDC input (seen earlier as the single bit flip) has caused the entire output distribution to AMPLIFIED ERROR DIVERGES DRAMATICALLY.

Step 4: Final Output Consequence

The final, largest section at the bottom summarizes the real-world impact.

  • The Contrast:
    • Desired Output: The perfect outcome, like a flawless language generation or a critical diagnostic result (DESIRED OUTPUT: CORRECT RESULT).
    • Actual SDC Output: What actually occurs due to the SDC (ACTUAL SDC OUTPUT: CATASTROPHIC ERROR). This is not just a slightly wrong answer; it can be complete gibberish, a crashed model, or a dangerously incorrect real-world action.
  • Summary of Impact: The diagram lists the core failures: MISCLASSIFICATION, MODEL COLLAPSE, and UNRELIABLE INFERENCE, rendering the entire output useless.

Conclusion: Why SDC is a Catastrophic Danger

The ultimate takeaway, as stated in the title and the final caption, is that EVEN A TINY, TRANSIENT SDC CAN RENDER THE ENTIRE FINAL OUTPUT USELESS. In large-scale, massive parallel AI processing, a single, undetectable bit flip can cascade and multiply, causing a model that looks perfect to fail catastrophically.

#SilentDataCorruption #SDC #AI #MachineLearning #DeepLearning #LargeScaleAI #DistributedComputing #ParallelProcessing #HighPerformanceComputing #HPC

With Gemini (inc. infographic)

The Difference, The Start of Computing

The provided image is an infographic that visually compares the operational mechanisms of traditional computing and modern Artificial Intelligence (AI). The addition of the keywords “Deterministic” and “Probabilistic” at the bottom perfectly summarizes the core difference between these two paradigms.

1. The World of Deterministic Computing

This section explains the traditional computer mechanism, which consistently produces the same output based on predefined, rigid rules.

  • Step 1: The Foundation of Computing
    • Visuals: An intuitive ON/OFF power switch and an illuminated lightbulb.
    • Meaning: Computing begins with the fundamental Binary System, which distinguishes between two clear states: 0 (OFF) and 1 (ON).
  • Step 2: Classical Processing
    • Visuals: Logic gate symbols (AND, OR, NOT) interlocked with gears.
    • Meaning: It illustrates how conventional computers process binary inputs mechanically by applying predefined human rules and logical operations (Rule-based Processing).

2. The Paradigm Shift

  • Step 3: Questioning and Transition
    • Visuals: A brain integrated with electronic circuits, a computer, a robot icon, and a large question mark in the center.
    • Meaning: This represents a technological leap, asking the core question: “How does AI fundamentally differ from classical rule-based computing?”

3. The World of Probabilistic Computing

This section explains AI’s mechanism, which relies on data statistics and probabilities to self-learn and generate flexible outcomes.

  • Step 4: AI & LLMs (Large Language Models)
    • Visuals: A cloud containing clustered data nodes of various colors and statistical charts showing probabilities like 85% and 60%.
    • Meaning: Instead of making strict 0/1 distinctions, AI groups massive amounts of data into Clusters based on statistical Probabilities.
  • Step 5: AI Processing Mechanism
    • Visuals: A complex Artificial Neural Network structure combined with processing gears, leading to output files labeled “Generated” (images) and “Classified” (documents).
    • Meaning: Without relying on explicit human programming, AI autonomously learns weights and internal patterns (Self-Learning) from these probabilistic clusters to create new content or classify data.

📌 Summary

This infographic acts as a visual map showcasing the evolution of computing history from the era of “Deterministic Rules” to the era of “Probabilistic Self-Learning.”

It intuitively conveys the core difference: while early computers relied on clear 0/1 distinctions and explicit human-written code, modern AI (like LLMs) groups vast amounts of data by probability and autonomously learns internal patterns and weights to deliver flexible, creative, and highly advanced results.

#ArtificialIntelligence #AIComputing #HistoryOfComputing #Deterministic #Probabilistic #LLM #MachineLearning #TechInfographic #TechTrends #TechExplanation

With Gemini

PI-DLinear(Physics-Informed DLinear)


PI-DLinear (Physics-Informed DLinear)

The provided image is a structured infographic slide titled “PI-DLinear (Physics-Informed DLinear).” It visually organizes the model’s core features into four distinct, color-coded columns:

1. Physics-Informed Loss Function (Blue Column)

This section focuses on how physical laws are integrated into the model’s learning process.

  • #Hybrid Objective: It explains that the model integrates data fidelity with physical governing equations.
  • #Physical Constraints: It states that the model penalizes thermodynamically impossible predictions (e.g., violating energy conservation or heat transfer laws).
  • #Mathematical Formulation: It provides the core equation for the loss function: Ltotal = Ldata + Lphysic.

2. Harness Engineering & Safe Control (Purple Column)

This column emphasizes the safety and control aspects for AI operations.

  • #Operational Scaffolding: It describes the model as acting as a strict guardrail for autonomous AI-driven agents.
  • #Boundary Adherence: It guarantees that forecasts and control actions remain within safe, predefined physical boundaries, completely preventing critical hallucinations.

3. Robust OOD (Out-of-Distribution) Extrapolation (Green Column)

This section highlights the model’s reliability during unexpected scenarios.

  • #Anomaly Resilience: It notes that the model maintains highly rational trajectories during unprecedented emergencies (like sudden chiller failures) where pure data-driven models would collapse.
  • #Predictive Diagnostics: It points out that the model delivers accurate fault propagation forecasting, which directly enables a drastic reduction in MTTR (Mean Time To Repair).

4. Structural Simplicity & Computational Efficiency (Red Column)

The final column outlines the architectural benefits of the model.

  • #Linear Decomposition: It explains that the model splits time-series into trend and remainder components using highly interpretable linear layers, bypassing heavy attention mechanisms.
  • #High-Throughput Inference: It emphasizes that the model is exceptionally lightweight and fast, making it optimal for real-time DevOps, edge deployments, and multi-center scaling.

Summary

The infographic effectively presents PI-DLinear as a powerful hybrid model for time-series forecasting. By combining the computational speed and simplicity of linear architectures with the strict mathematical boundaries of physical laws, it creates a highly reliable AI tool. It is specifically designed to handle unexpected anomalies safely and efficiently, making it ideal for critical infrastructure management where AI hallucinations cannot be tolerated.

#PIDLinear #PhysicsInformedAI #TimeSeriesForecasting #AIOps #MachineLearning #SafeAI #PredictiveMaintenance #HarnessEngineering

With Gemini

PIML(Physics-Informed Machine Learning)

PIML (Physics-Informed Machine Learning) Explained

This diagram illustrates how PIML (Physics-Informed Machine Learning) combines the strengths of physics-based models and data-driven machine learning to create a more powerful and reliable approach.


1. Top: Physics (White-box Model)

  • Definition: These are models where the underlying principles are fully explained by mathematical equations, such as Computational Fluid Dynamics (CFD) or thermodynamic simulations.
  • Characteristics:
    • High Precision: They are very accurate because they are based on fundamental physical laws.
    • High Resource Cost: They are computationally intensive, requiring significant processing power and time.
    • Lack of Real-time Processing: Complex simulations are difficult to use for real-time prediction or control.

2. Middle: Machine Learning (Black-box Model)

  • Definition: These models rely solely on large amounts of training data to find correlations and make predictions, without using underlying physical principles.
  • Characteristics:
    • Data-dependent: Their performance depends heavily on the quality and quantity of the data they are trained on.
    • Edge-case Risks: In situations not covered by the data (edge cases), they can make illogical predictions that violate physical laws.
    • Hard to Validate: It is difficult to understand their internal workings, making it challenging to verify the reliability of their results.

3. Bottom: Physics-Informed Machine Learning (Grey-box Approach)

  • Definition: This approach integrates the knowledge of physical laws (equations) into a machine learning model as mathematical constraints, combining the best of both worlds.
  • Benefits:
    • Overcome Cold Start Problem: By using existing knowledge like mathematical constraints, PIML can function even when training data is scarce, effectively addressing the initial (“Cold Start”) state.
    • High Efficiency: Instead of learning physics from scratch, the ML model focuses on learning only the residuals (real-world deviations) between the physics-based model and actual data. This makes learning faster and more efficient with less data.
    • Safety Guardrails: The integrated physics framework acts as a set of safety guardrails, providing constraints that prevent the model from making physically impossible predictions (“Hallucinations”) and bounding errors to ensure safety.

#AI #PIML #MachineLearning #Physics #HybridAI #DataScience #ExplainableAI #XAI #ComputationalPhysics #Simulation

with Gemini

Hybrid Analysis for Autonomous Operation (1)


Hybrid Analysis for Autonomous Operation (1)

This framework illustrates a holistic approach to autonomous systems, integrating human expertise, physical laws, and AI to ensure safe and efficient real-world execution.

1. Five Core Modules (Top Layer)

  • Domain Knowledge: Codifies decades of operator expertise and maintenance manuals into digital logic.
  • Data-driven ML: Detects hidden patterns in massive sensor data that go beyond human perception.
  • Physics Rule: Enforces immutable engineering constraints (such as thermodynamics or fluid dynamics) to ground the AI in reality.
  • Control & Actuation: Injects optimized decisions directly into PLC / DCS (Distributed Control Systems) for real-world execution.
  • Reliability & Governance: Manages the entire pipeline to ensure 24/7 uninterrupted autonomous operation.

2. Integrated Value Drivers (Bottom Layer)

These modules work in synergy to create three essential “Guides” for the system:

  • Experience Guide: Combines domain expertise with ML to handle edge cases and provide high-quality ground-truth labels for model training.
  • Facility Guide: Acts as a safety net by combining ML predictions with physical rules. It predicts Remaining Useful Life (RUL) while blocking outputs that exceed equipment design limits.
  • The Final Guardrail: Bridges the gap between IT (Analysis) and OT (Operations). It prevents model drift and ensures an instant manual override (Failsafe) is always available.

3. Key Takeaways

The architecture centers on a “Control Trigger” that converts digital insights into physical action. By anchoring machine learning with physical laws and human experience, the system achieves a level of reliability required for mission-critical environments like data centers or industrial plants.

#AutonomousOperations #IndustrialAI #MachineLearning #SmartFactory #DataCenterManagement #PredictiveMaintenance #ControlSystems #OTSecurity #AIOps #HybridAI

With Gemini

DC Data Service Model


DC Data Service Model Overview

This diagram outlines the evolutionary roadmap of a Data Center (DC) Data Service Model. It illustrates how data center operations advance from basic monitoring to a highly autonomous, AI-driven environment. The model is structured across three functional pillars—Data, View, and Analysis—and progresses through three key service tiers.

Here is a breakdown of the evolving stages:

1. Basic Tier (The Foundation)

This is the foundational level, focusing on essential monitoring and billing.

  • Data: It begins with collecting Server Room Data via APIs.
  • View: Operators use a Server Room 2D View to track basic statuses like room layouts, rack placement, power consumption, and temperatures.
  • Analysis: The collected data is used to generate a basic Usage Report, primarily for customer billing.

2. Enhanced Tier (Real-time & Expanded Scope)

This tier broadens the monitoring scope and provides deeper operational insights.

  • Data: Data collection is expanded beyond the server room to include the Common Facility (Data Extension).
  • View: The user interface upgrades to a dynamic Dashboard that displays real-time operational trends.
  • Analysis: Reporting evolves into an Analysis Report, designed to extract deeper insights and improve overall service value.

3. The Bridge: Data Quality Up

Before transitioning to the ultimate AI-driven tier, there is a critical prerequisite layer. To effectively utilize AI, the system must secure data of High Precision & High Resolution. High-quality data is the fuel for the advanced services that follow.

4. Premium Tier (AI Agent as the Ultimate Orchestrator)

This is the ultimate goal of the model. The updated diagram highlights a clear, sequential flow where each advanced technology builds upon the last, culminating in a comprehensive AI Agent Service:

  • AI/ML Service: The high-quality data is first processed here to automatically detect anomalies and calculate optimizations (e.g., maximizing cooling and power efficiency).
  • Digital Twin: The analytical insights from the AI/ML layer are then integrated into a Digital Twin—a virtual, highly accurate replica of the physical data center used for real-time simulation and spatial monitoring.
  • AI Agent Service: This is the final and most critical layer. The AI Agent does not just sit alongside the other tools; it acts as the central brain. Through this final Agent Service, the capabilities of all preceding services are expanded and put into action. By leveraging the predictive power of the AI/ML models and the comprehensive visibility of the Digital Twin, the AI Agent can autonomously manage, resolve issues, and optimize the data center, maximizing the ultimate value of the entire data pipeline.

#DataCenter #DCIM #AIAgent #DigitalTwin #MachineLearning #ITOperations #TechInfrastructure #FutureOfTech #SmartDataCenter

AI Data Center Operation Platform Layer

The provided image illustrates the architecture of an AI DataCenter Operation Platform, mapping it out in five distinct stages from the physical foundation layer up to the top-tier artificial intelligence application layer.

The upward-pointing arrows depict the flow of raw data collected from the infrastructure, demonstrating the system’s upward evolution and how the data is ultimately utilized intelligently by AI.

Here is the breakdown of the core roles and components of each layer:

  • Layer 1: Facility & Physical Edge
    • Role: The foundational layer responsible for collecting data and controlling the physical infrastructure equipment of the data center, such as power and cooling systems.
    • Key Elements: High-Frequency Data Sampling, Precision Time Synchronization (Precision NTP/PTP), Standard Interfaces, and Zero-Latency Control & Redundancy. This layer focuses on extracting data and issuing control commands to hardware with extreme speed and accuracy.
  • Layer 2: Network Fabric
    • Role: The neural network of the data center. It reliably and rapidly transmits the massive amounts of collected data to the upper platforms without bottlenecks.
    • Key Elements: Non-blocking Leaf-Spine Architecture, Ultra-High-Speed Telemetry, and Integrated Security & NMS (Network Management System) Monitoring. These elements work together to efficiently handle large-scale traffic.
  • Layer 3: Control & Management (Integrated Control)
    • Role: The layer that integrates and normalizes heterogeneous data streaming in from various facilities and solutions to execute practical operations and management.
    • Key Elements: Operational Solution Convergence, Heterogeneous Data Normalization, Traffic-based Anomaly Detection, and Monitoring-Based Commissioning (MBCx). It acts as a critical gateway to identify infrastructure issues early and improve overall operational efficiency.
  • Layer 4: Analysis Platform
    • Role: The stage where refined data is stored, analyzed, and visualized, allowing administrators to intuitively grasp the system’s status at a glance.
    • Key Elements: Utilizes a High-Performance Time-Series Database (TSDB) to record state changes over time and provides Customized Views/Dashboards for tailored monitoring.
  • Layer 5: Intelligent Expansion
    • Role: The ultimate destination of this platform. It is the highest layer where AI autonomously operates and optimizes the data center, leveraging the well-organized data provided by the lower layers.
    • Key Elements: Generative AI Agent (LLM+RAG), Digital Twin technology, ML-based Automated Power/Cooling Control, and Intelligent Report Generation.

This blueprint clearly demonstrates the overall solution architecture: precisely collecting and transmitting raw data from hardware facilities (Layers 1-2), standardizing, storing, and analyzing that data (Layers 3-4), and ultimately achieving advanced, autonomous operations through intelligent, automatic control of power and cooling systems via a Generative AI Agent (Layer 5).


#AIDataCenter #AIOps #DataCenterManagement #GenerativeAI #DigitalTwin #NetworkFabric #ITInfrastructure #SmartDataCenter #MachineLearning #TechArchitecture

With Gemini