Traditional vs AI Data Center
This infographic provides a clear at-a-glance comparison of the changing cost structures between Traditional Data Centers and Artificial Intelligence (AI) Data Centers. It visualizes how the focus of costs for both building (CAPEX) and operating (OPEX) data centers is dramatically shifting in response to technological advancements and the explosion in AI demand.This infographic provides a clear at-a-glance comparison of the changing cost structures between Traditional Data Centers and Artificial Intelligence (AI) Data Centers. It visualizes how the focus of costs for both building (CAPEX) and operating (OPEX) data centers is dramatically shifting in response to technological advancements and the explosion in AI demand.
1. Overall Image Structure The image is split vertically down the middle, representing the ‘Traditional Data Center (Traditional DC)’ on the left and the ‘AI Data Center (AI DC)’ on the right. Each side is majorly categorized into ‘1. Build-out Costs (CAPEX)’, ‘2. Operating Costs (OPEX)’, and a bottom section dedicated to ‘Efficiency Focus’. Notably, the AI Data Center side features additional blocks for ‘Service & Damage Costs’ and ‘Risk Reduction’.
2. Detailed Breakdown
- Comparison of Build-out Costs (CAPEX):
- Traditional Data Center: Focuses on the general construction process of acquiring spacious Land (Terrain), building a standard structure (Building), and installing Power Infrastructure (Electrical Systems) and HVAC Systems (Cooling Systems).
- AI Data Center: Shifts focus from simple construction to technology-intensive infrastructure. Instead of standard racks, High-Density Racks (HPC Racks) are densely packed, and to manage the immense heat, Direct Liquid Cooling (DLC) Systems are depicted as essential, replacing traditional air cooling. The visual density of the server cluster standing on the terrain is much higher.
- Comparison of Operating Costs (OPEX):
- Traditional Data Center: Shows a gradual and moderate increasing trend over time for all OPEX categories: Power (Energy Costs), Staff (Labor Costs), Maintenance (Facility Maintenance), and Water (Water Costs). There is a relative balance among the four categories.
- AI Data Center: Completely breaks from the traditional trend. It shows an overwhelming and explosive increase in Power (Massive Energy Increase) costs, depicted as a gigantic orange-to-yellow bar chart. The text next to the chart explicitly states, “IT power is mandatory, hard to reduce.” Compared to the power costs, the costs for staff, maintenance, and water are displayed as relatively negligible. A flame shape is added next to the power icon, hinting at high heat generation.
- AI Data Center Unique Elements: New Risks and Solutions
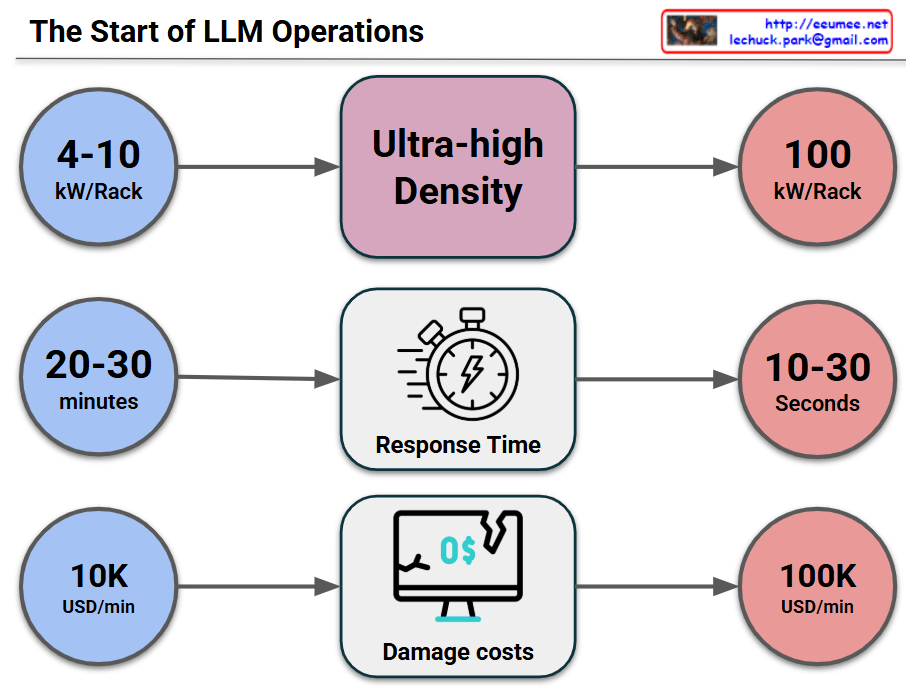
- Service & Damage Costs: Visualizes how “GPU Server Damages” and “AI Service Interruptions”, which were not major OPEX categories in traditional data centers, have emerged as enormous damage costs in AI DCs. This is depicted through an exploding server rack and shattered block icons.
- Risk Reduction: Presents “Staff Efficiency” as the critical key to reducing these fatal risks. It shows professional staff monitoring dashboards, with arrows connecting this efficient operation to solving problems like cooling inefficiency and ultimately preventing risks.
- Efficiency Focus: The bottom section emphasizes ‘Cooling Energy Efficiency’ (smart sensors, airflow optimization) and ‘Operational Staff Efficiency’ (automation, expert tools) as common challenges for both types of data centers. On the AI DC side, this staff efficiency is re-emphasized as a critical driver for power management and risk reduction.
Summary
The core message of this infographic is the fundamental revolution in cost structures brought about by the transition to AI Data Centers. While Traditional Data Centers focused on the physical construction costs of land and buildings and a balance among various operational items, AI Data Centers see CAPEX concentrated in high-density and liquid cooling infrastructure, and at the operational stage, overwhelming power costs account for most of the OPEX. Furthermore, high-ticket damage costs like GPU server failures or service interruptions, which were negligible in traditional centers, have emerged as major new OPEX items, showing that predicting and preventing these fatal risks through expert operating staff has become the most important efficiency challenge, going beyond just saving electricity.The core message of this infographic is the fundamental revolution in cost structures brought about by the transition to AI Data Centers. While Traditional Data Centers focused on the physical construction costs of land and buildings and a balance among various operational items, AI Data Centers see CAPEX concentrated in high-density and liquid cooling infrastructure, and at the operational stage, overwhelming power costs account for most of the OPEX. Furthermore, high-ticket damage costs like GPU server failures or service interruptions, which were negligible in traditional centers, have emerged as major new OPEX items, showing that predicting and preventing these fatal risks through expert operating staff has become the most important efficiency challenge, going beyond just saving electricity.
#DataCenter #DataCenterCost #AIDataCenter #HighPerformanceComputing #HPC #CAPEX #OPEX #PowerCost #LiquidCooling #GPU #InfrastructureInvestment #DataCenterOperations #RiskManagement
With Gemini