Optimizing Customer AI GPU Services and Establishing Continuous Improvement via a Data-Driven Feedback Loop
This process diagram provides a logical roadmap for a strategic transformation. It illustrates the shift from conventional, manual operations to a data-driven, intelligent operating system. The ultimate goal is to protect customer AI infrastructure investments and maximize operational efficiency by embedding continuous improvement into new AI Data Center facilities.
1. Starting Point: Defining Customer Value and Goals (Customer AI GPU Service & CAPEX/OPEX Protection)
The beginning and final goal of the process are encased in the purple hexagon panel. It prioritizes maximizing the value of the ‘AI GPU service’ provided to the customer while simultaneously ‘protecting’ the underlying Capital Expenditure (CAPEX) and Operating Expenditure (OPEX). The icons (people, robot, and money) represent business value and the importance of cost.
2. Paradigm Shift: Modernizing Operations (Automation & People -> Digital/AI)
The next step, ‘AUTOMATION’, represents a bold paradigm shift away from manual, people-centric operational methods toward a digital and AI-based automated system. Gears and a robot icon represent the technical core of this change.
3. Core Methodology: The Data-Driven Intelligent Hub (Hub Working with Data)
To enable automation, all the vast data streaming from infrastructure and equipment is collected and processed in a single location: the ‘HUB WORKING WITH DATA’. A server rack icon signifies that this hub is the nerve center of data.
4. The Three Core Resulting Capabilities (The Three Pillars of Result)
As ‘working with data’ becomes established, three distinct and interrelated capabilities (or outputs) are derived. They independently support the new facility while remaining connected:
High-Quality Data: Refined and accumulated data forms the foundation for accurate predictions and analytics. (Green, checkmark icon)
Automated Process: Standardized and intelligent automation workflows are built based on high-quality data. (Purple, robot arm icon)
Operations Expert: A new type of expert with the ability to interpret systems from a data perspective and offer insights is essential. (Orange, expert icon)
5. Integration & Destination: New AI DC Facility & Closed Loop (New AI DC Facility & Continuous Improvement)
These three capabilities (Data, Process, Expert) are synthesized and converge in the teal panel labeled ‘NEW AI DC FACILITY’. This signifies that the derived capabilities have been perfectly integrated into the actual high-density, high-power equipment of the new AI Data Center.
A circular feedback loop on the far right illustrates how operational experience from the new facility is fed back into the data hub. This loop, coupled with the text ‘CONTINUOUS IMPROVEMENT’, explicitly states that this system is not a one-time build but a continuous, evolving virtuous cycle.
Summary:
This diagram illustrates a strategic process aimed at protecting customer AI assets (GPUs) and optimizing operational costs. It details the transformation from people-centric, manual operations to a data and AI-driven intelligent hub, generating key outputs (high-quality data, automated processes, and experts). These outputs are then integrated into a new AI data center, creating a continuous improvement feedback loop to maximize value.
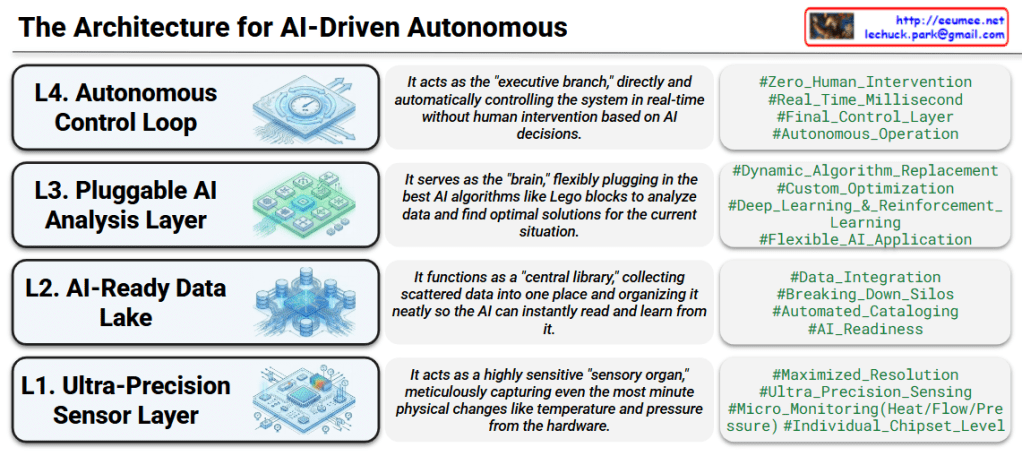
This slide effectively illustrates a complete, four-tier architecture required to build a fully autonomous AI system. Let’s walk through the framework from the foundation (data collection) to the top (autonomous execution):
L1. Ultra-Precision Sensor Layer (The “Sensory Organ”)This foundational layer is all about high-resolution data capture. Acting as the system’s highly sensitive sensory organs, it meticulously monitors minute physical changes—such as heat, flow, and pressure—right down to the individual chipset level.
L2. AI-Ready Data Lake (The “Central Library”)Once the data is captured, it flows into this layer to be consolidated. It breaks down data silos by collecting scattered facility data into one centralized library. It then automatically catalogs this information so that the AI can instantly access, read, and learn from it.
L3. Pluggable AI Analysis Layer (The “Brain”)This is where the cognitive processing happens. Acting as the brain of the system, it analyzes the organized data to find optimal solutions. Its “pluggable” nature means you can dynamically swap in the best AI algorithms—like Deep Learning or Reinforcement Learning—just like snapping Lego blocks together to fit the specific situation.
L4. Autonomous Control Loop (The “Executive Branch”)Finally, the insights from the brain are turned into action here. This layer operates in real-time (down to the millisecond) to send control signals back to the system. It executes decisions entirely on its own, achieving true autonomous operation with zero human intervention.
Summary
This architecture demonstrates a seamless, end-to-end operational flow: it starts by sensing microscopic hardware changes (L1), structures that raw data for immediate AI consumption (L2), applies dynamic and flexible algorithms to make smart decisions (L3), and ultimately executes those decisions autonomously in real-time (L4). It is a perfect blueprint for achieving a fully uncrewed, intelligent infrastructure.
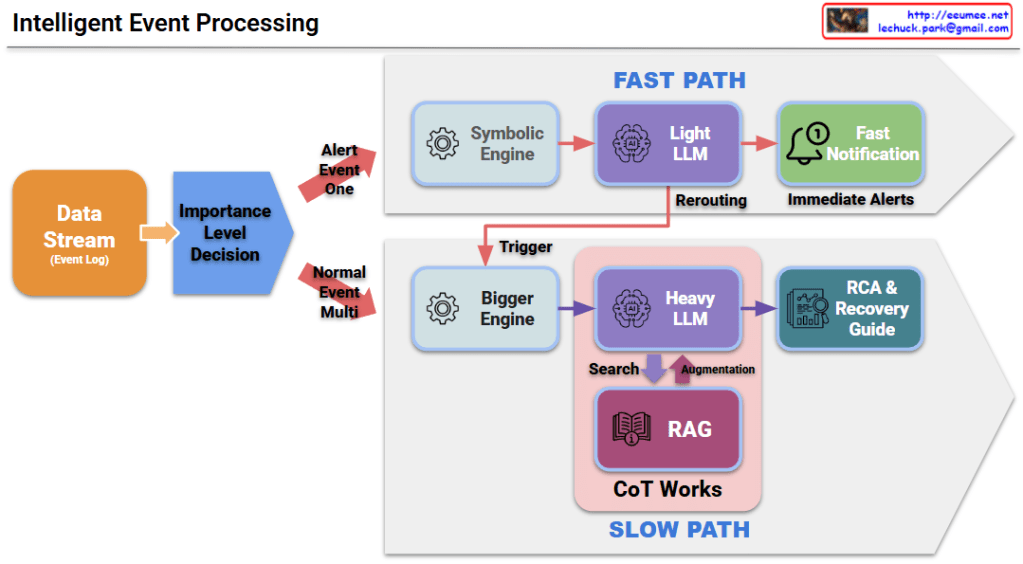
The provided diagrams, titled Event Level Flow and Intelligent Event Processing, illustrate a sophisticated dual-path framework designed to optimize incident response within data center environments. This architecture effectively balances the need for immediate awareness with the requirement for deep, evidence-based diagnostics.
1. Data Ingestion and Intelligent Triage
The process begins with a continuous Data Stream of event logs. An Importance Level Decision gate acts as a triage point, routing traffic based on urgency and complexity:
Critical, single-source issues are designated as Alert Event One and sent to the Fast Path.
Standard or bulk logs are labeled Normal Event Multi and directed to the Slow Path for batch or deeper processing.
2. Fast Path: The Low-Latency Response Track
This path minimizes the time between event detection and operator awareness.
A Symbolic Engine handles rapid, rule-based filtering.
A Light LLM (typically a smaller parameter model) summarizes the event for human readability.
The Fast Notification system delivers immediate alerts to operators.
Crucially, a Rerouting function triggers the Slow Path, ensuring that even rapidly reported issues receive full analytical scrutiny.
3. Slow Path: The Comprehensive Diagnostic Track
The Slow Path focuses on precision, using advanced reasoning to solve complex problems.
Upon receiving a Trigger, a Bigger Engine prepares the data for high-level inference.
The Heavy LLM executes Chain of Thought (CoT) Works, breaking down the incident into logical steps to avoid errors.
This is supported by a Retrieval-Augmented Generation (RAG) system that performs a Search across internal knowledge bases (like manuals) and performs an Augmentation to enrich the LLM prompt with specific context.
The final output is a comprehensive Root Cause Analysis (RCA) and an actionable Recovery Guide.
Summary
This architecture bifurcates incident response into a Fast Path for rapid awareness and a Slow Path for in-depth reasoning.
By combining lightweight LLMs for speed and heavyweight LLMs with RAG for accuracy, it ensures both rapid alerting and reliable recovery guidance.
The integration of symbolic rules and AI-driven Chain of Thought logic enhances both the operational efficiency and the technical reliability of the system.
This framework demonstrates how digital technology can resolve the traditional trade-off between stability and efficiency. The approach is to establish safe operations as the foundation, utilize digitalization as the implementation method, and ultimately achieve reduction in both operating costs and energy costs.
The diagram shows a strategic pathway where digital transformation enables organizations to move beyond the traditional stability-efficiency dilemma toward a comprehensive cost optimization model.
From Claude with some prompting This image illustrates an Automation process, consisting of two main parts:
Upper section:
Shows a basic automation process consisting of Condition and Action.
Real Data (Input) and Real Plan (Output) are fed into a Software System.
Lower section:
Depicts a more complex automation process.
Alternates between manual operations (hand holding hammer icon) and software systems (screen with gear icon).
This represents the integration of manual tasks and automated systems.
Key features of the process:
Use of Accurate Verified Data
24/7 Stable System operation
Continuous Optimization
Results: More Efficient process with Cost & Resource reduction
The hammer icon represents manual interventions, working in tandem with automated software systems to enhance overall process efficiency. This approach aims to achieve optimal results by combining human involvement with automation systems.
The image demonstrates how automation integrates real-world tasks with software systems to increase efficiency and reduce costs and resources.



 Lechuck Park