Edge Gateway Concepts

Edge Gateway Concepts

This image is an architectural diagram that illustrates the data flow and core functionalities of an Edge Gateway in an industrial setting. The diagram is divided into four main components:

  1. Facilities & Sensors (Left): This section depicts industrial equipment, such as transformers and generators, alongside wireless sensors. These physical devices generate raw data and transmit it using a “Facility-friendly Protocol,” meaning the data is sent in various native, equipment-specific formats.
  2. Edge Gateway (Center): This is the core intermediary component. It receives data from the facilities and sensors. Below the gateway nodes, a stack outlines the Edge Gateway’s five primary functional layers:
    • Protocol Transfer: Converts varied facility protocols into a unified standard.
    • Data(Point) Tagging: Adds identifiers and context to the raw data points.
    • Timestamping (PTP): Records precise time data, utilizing both facility-made and Edge Gateway-made timestamps.
    • Urgent Event Detection: Identifies critical issues in real-time based on 1-dimensional thresholds.
    • HA & Security: Ensures High Availability and secure operations for the gateway itself.
  3. Policy Controller (Bottom Right of Center): This module governs how the Edge Gateway processes information. It applies “Data Standardization Policy Control” by directly instructing the Edge Gateway’s Protocol Transfer and Data Tagging layers, ensuring all data is uniformly processed according to predefined rules.
  4. Integration (Right): This represents the top-level centralized monitoring, management, or cloud system. The Edge Gateway transmits the newly processed and tagged data to this integration layer using a unified “Standardization Protocol.”

Summary

This diagram effectively maps out an Industrial IoT (IIoT) data pipeline. It explains how an Edge Gateway ingests raw, non-standardized data from diverse facilities and sensors, processes and tags it based on rules from a Policy Controller, and then securely forwards the unified data to a centralized Integration system using standardized protocols.

#EdgeGateway #EdgeComputing #IoT #IndustrialIoT #DataStandardization #ArchitectureDiagram #TechArchitecture #DataPipeline

With Gemini

AI optimization

AI Optimization Diagram Interpretation

The provided diagram, titled “AI Optimization,” illustrates the process of AI learning and inference in relation to data flow, along with the physical hardware infrastructure optimization (power and thermal management) required to sustain it. It goes beyond simple software algorithms to provide architectural insights into AI infrastructure and system design.

1. Data Acquisition and Preprocessing (Left Section)

  • Infinite World Data (Green Arrow): Represents the vast, unstructured, and infinite source data existing in the real world.
  • For All World Data & RAM: Shows the process of loading this infinite real-world data into RAM (a finite computing resource) so that the AI can process it. This represents the beginning of the data pipeline, where massive amounts of data are ingested, compressed, and refined for the system.

2. AI Computation & Infrastructure Optimization (Center Section)

This is the core of the diagram, showing how software-driven data optimization and hardware-driven power/cooling optimization intersect around the central AI processor (such as a GPU or NPU).

  • Algorithm & Model Optimization (Horizontal Flow):
    • Learning: The process where the AI trains on and optimizes data based on human-built statistical frameworks (Human Statistics).
    • Inference: The process of executing the trained model to run computations on new inputs and derive actionable results.
  • Physical Infrastructure Optimization (Vertical Flow): Represents the data center-level physical management required to sustain high-performance AI workloads.
    • Fit Optimization For Computing (Top): The lightning bolt icon signifies the optimization of high-density power supply systems and computing efficiency necessary for heavy AI workloads.
    • Fit Optimization For Heat (Bottom): The snowflake and circulation icon represents thermal management and cooling system optimization (such as liquid immersion cooling or advanced HVAC) to control the massive heat generated by the chips during intense computation.

3. Generation of Meaningful Information (Right Section)

  • For All Human Data & RAM: Shows the final output derived from the AI’s inference process being loaded back into the memory (RAM).
  • Unlike the large, single bar of raw source data on the left, the data on the right is fragmented into multiple smaller blocks. This symbolizes that massive, unrefined data has been successfully processed by the AI into structured, meaningful, and digestible information that humans can immediately consume and utilize for specific purposes.

Summary

This diagram emphasizes that AI value creation is not merely a software algorithm that takes data in and spits results out. It conveys a system engineering philosophy: true AI Optimization can only be achieved when software models are perfectly synchronized with the physical architecture—specifically high-density power delivery (Computing) and efficient thermal management (Heat)—that supports the hardware at its core.

#AIOptimization #AIInfrastructure #SystemArchitecture #MachineLearning #DeepLearning #DataPipeline #DataCenter #ThermalManagement #ComputingPower #ArtificialIntelligence #TechInference #BigData

Prerequisites for ML


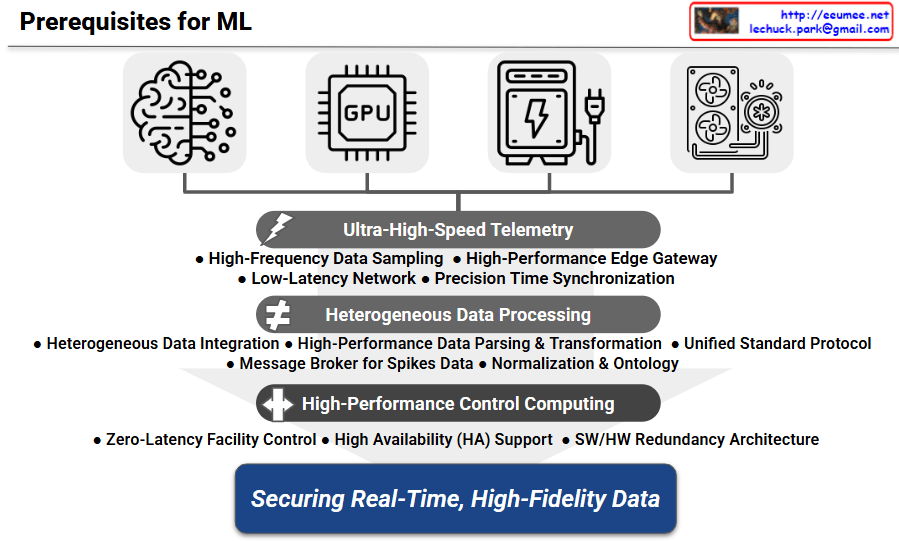
Architecture Overview: Prerequisites for ML

1. Data Sources: Convergence of IT and OT (Top Layer)

The diagram outlines four core domains essential for machine learning-based control in an AI data center. The top layer illustrates the necessary integration of IT components (AI workloads and GPUs) and Operational Technology (Power/ESS and Cooling systems). It emphasizes that the first prerequisite for an AI data center agent is to aggregate status data from these historically siloed equipment groups into a unified pipeline.

2. Collection Phase: Ultra-High-Speed Telemetry

The subsequent layer focuses on data collection. Because power spikes unique to AI workloads occur in milliseconds, the architecture demands High-Frequency Data Sampling and a Low-Latency Network. Furthermore, Precision Time Synchronization is highlighted as a critical requirement; the timestamps of a sudden GPU load spike must perfectly align with temperature changes in the cooling system for the ML model to establish accurate causal relationships.

3. Processing Phase: Heterogeneous Data Processing

As incoming data points utilize varying communication protocols and polling intervals, the third layer addresses data refinement. It employs a Unified Standard Protocol to convert heterogeneous data, along with Normalization & Ontology mapping so the ML model can comprehend the physical relationships between IT servers and facility cooling units. Additionally, a Message Broker for Spikes Data is included as a buffer to prevent system bottlenecks or data loss during the massive influx of telemetry that occurs at the onset of large-scale distributed training.

4. Execution Phase: High-Performance Control Computing

Following data processing, the execution layer is designed to take direct action on the facility infrastructure. This phase requires Zero-Latency Facility Control computing power to enable immediate physical responses. To meet the zero-downtime demands of data center operations, this layer incorporates a comprehensive SW/HW Redundancy Architecture to guarantee absolute High Availability (HA).

5. Ultimate Goal: Securing Real-Time, High-Fidelity Data

The foundational layers culminate in the ultimate goal shown at the bottom: Securing Real-Time, High-Fidelity Data. This emphasizes that predictive control algorithms cannot function effectively with noisy or delayed inputs. A robust data infrastructure is the definitive prerequisite for enabling proactive pre-cooling and ESS optimization.


📝 Summary

  1. A successful ML-driven data center operation requires a robust, high-speed data foundation prior to deploying predictive algorithms.
  2. Bridging the gap between IT (GPUs) and OT (Power/Cooling) through synchronized, high-frequency telemetry forms the core of this architecture.
  3. Securing real-time, high-fidelity data enables the crucial transition from delayed reactive responses to proactive predictive cooling and energy optimization.

#AIDataCenter #MachineLearning #ITOTConvergence #DataPipeline #PredictiveControl #Telemetry

RAG Works Pipeline

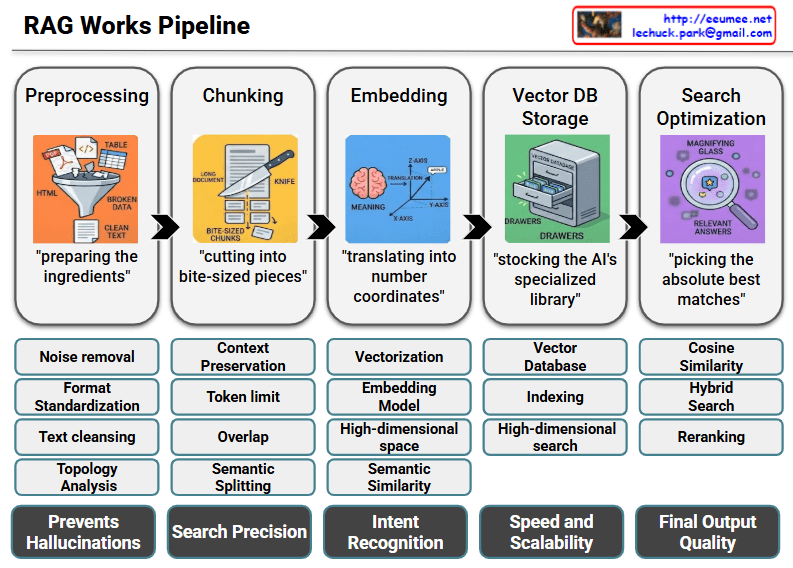
This image illustrates the RAG (Retrieval-Augmented Generation) Works Pipeline, breaking down the complex data processing workflow into five intuitive steps using relatable analogies like cooking and organizing.

Here is a step-by-step breakdown of the pipeline:

  • Step 1: Preprocessing (“preparing the ingredients”)
    Just like prepping ingredients for a meal, this step filters raw, unstructured data from various formats (PDFs, HTML, tables) through a funnel to extract clean text. By handling noise removal, format standardization, and text cleansing, it establishes a solid data foundation that ultimately prevents AI hallucinations.
  • Step 2: Chunking (“cutting into bite-sized pieces”)
    Long documents are sliced into smaller, manageable pieces that the AI model can easily process. Techniques like semantic splitting and overlapping ensure that the original context is preserved without exceeding the AI’s token limits. This careful division drastically improves the system’s overall search precision.
  • Step 3: Embedding (“translating into number coordinates”)
    Here, the text chunks are converted into mathematical vectors mapped in a high-dimensional space (X, Y, Z axes). This vectorization captures the underlying semantic meaning and context of the text, allowing the system to go beyond simple keyword matching and achieve true intent recognition.
  • Step 4: Vector DB Storage (“stocking the AI’s specialized library”)
    The embedded vectors are systematically stored and indexed in a Vector Database. Think of it as a highly organized, specialized filing cabinet designed specifically for AI. Efficient indexing allows for high-dimensional searches, ensuring optimal speed and scalability even as the dataset grows massively.
  • Step 5: Search Optimization (“picking the absolute best matches”)
    Acting as a magnifying glass, this final step identifies and retrieves the most relevant information to answer a user’s query. Using advanced methods like cosine similarity, hybrid search, and reranking, the system pinpoints the exact data needed. This precise retrieval guarantees the highest final output quality for the AI’s generated response.

#RAG #RetrievalAugmentedGeneration #GenerativeAI #LLM #VectorDatabase #DataPipeline #MachineLearning #AIArchitecture #TechExplanation #ArtificialIntelligence

With Gemini