Sensing Point

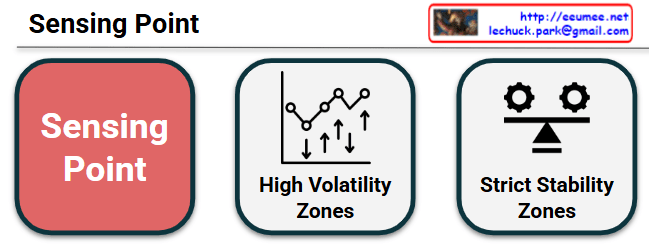
This mage is a diagram that visually contrasts two core characteristics of “Sensing Points,” which are locations where data is collected and status is monitored within a system or infrastructure environment.

Here is a breakdown of each component:

  • Sensing Point (Red Block): The central theme of this diagram. It represents the measurement points where physical and logical sensors are deployed to collect data for system monitoring and autonomous operations.
  • High Volatility Zones: Represented by a fluctuating line graph and up/down arrows. This indicates areas that are highly dynamic with large and rapid fluctuations in state—such as sudden surges in GPU power consumption or localized thermal changes driven by heavy AI workloads. The primary goal of sensing in these zones is to minimize data collection latency (Time Constant) to instantly capture rapid changes and respond with agility.
  • Strict Stability Zones: Represented by interlocking gears and a balanced scale. This refers to the foundational areas of the system where balance must be strictly maintained, such as the baseline temperature of a cooling system or the main power distribution network. Because volatility must be tightly controlled here, the purpose of sensing is focused on ensuring the overall integrity of the infrastructure by detecting subtle imbalances or early signs of anomalies.

Comprehensive Analysis:

Ultimately, this infographic illustrates a monitoring strategy for efficiently managing high-density environments, such as AI Data Centers. By bifurcating the monitoring targets into “areas requiring immediate tracking due to high volatility” and “areas requiring homeostasis through strict control,” it provides a highly intuitive, architecturally structured visualization. It emphasizes the need to establish tailored measurement and operational standards (like AIOps) for each specific domain.


#DataCenter#InfrastructureArchitecture #SensingPoint #Telemetry #SystemMonitoring #AutonomousOperations #HighDensityComputing #TechVisualized

With Gemini

Fault Detection and Recovery: Data Pipeline


Fault Detection and Recovery: Data Pipeline

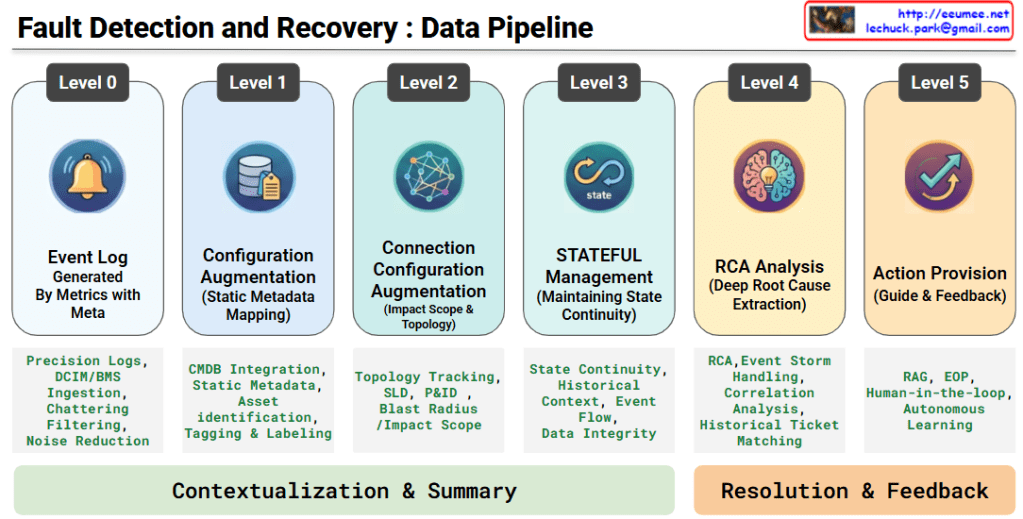
This architecture illustrates an advanced, six-stage, end-to-end data pipeline designed for an AI-driven infrastructure agent. It demonstrates how raw telemetry is systematically transformed into actionable, automated remediation through two primary phases.

Phase 1: Contextualization & Summary

This phase is dedicated to building a high-resolution, stateful understanding of the infrastructure. It takes raw alerts and layers them with critical physical and logical context.

  • Level 0: Event Log (Generated By Metrics with Meta)The foundation of the pipeline. High-precision logs and telemetry are ingested from DCIM/BMS systems. Crucially, this stage performs chattering filtering and noise reduction to isolate genuine anomalies from meaningless alerts.
  • Level 1: Configuration Augmentation (Static Metadata Mapping)Raw events are enriched by integrating with the CMDB. By mapping static metadata to the alerts, the system performs precise asset identification, tagging, and labeling to know exactly which component is affected.
  • Level 2: Connection Configuration Augmentation (Impact Scope & Topology)The pipeline maps the isolated asset against physical and logical topologies (such as Single Line Diagrams and P&IDs). This enables the system to track dependencies and accurately calculate the blast radius or impact scope of a fault.
  • Level 3: STATEFUL Management (Maintaining State Continuity)Moving beyond isolated, point-in-time alerts, this level links current events with historical context and event flows. It ensures data integrity and maintains a continuous, stateful tracking of the system’s health.

Phase 2: Resolution & Feedback

With a fully contextualized baseline established, the pipeline shifts from situational awareness to intelligent diagnosis and automated remediation.

  • Level 4: RCA Analysis (Deep Root Cause Extraction)During an event storm, the system performs advanced correlation analysis and historical trouble-ticket matching. It sifts through the cascading symptoms to pinpoint the deep root cause (RCA) of the failure.
  • Level 5: Action Provision (Guide & Feedback)In the final stage, the platform leverages RAG (Retrieval-Augmented Generation) to instantly surface the most relevant Emergency Operating Procedures (EOP). By incorporating a Human-in-the-loop (HITL) feedback mechanism, expert operators validate the actions, allowing the AI model to continuously undergo autonomous learning and refine its future responses.

Summary

This data pipeline elegantly maps the journey from raw infrastructure noise to intelligent, automated resolution. By progressively layering static configuration data, topology mapping, and stateful tracking over high-precision logs, the architecture effectively neutralizes event storms. Ultimately, it empowers AI-driven agents to deliver highly accurate root cause analyses and RAG-assisted operational guides, creating a resilient system that continuously learns and improves through expert human feedback.

#AIOps #DataCenterArchitecture #RootCauseAnalysis #SystemObservability #RAG #FaultDetection #Telemetry #HumanInTheLoop #InfrastructureAutomation #TechInfographic

With Gemini

Prerequisites for ML


Architecture Overview: Prerequisites for ML

1. Data Sources: Convergence of IT and OT (Top Layer)

The diagram outlines four core domains essential for machine learning-based control in an AI data center. The top layer illustrates the necessary integration of IT components (AI workloads and GPUs) and Operational Technology (Power/ESS and Cooling systems). It emphasizes that the first prerequisite for an AI data center agent is to aggregate status data from these historically siloed equipment groups into a unified pipeline.

2. Collection Phase: Ultra-High-Speed Telemetry

The subsequent layer focuses on data collection. Because power spikes unique to AI workloads occur in milliseconds, the architecture demands High-Frequency Data Sampling and a Low-Latency Network. Furthermore, Precision Time Synchronization is highlighted as a critical requirement; the timestamps of a sudden GPU load spike must perfectly align with temperature changes in the cooling system for the ML model to establish accurate causal relationships.

3. Processing Phase: Heterogeneous Data Processing

As incoming data points utilize varying communication protocols and polling intervals, the third layer addresses data refinement. It employs a Unified Standard Protocol to convert heterogeneous data, along with Normalization & Ontology mapping so the ML model can comprehend the physical relationships between IT servers and facility cooling units. Additionally, a Message Broker for Spikes Data is included as a buffer to prevent system bottlenecks or data loss during the massive influx of telemetry that occurs at the onset of large-scale distributed training.

4. Execution Phase: High-Performance Control Computing

Following data processing, the execution layer is designed to take direct action on the facility infrastructure. This phase requires Zero-Latency Facility Control computing power to enable immediate physical responses. To meet the zero-downtime demands of data center operations, this layer incorporates a comprehensive SW/HW Redundancy Architecture to guarantee absolute High Availability (HA).

5. Ultimate Goal: Securing Real-Time, High-Fidelity Data

The foundational layers culminate in the ultimate goal shown at the bottom: Securing Real-Time, High-Fidelity Data. This emphasizes that predictive control algorithms cannot function effectively with noisy or delayed inputs. A robust data infrastructure is the definitive prerequisite for enabling proactive pre-cooling and ESS optimization.


📝 Summary

  1. A successful ML-driven data center operation requires a robust, high-speed data foundation prior to deploying predictive algorithms.
  2. Bridging the gap between IT (GPUs) and OT (Power/Cooling) through synchronized, high-frequency telemetry forms the core of this architecture.
  3. Securing real-time, high-fidelity data enables the crucial transition from delayed reactive responses to proactive predictive cooling and energy optimization.

#AIDataCenter #MachineLearning #ITOTConvergence #DataPipeline #PredictiveControl #Telemetry

Numeric Data Processing


Architecture Overview

The diagram illustrates a tiered approach to Numeric Data Processing, moving from simple monitoring to advanced predictive analytics:

  • 1-D Processing (Real-time Detection): This layer focuses on individual metrics. It emphasizes high-resolution data acquisition with precise time-stamping to ensure data quality. It uses immediate threshold detection to recognize critical changes as they happen.
  • Static Processing (Statistical & ML Analysis): This stage introduces historical context. It applies statistical functions (like averages and deviations) to identify trends and uses Machine Learning (ML) models to detect anomalies that simple thresholds might miss.
  • n-D Processing (Correlative Intelligence): This is the most sophisticated layer. It groups multiple metrics to find correlations, creating “New Numeric Data” (synthetic metrics). By analyzing the relationship between different data points, it can identify complex root causes in highly interleaved systems.

Summary

  1. The framework transitions from reactive 1-D monitoring to proactive n-D correlation, enhancing the depth of system observability.
  2. It integrates statistical functions and machine learning to filter noise and identify true anomalies based on historical patterns rather than just fixed limits.
  3. The ultimate goal is to achieve high-fidelity data processing that enables automated severity detection and complex pattern recognition across multi-dimensional datasets.

#DataProcessing #AIOps #MachineLearning #Observability #Telemetry #SystemArchitecture #AnomalyDetection #DigitalTwin #DataCenterOps #InfrastructureMonitoring

With Gemini