AI agent fro DC Operations

Data & Knowledge Driven AI Agent for Data Center Operations

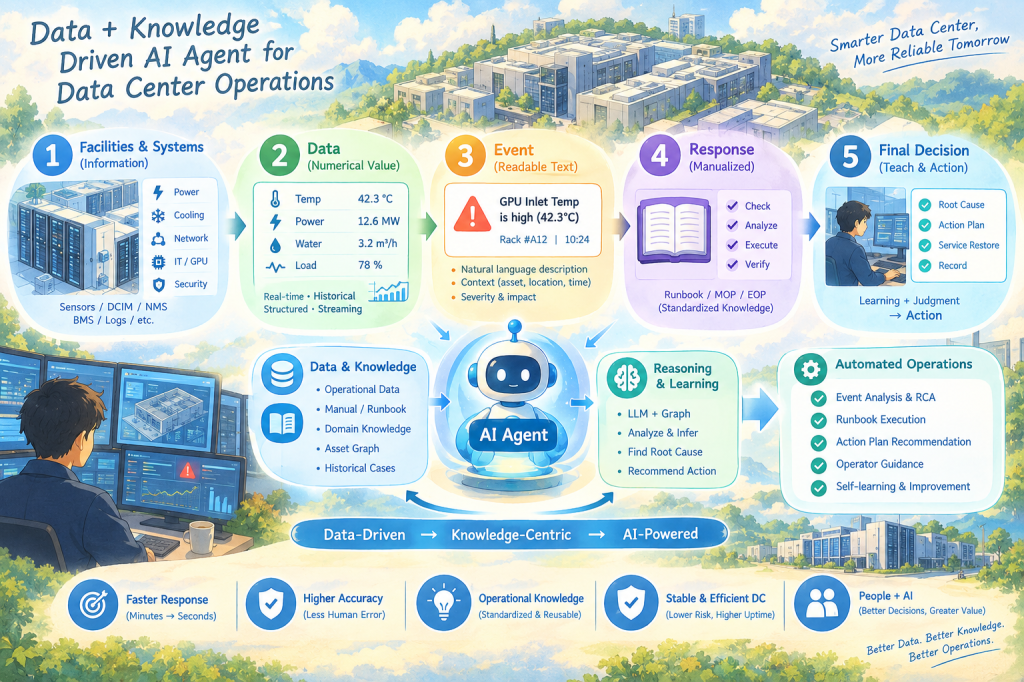
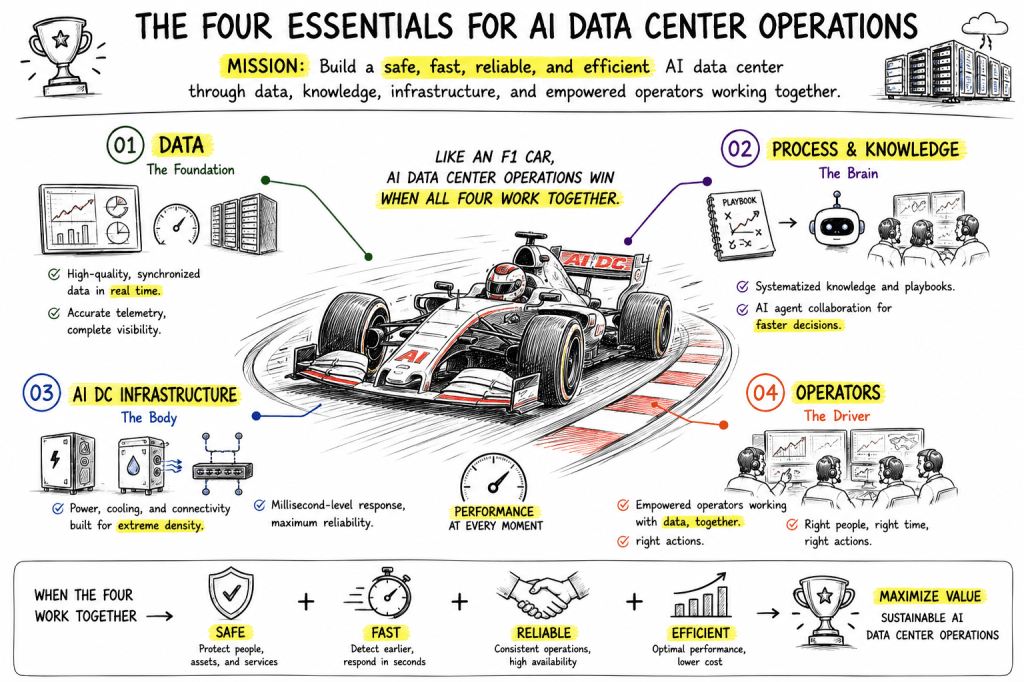
This illustration describes how data center operations can evolve from facility data → operational knowledge → AI Agent → automated operations.

The key message is not simply that AI controls data center equipment.

Rather, it shows how AI Agents can connect operational data with accumulated human knowledge, understand operational situations, reason about incidents, and support or automate operational actions.


1. Facilities & Systems

The process starts with the physical infrastructure and operational systems of the data center.

The illustration represents:

  • Power
  • Cooling
  • Network
  • IT / GPU
  • Security
  • Environment

Sensors and systems continuously generate operational information.

Systems such as DCIM, NMS, BMS, and log platforms collect this information.

In simple terms:

Facilities generate information, and systems collect it.


2. Data — From Information to Metrics

Facility information is transformed into measurable operational data.

For example:

  • Temperature → 42.3°C
  • Power Load → 12.6 MW
  • Water Flow → 3.2 m³/h
  • Utilization → 78%

The important point is that the AI Agent uses both:

Real-time Data + Historical Data

Real-time data tells the Agent what is happening now, while historical data provides the operational context and previous experience.


3. Event — Turning Numbers into Meaning

Raw numbers are not always meaningful to operators.

Therefore, data is transformed into understandable events.

For example:

GPU Inlet Temperature is high (42.3°C)

Now the numerical value has become a meaningful operational event.

The event also contains context such as:

What happened + Where + When + Severity + Impact

This is important because the AI Agent does not need to operate only on raw numbers. It can reason about meaningful operational situations.


4. Response — Operational Knowledge

When an event occurs, traditional operations rely on manuals and experienced operators.

The illustration represents this knowledge through:

  • Runbook
  • MOP
  • EOP
  • SOP
  • Best Practices

A typical response process can be:

Check → Analyze → Execute → Verify

This represents the transformation of human experience into reusable operational knowledge.

Human Experience → Documentation → Operational Knowledge

This knowledge becomes one of the most important assets for the AI Agent.


5. Final Decision — Judgment & Action

The final stage goes beyond detecting an event.

The operational process becomes:

Root Cause → Action Plan → Service Restore → Record

Traditionally, experienced operators perform much of this reasoning manually.

With an AI Agent, operational data and knowledge can be combined to support:

  • Root-cause analysis
  • Action recommendations
  • Runbook execution
  • Operator guidance
  • Controlled automation

In a real data center, however, autonomous action should be governed by policies, safety controls, and human approval where required.


The Center of the Illustration — AI Agent

The AI Agent sits at the center because it connects Data and Knowledge.

Data

  • Operational Data
  • Facility & Asset Data
  • Event & Incident Data
  • Historical Cases
  • Asset / Relationship Data

Knowledge

  • Manuals
  • Runbooks
  • SOP / MOP / EOP
  • Domain Knowledge
  • Best Practices
  • Past Cases & Lessons

The Agent combines these two layers to perform:

Learn → Reason → Act

A simple way to express the concept is:

Data tells the Agent what is happening.
Knowledge tells the Agent what it means and what to do.


The Core Message

The most important point of the illustration is that the AI Agent itself is not the foundation.

The real foundation is:

Data → Knowledge → AI Agent → Operations

Without accurate data, the Agent cannot reliably understand the current state.

Without structured operational knowledge, the Agent cannot reliably determine what the situation means or what response is appropriate.

Therefore, the real objective of AI-enabled data center operations is not simply:

“Deploy AI.”

It is:

“Make operational data and knowledge usable by AI.”


The Transformation of Data Center Operations

The bottom of the illustration shows:

Data-Driven → Knowledge-Centric → AI-Powered

This represents the evolution of operational models.

Traditional Operations

Human → Data → Manual Analysis → Manual Action

AI Agent-Based Operations

Data + Knowledge → AI Agent → Reasoning → Recommended / Controlled Action

The role of people does not disappear.

Instead, it changes.

AI handles repetitive monitoring, analysis, and operational assistance, while people focus more on judgment, decision-making, exception handling, and continuous improvement.

This is why the final concept is:

People + AI

rather than simply AI replaces People.


One-Sentence Summary

By connecting data generated from data center facilities with operational knowledge, an AI Agent can understand, reason, and support or automate operational actions—transforming human-centered operations into data- and knowledge-driven intelligent operations.

#AIDC #DataCenter #AIDataCenter #AIAgent #DataDriven #KnowledgeDriven #AIOps #DCIM #DataCenterOperations #OperationalAutomation #DigitalTransformation #DataAndKnowledge #IntelligentOperations #HumanAndAI

With ChatGPT
Optimizing AI DC Operations

Optimizing Customer AI GPU Services and Establishing Continuous Improvement via a Data-Driven Feedback Loop

This process diagram provides a logical roadmap for a strategic transformation. It illustrates the shift from conventional, manual operations to a data-driven, intelligent operating system. The ultimate goal is to protect customer AI infrastructure investments and maximize operational efficiency by embedding continuous improvement into new AI Data Center facilities.

1. Starting Point: Defining Customer Value and Goals (Customer AI GPU Service & CAPEX/OPEX Protection)

  • The beginning and final goal of the process are encased in the purple hexagon panel. It prioritizes maximizing the value of the ‘AI GPU service’ provided to the customer while simultaneously ‘protecting’ the underlying Capital Expenditure (CAPEX) and Operating Expenditure (OPEX). The icons (people, robot, and money) represent business value and the importance of cost.

2. Paradigm Shift: Modernizing Operations (Automation & People -> Digital/AI)

  • The next step, ‘AUTOMATION’, represents a bold paradigm shift away from manual, people-centric operational methods toward a digital and AI-based automated system. Gears and a robot icon represent the technical core of this change.

3. Core Methodology: The Data-Driven Intelligent Hub (Hub Working with Data)

  • To enable automation, all the vast data streaming from infrastructure and equipment is collected and processed in a single location: the ‘HUB WORKING WITH DATA’. A server rack icon signifies that this hub is the nerve center of data.

4. The Three Core Resulting Capabilities (The Three Pillars of Result)

  • As ‘working with data’ becomes established, three distinct and interrelated capabilities (or outputs) are derived. They independently support the new facility while remaining connected:
    • High-Quality Data: Refined and accumulated data forms the foundation for accurate predictions and analytics. (Green, checkmark icon)
    • Automated Process: Standardized and intelligent automation workflows are built based on high-quality data. (Purple, robot arm icon)
    • Operations Expert: A new type of expert with the ability to interpret systems from a data perspective and offer insights is essential. (Orange, expert icon)

5. Integration & Destination: New AI DC Facility & Closed Loop (New AI DC Facility & Continuous Improvement)

  • These three capabilities (Data, Process, Expert) are synthesized and converge in the teal panel labeled ‘NEW AI DC FACILITY’. This signifies that the derived capabilities have been perfectly integrated into the actual high-density, high-power equipment of the new AI Data Center.
  • A circular feedback loop on the far right illustrates how operational experience from the new facility is fed back into the data hub. This loop, coupled with the text ‘CONTINUOUS IMPROVEMENT’, explicitly states that this system is not a one-time build but a continuous, evolving virtuous cycle.

Summary:

This diagram illustrates a strategic process aimed at protecting customer AI assets (GPUs) and optimizing operational costs. It details the transformation from people-centric, manual operations to a data and AI-driven intelligent hub, generating key outputs (high-quality data, automated processes, and experts). These outputs are then integrated into a new AI data center, creating a continuous improvement feedback loop to maximize value.

#AIDC #DataDrivenOps #GPUServiceOptimization #CapexOpexProtection #Automation #HighQualityData #OperationsExpert #ContinuousImprovement

With Gemini

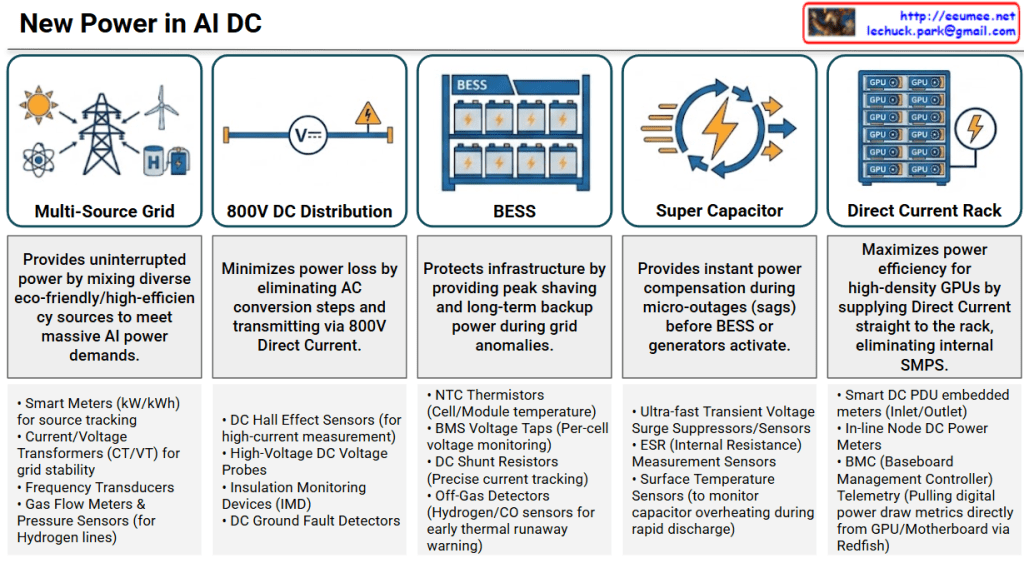
New Power(s) in AI DC

Overview: New Power Architecture in AI DC

This infographic outlines a multi-layered, hybrid power infrastructure designed to meet the colossal, dynamic power demands of modern AI factories. The system progresses from varied facility-level power sources down to logic-level components, integrated into a unified direct-current environment. The primary objectives are to minimize conversion losses, ensure uninterrupted operation, and provide granular, digital telemetry for proactive management.

The Five Stages of Power Flow

1. Multi-Source Grid (Grid Receiving)

  • Icon: A convergence of diverse sources, including power transmission towers (Grid), solar, wind turbines, atom/SMR, and hydrogen lines.
  • Role: Provides uninterrupted mixed power from green and high-efficiency sources to meet massive AI power demands.
  • Key Metrics: Supply volume/dependency per source (Grid vs. Microgrid), grid frequency and voltage stability, SMR/Hydrogen fuel status, and facility-level carbon footprint (PUE/CUE).

2. 800V DC Distribution (Direct Current Busbar)

  • Icon: A straight high-voltage DC busbar with the “V—” DC symbol and a high-voltage warning indicator.
  • Role: Minimizes power conversion loss by eliminating several AC conversion steps and transmitting power at 800V High-Voltage Direct Current (HVDC).
  • Key Metrics: Main Busbar DC voltage/current, voltage drop and line loss rate, and insulation resistance/ground fault detection.

3. BESS (Battery Energy Storage System) (Modular Storage Racks)

  • Icon: Multiple modular industrial battery storage racks.
  • Role: Protects infrastructure via peak shaving (reducing peak grid load) and provides long-term backup power during grid anomalies or outages.
  • Key Metrics: State of Charge (SoC) & State of Health (SoH), cell/module-level temperature and thermal runaway detection, real-time C-rate, and available capacity.

4. Super Capacitor (Ultra-short Power Compensation) (Rapid Compensation Loop)

  • Icon: A dynamic lightning bolt with rapid response arrows in a circular flow.
  • Role: Provides instant power compensation during micro-outages (voltage sags/sags) to bridge the millisecond gap before BESS or generators can activate.
  • Key Metrics: Voltage sag detection response time (ms), ride-through time, equivalent series resistance (ESR), and cycle life.

5. Direct Current Rack (DC-Powered GPU Rack) (DC Rack Inlet)

  • Icon: A high-density server rack populated with GPU nodes. A distinct DC power input is connected, and the rack does not require a bulky internal AC/DC power supply unit.
  • Role: Maximizes power efficiency for high-density GPUs by supplying direct current straight to the rack, completely eliminating the internal SMPS conversion stage.
  • Key Metrics: Total rack power consumption (kW), DC PDU voltage/current and top/bottom balance, and GPU node-level power draw.

Summary

This infographic describes a multi-layered hybrid power architecture designed for AI data centers. The architecture progresses from a diverse array of power sources—including a 1. Multi-Source Grid (renewable, hydrogen, SMR)—through to a central 2. 800V DC Distribution busbar, all integrated into a unified hybrid direct-current environment. The system balances hybrid loads by combining the immediate, millisecond response of the 4. Super Capacitor (ride-through) with the long-term backup and peak-shaving capabilities of the 3. BESS (modular battery storage). This facility-level infrastructure ultimately provides direct, conversion-free power to the 5. Direct Current Rack (DC-powered GPU rack). A critical innovation of this architecture is the facility-to-IT handshake, where digital telemetry (PDU, node meters, Redfish telemetry from GPUs) enables granular Root Cause Analysis (RCA) to instantly separate facility faults (flow/voltage anomalies) from IT server faults (component degradation/thermal throttling).

#AIDC #PowerInfrastructure #800VDC #DirectCurrent #BESS #SuperCapacitor #GreenEnergy #Hydrogen #SMR #GPUDensity #PowerTelemetry

With Gemini

Data Center Cooling

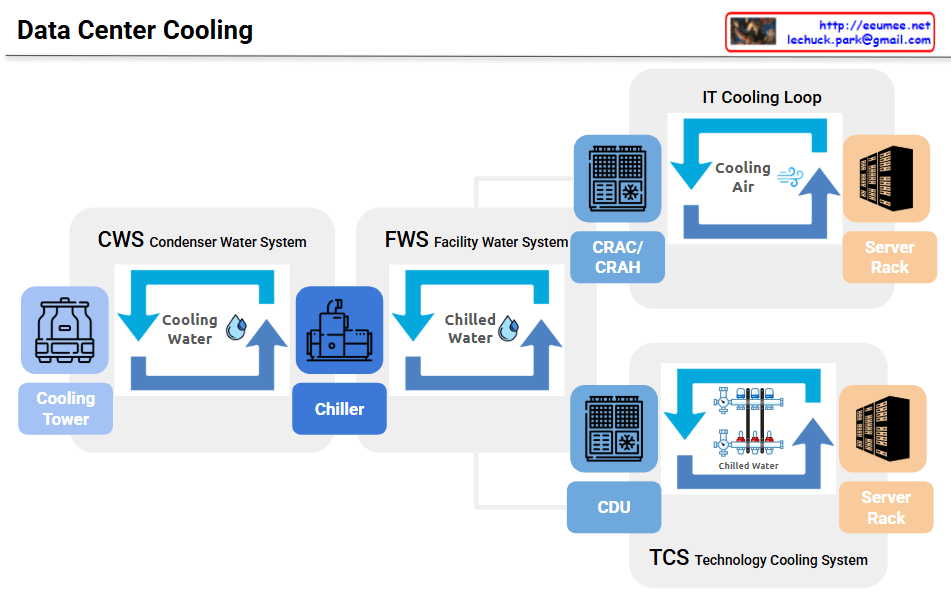
This diagram illustrates a hybrid Data Center Cooling Architecture, depicting how a facility manages thermal loads by combining traditional air cooling with advanced liquid cooling. The system is designed to support both standard infrastructure and high-density compute environments (such as AI clusters) simultaneously.

1. Facility-Level Thermal Management (Primary Infrastructure)

The left and center sections of the diagram represent the foundational facility water loops that capture and reject heat from the entire data center.

  • CWS (Condenser Water System): This is the heat rejection loop on the far left. Cooling Water circulates between the Chiller and the external Cooling Tower. The heat absorbed by the chiller from the facility’s interior is transferred to this loop and evaporated into the atmosphere via the cooling tower.
  • Chiller: Acts as the central refrigeration unit. It sits between the CWS and FWS, performing the critical energy transfer that cools the facility’s internal water supply.
  • FWS (Facility Water System): This is the internal primary loop. It circulates Chilled Water produced by the chiller throughout the building. As shown by the split branching lines on the right, this single FWS loop serves as the shared cold utility source for both cooling methodologies.

2. Dual-Path IT Heat Dissipation (Secondary Loops)

The FWS branches into two distinct pathways to accommodate different server densities and infrastructure types:

A. Air Cooling Pathway (Top Right)

  • Components: CRAC/CRAH (Computer Room Air Conditioner / Computer Room Air Handling unit) & IT Cooling Loop.
  • Mechanism: Chilled water from the FWS flows into the CRAC/CRAH units. Fans blow air over the chilled coils, generating Cooling Air. This cold air is forced through the data hall into the Server Rack to dissipate heat via convection.
  • Application: Ideal for traditional, low-to-medium density workloads.

B. Liquid Cooling Pathway (Bottom Right)

  • Components: CDU (Coolant Distribution Unit) & TCS (Technology Cooling System).
  • Mechanism: Chilled water from the FWS enters the CDU, which contains an internal heat exchanger. Rather than mixing the waters, the CDU uses the facility’s chilled water to cool a isolated, highly-purified secondary loop (TCS). The TCS then pumps this Chilled Water/Coolant directly through specialized manifolds and fluid conduits into the liquid-cooled Server Rack (e.g., via direct-to-chip cold plates).
  • Application: Critical for high-density deployments, such as GPU-accelerated AI servers, where air cooling alone is insufficient.

Summary

The diagram demonstrates a highly efficient, modern Hybrid Data Center Cooling Architecture. By leveraging a centralized primary chilling system (CWS & FWS), the facility successfully bifurcates its cooling delivery: utilizing traditional air cooling (CRAC/CRAH) for standard infrastructure while concurrently deploying precise, high-efficiency liquid cooling (CDU & TCS) to sustain high-density AI server racks.

#DataCenter #AIInfrastructure #LiquidCooling #TCS #CDU #ChilledWaterSystem #AIDC #MechanicalEngineering #ThermalManagement

Data Center Power

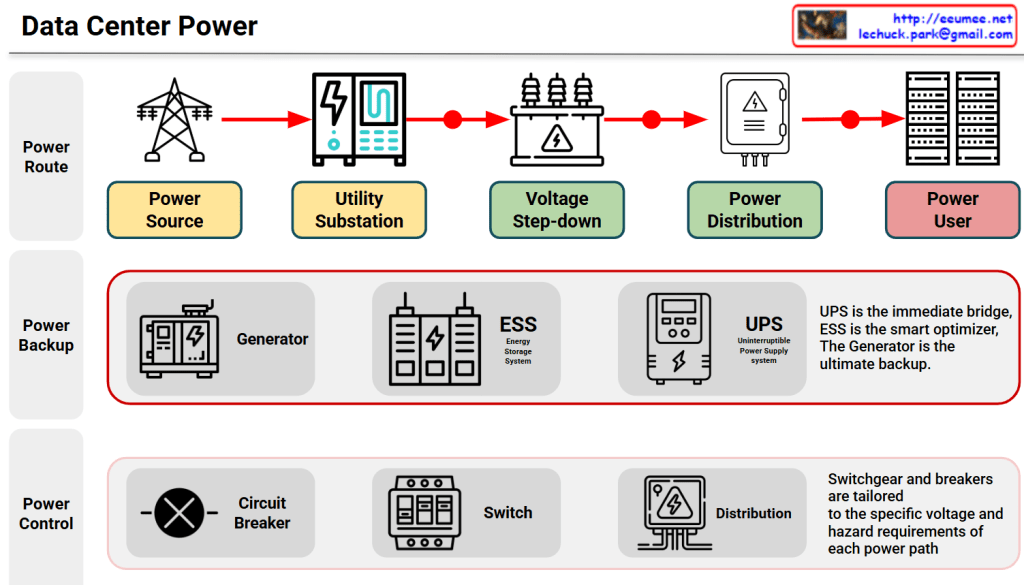
This diagram, provides a comprehensive and easy-to-understand overview of a Data Center Power Architecture. It breaks down the complex electrical infrastructure into three main functional layers: Power Route, Power Backup, and Power Control.

1. Power Route (The Main Flow of Electricity)

This top layer illustrates the journey of electricity from the grid all the way to the servers.

  • Power Source: This is the starting point where high-voltage electricity is delivered from the external power grid or power plants.
  • Utility Substation: The high-voltage power first enters the data center’s dedicated substation to be safely received and managed.
  • Voltage Step-down: Because grid voltage is way too high for servers, heavy-duty transformers step down the voltage to a lower, safer operating level.
  • Power Distribution: The stepped-down electricity is split and routed into various distribution switchboards and panels.
  • Power User: The final destination. Clean, stable power is delivered directly to the high-density IT racks and servers.

2. Power Backup (The Safety Net)

This layer ensures the data center remains fully operational even during severe grid failures or blackouts. It highlights three critical components:

  • Generator: The ultimate powerhouse for long-term survival. It takes a few seconds to start up but can supply continuous power for days during extended outages.
  • ESS (Energy Storage System): The smart optimizer. It strategically saves energy when power is cheap and discharges it during peak demand to cut costs and improve efficiency.
  • UPS (Uninterruptible Power Supply): The zero-second shield. It provides instant battery power the exact millisecond a blackout occurs so that servers never drop a single packet.

Key Concept: “UPS is the immediate bridge, ESS is the smart optimizer, and the Generator is the ultimate backup.”

3. Power Control (The Guard and Router)

The bottom layer focuses on the safety and granular control of the electricity flowing through the system.

  • Circuit Breaker: Automatically cuts off the electrical flow instantly if a short circuit or overload is detected, protecting expensive equipment from catching fire.
  • Switch: Allows operators to manually or automatically redirect power paths for maintenance or load balancing.
  • Distribution: Fine-tunes and splits the power safely down to the individual hardware level.

Key Concept: “Switchgear and breakers are tailored to the specific voltage and hazard requirements of each power path.”

📝 In Summary

The architecture shown how a modern data center achieves maximum uptime. Power Route brings the electricity in, Power Backup ensures it never goes dark, and Power Control guarantees that the entire flow remains safe, stable, and highly optimized.

#DataCenter #AIDC #PowerInfrastructure #UPS #ESS #BackupGenerator #ElectricalEngineering #Switchgear #DataCenterDesign

AI DC : CAPEX to OPEX (2) inside


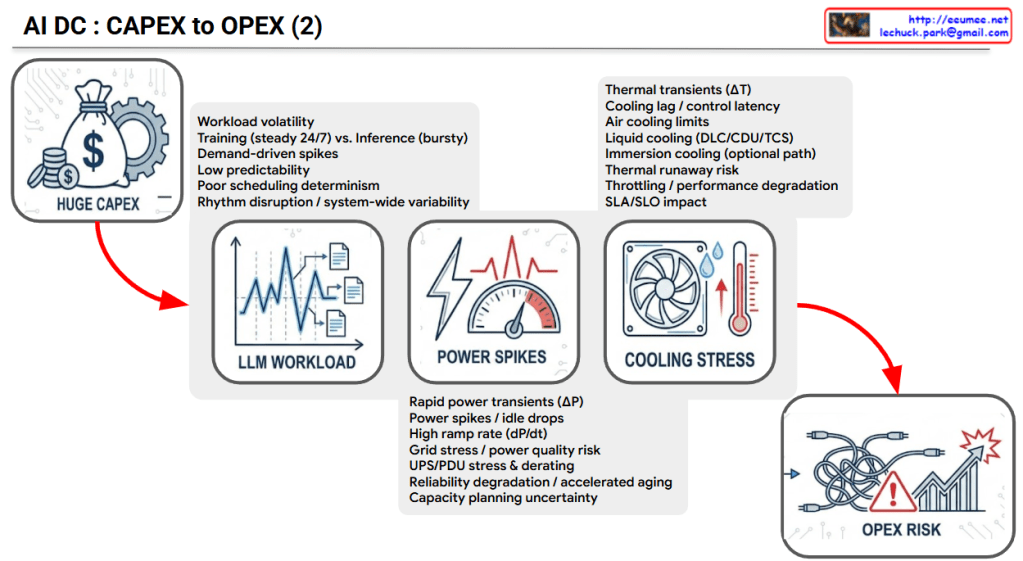
AI DC: The Chain Reaction from CAPEX to OPEX Risk

The provided image logically illustrates the sequential mechanism of how the massive initial capital expenditure (CAPEX) of an AI Data Center (AI DC) translates into complex operational risks and increased operating expenses (OPEX).

1. HUGE CAPEX (Massive Initial Investment)

  • Context: Building an AI data center requires enormous capital expenditure (CAPEX) due to high-cost GPU servers, high-density racks, and specialized networking infrastructure.
  • Flow: However, the challenge does not end with high initial costs. Driven by the following three factors, this massive infrastructure investment inevitably cascades into severe operational risks.

2. LLM WORKLOAD (The Root Cause)

  • Characteristics: Unlike traditional IT workloads, AI (especially LLM) workloads are highly volatile and unpredictable.
  • Key Factors: * The continuous, heavy load of Training (steady 24/7) mixed with the bursty, erratic nature of Inference.
    • Demand-driven spikes and low predictability, which lead to poor scheduling determinism and system-wide rhythm disruption.

3. POWER SPIKES (Electrical Infrastructure Stress)

  • Characteristics: The extreme volatility of LLM workloads causes sudden, extreme fluctuations in server power consumption.
  • Key Factors:
    • Rapid power transients (ΔP) and high ramp rates (dP/dt) create sudden power spikes and idle drops.
    • These fluctuations cause significant grid stress, accelerate the aging of power distribution equipment (UPS/PDU stress & derating), degrade overall system reliability, and create major capacity planning uncertainty.

4. COOLING STRESS (Thermal System Stress)

  • Characteristics: Sudden surges in power consumption immediately translate into rapid temperature increases (Thermal transients, ΔT).
  • Key Factors:
    • Cooling lag / control latency: There is an inevitable delay between the sudden heat generation and the cooling system’s physical response.
    • Physical limits: Traditional air cooling hits its limits, forcing transitions to Liquid cooling (DLC/CDU) or Immersion cooling. Failure to manage this latency increases the risk of thermal runaway, triggers system throttling (performance degradation), and negatively impacts SLAs/SLOs.

5. OPEX RISK (The Final Operational Consequence)

  • Context: The combination of unpredictable LLM workloads, power infrastructure stress, and cooling system limitations culminates in severe OPEX Risk.
  • Conclusion: Ultimately, this chain reaction exponentially increases daily operational costs and uncertainties—ranging from accelerated equipment replacement costs and higher power bills (due to degraded PUE) to massive expenses related to frequent incident responses and infrastructure instability.

Summary:

The slide delivers a powerful message: While the physical construction of an AI data center is highly expensive (CAPEX), the true danger lies in the unique volatility of AI workloads. This volatility triggers extreme power (ΔP) and thermal (ΔT) spikes. If these physical transients are not strictly managed, the operational costs and risks (OPEX) will spiral completely out of control.

#AIDataCenter #AIDC #CAPEX #OPEX #LLMWorkload #PowerSpikes #CoolingStress #LiquidCooling #ThermalManagement #DataCenterInfrastructure #GPUInfrastructure #OPEXRisk

With Gemini