Power Capping in the Linux kernel

Power Capping in the Linux Kernel

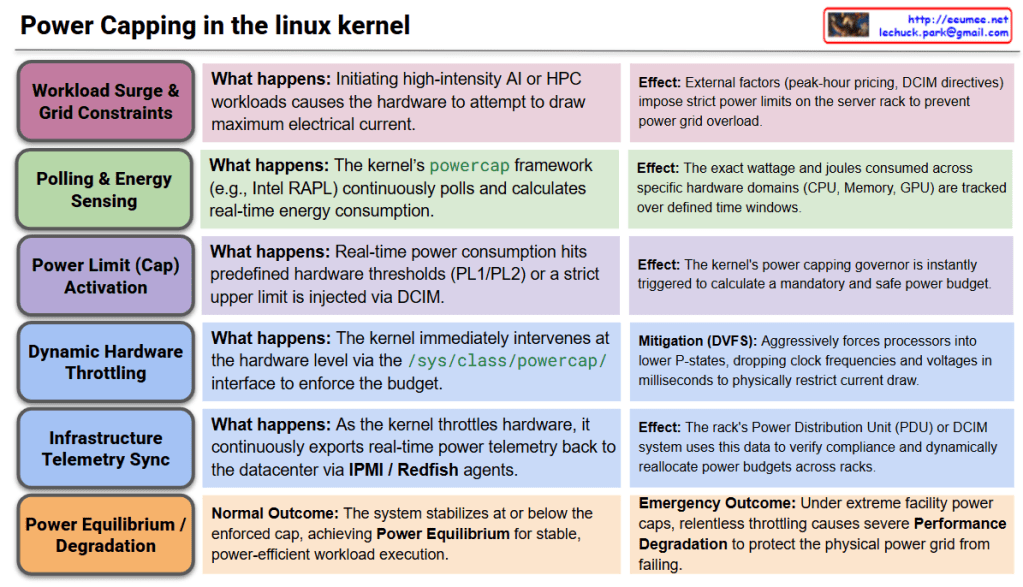
This architecture outlines the closed-loop logic flow of the Linux kernel’s powercap framework. It details how the kernel enforces strict energy limits on hardware to manage heavy AI workloads while coordinating with the datacenter’s external power grid and infrastructure.

  • Stage 1: Workload Surge & Power Grid ConstraintsWhen high-intensity AI or HPC workloads are dispatched, the hardware immediately attempts to draw maximum electrical current. Concurrently, external factors—such as peak-hour electricity pricing, facility power limits, or a Datacenter Infrastructure Management (DCIM) directive—may impose strict power constraints on the server rack.
  • Stage 2: Polling & Energy SensingTo monitor power draw, the kernel’s powercap framework utilizes hardware interfaces like Intel RAPL (Running Average Power Limit) or AMD Node Manager. It continuously polls and calculates real-time energy consumption, tracking the exact wattage and joules consumed across specific hardware domains (CPU, memory, GPU) over defined time windows.
  • Stage 3: Power Limit (Cap) ActivationIf the real-time power consumption hits predefined hardware thresholds (such as PL1 or PL2 limits), or if an external DCIM system injects a strict upper power limit via the /sys/class/powercap/ interface, the kernel’s power capping governor is instantly triggered into action.
  • Stage 4: Dynamic Hardware Throttling (Local Mitigation)To enforce the mandatory power budget, the kernel immediately intervenes at the hardware level. It aggressively utilizes DVFS (Dynamic Voltage and Frequency Scaling) to force the processors into lower P-states, dropping clock frequencies and voltages within milliseconds to physically restrict the electrical current draw.
  • Stage 5: Infrastructure Telemetry Sync (Global Mitigation)As the kernel throttles the hardware, it continuously exports real-time power telemetry back to the datacenter’s control plane via IPMI/Redfish agents. The rack’s Power Distribution Unit (PDU) or DCIM system uses this data to verify compliance with the power cap, allowing the facility to dynamically reallocate power budgets across different server racks.
  • Stage 6: Power Equilibrium / Performance Degradation
    • Normal Outcome: The system successfully stabilizes at or below the enforced power cap, achieving Power Equilibrium. The workload continues to execute stably, though at a dynamically calculated, power-efficient pace.
    • Emergency/Degraded Outcome: If the datacenter imposes an extreme power cap (e.g., during a facility power emergency), the kernel will relentlessly throttle the hardware. This causes severe Performance Degradation for the workload, but it successfully prevents catastrophic outcomes like tripping the datacenter’s power breakers.

Summary

  • The Linux kernel uses frameworks like RAPL to continuously monitor and calculate the exact energy consumption of server components during heavy workloads.
  • When hardware limits are reached or external datacenter power caps are applied, the kernel instantly throttles CPU/GPU frequencies and voltages to restrict electrical draw.
  • This system ensures the server stays strictly within its assigned power budget, sacrificing raw performance if necessary to protect the datacenter’s physical power grid from failing.

#LinuxKernel #PowerCapping #RAPL #PowerManagement #DataCenterInfrastructure #GreenComputing #HPC #DCIM #EnergyEfficiency

Thermal Management in the Linux kernel

Thermal Management in the Linux Kernel

This diagram illustrates the closed-loop architecture of the Linux kernel’s thermal management subsystem, specifically detailing how it handles heavy AI workloads by coordinating both internal server hardware and external datacenter cooling infrastructure. The process is broken down into six sequential stages:

  • Stage 1: Workload InitializationWhen a high-intensity AI or LLM task is dispatched, it causes an immediate surge in electrical current across the hardware transistors. As a direct physical effect, the internal die temperature of the accelerator spikes within mere milliseconds.
  • Stage 2: Polling & SensingTo monitor this heat, the kernel utilizes hardware monitoring (hwmon) and ACPI drivers to continuously read data from internal Digital Thermal Sensors. This raw temperature data is mapped into an abstracted “Thermal Zone” and constantly compared against predefined safety thresholds known as “Trip Points.”
  • Stage 3: Trip Point & Governor ActivationIf the temperature crosses a specific threshold (such as a Warning Trip Point), it triggers a Thermal Governor, like the Intelligent Power Allocation (IPA) or Step Wise governor. This governor uses PID control algorithms to calculate a safe “Thermal Budget” that the hardware can sustain without damage.
  • Stage 4: Passive & Active CoolingBased on the calculated budget, the kernel initiates local mitigation through registered Cooling Devices. Active cooling involves instantly cranking up the internal server fan RPMs. Passive cooling relies on Dynamic Voltage and Frequency Scaling (DVFS), interacting with cpufreq to throttle clock speeds and lower voltages, thereby suppressing heat generation at the silicon level.
  • Stage 5: Infrastructure Telemetry SyncIf local cooling is insufficient to handle the load, the kernel exports real-time thermal telemetry via sysfs and IPMI/Redfish agents. The external datacenter infrastructure—specifically the Coolant Distribution Unit (CDU) or Chiller—receives this data and dynamically increases the liquid coolant flow rate directed to that specific server rack. ( Kernel works with BMC & DCIM/BMS.)
  • Stage 6: Thermal Equilibrium / EmergencyThe system continuously evaluates the outcome of these mitigations. Under normal conditions, the cooling capacity matches the heat generation, achieving a state of “Thermal Equilibrium” that allows the workload to run continuously and stably. However, if cooling fails and a Critical Trip Point is breached, the kernel immediately triggers an Emergency Shutdown to protect the hardware from permanent damage.

Summary

  • The Linux kernel continuously monitors hardware temperatures and maps them to virtual Thermal Zones to detect sudden heat spikes caused by heavy AI workloads.
  • Upon reaching safety thresholds, the kernel’s Thermal Governor simultaneously throttles CPU/GPU performance (local) and signals the datacenter’s CDU to increase liquid coolant flow (global).
  • This closed-loop system ultimately aims to achieve thermal equilibrium for stable high-performance computing, or safely halts the system if critical failure conditions are met.

#LinuxKernel #ThermalManagement #DataCenterInfrastructure #LiquidCooling #HPC #AIWorkloads #GreenComputing #ServerArchitecture

With Gemini

Power/Cooling in the linux kernel

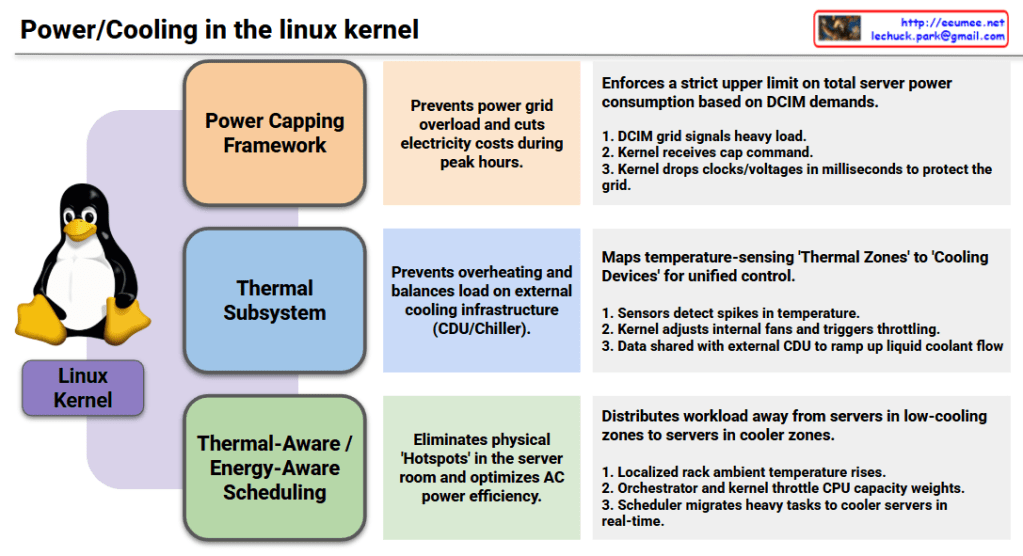
1. Power Capping Framework

  • Objective (Center): Prevents power grid overload and cuts electricity costs during peak hours.
  • Mechanism (Right): Enforces a strict upper limit on total server power consumption based on DCIM (Datacenter Infrastructure Management) demands.
    1. The DCIM grid signals a heavy load status.
    2. The Linux kernel receives the specific power capping command.
    3. The kernel immediately drops processor clocks and voltages in milliseconds to protect the local power grid.

2. Thermal Subsystem

  • Objective (Center): Prevents hardware overheating and balances the load on external cooling infrastructure, such as Coolant Distribution Units (CDUs) and chillers.
  • Mechanism (Right): Maps temperature-sensing ‘Thermal Zones’ directly to hardware ‘Cooling Devices’ for unified, holistic control.
    1. Hardware sensors detect sudden spikes in internal temperature.
    2. The kernel dynamically adjusts internal server fans and triggers safety throttling.
    3. Temperature telemetry data is actively shared with the external datacenter CDU to ramp up liquid coolant flow rates.

3. Thermal-Aware / Energy-Aware Scheduling

  • Objective (Center): Eliminates physical ‘Hotspots’ within the server room layout and optimizes overall air conditioning (AC) power efficiency.
  • Mechanism (Right): Distributes heavy workloads away from physical servers trapped in low-cooling zones to servers located in cooler zones.
    1. The localized ambient temperature around a specific server rack rises.
    2. The datacenter orchestrator and the kernel work together to throttle the target CPU’s capacity weights.
    3. The Linux scheduler automatically migrates heavy compute tasks to cooler servers across the room in real-time.

Modern Linux has evolved beyond managing isolated servers; it now acts as a holistic orchestrator that treats the datacenter’s power grid, liquid cooling loops, and air conditioning as a single, unified organism.

#LinuxKernel #PowerManagement #ThermalSubsystem #EnergyAwareScheduling #DatacenterInfrastructure #DCIM #LiquidCooling #GreenComputing #HPC #InfrastructureAutomation #CloudInfrastructure

With Gemini

Sag & Swell

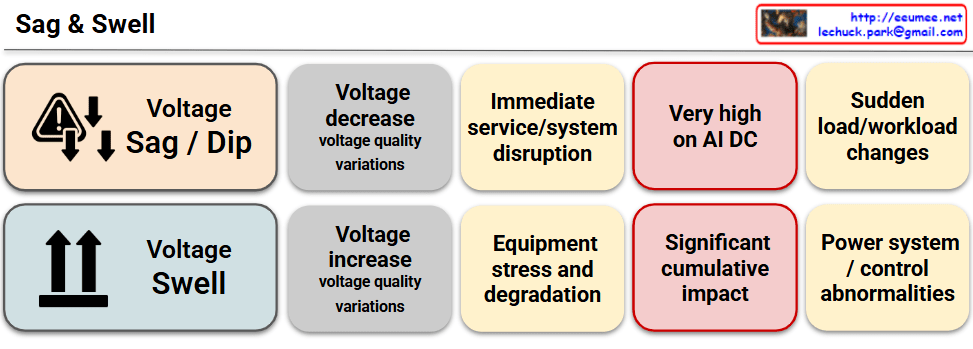
The image provides a clear, side-by-side comparison of two major power quality issues: Voltage Sag (or Dip) and Voltage Swell. It looks like a great summary graphic prepared for your tech blog at eeumee.net, particularly because it sharply highlights how these electrical phenomena specifically impact AI Data Centers (AI DC).

1. Voltage Sag / Dip

  • Definition: A sudden, momentary decrease in voltage.
  • System Impact: It causes immediate service and system disruption. If the voltage drops too low, servers can suddenly power off or reboot.
  • AI DC Relevance: Noted as “Very high on AI DC.” The risk and frequency are elevated in AI environments.
  • Root Cause: This is primarily driven by sudden load or workload changes. When thousands of GPUs simultaneously spin up for intensive AI training or inference tasks, they draw massive amounts of current in an instant, causing the voltage to dip.

2. Voltage Swell

  • Definition: A sudden, momentary increase in voltage.
  • System Impact: Unlike a sag, a swell might not cause an immediate outage, but it forces overvoltage through the components, leading to equipment stress and degradation.
  • AI DC Relevance: It carries a significant cumulative impact. The hardware damage builds up over time, eventually leading to premature component failure.
  • Root Cause: Typically triggered by power system or control abnormalities, or when a massive electrical load is suddenly dropped from the grid.

💡 Core Insight

This slide captures why power dynamics in AI Data Centers are vastly different from traditional IT environments. The extreme, dynamic power fluctuations inherent to AI workloads make rigorous power quality monitoring (via DCIM) and the implementation of highly responsive, advanced power architectures—such as Battery Energy Storage Systems (BESS)—absolutely critical to maintaining uptime and protecting expensive hardware.

#AIDataCenter #PowerQuality #VoltageSag #VoltageSwell #DataCenterInfrastructure #TechBlog #GPUWorkloads #ServerCooling

With Gemini

New Risk @ AI DC

Overview: New Risks at AI Data Centers

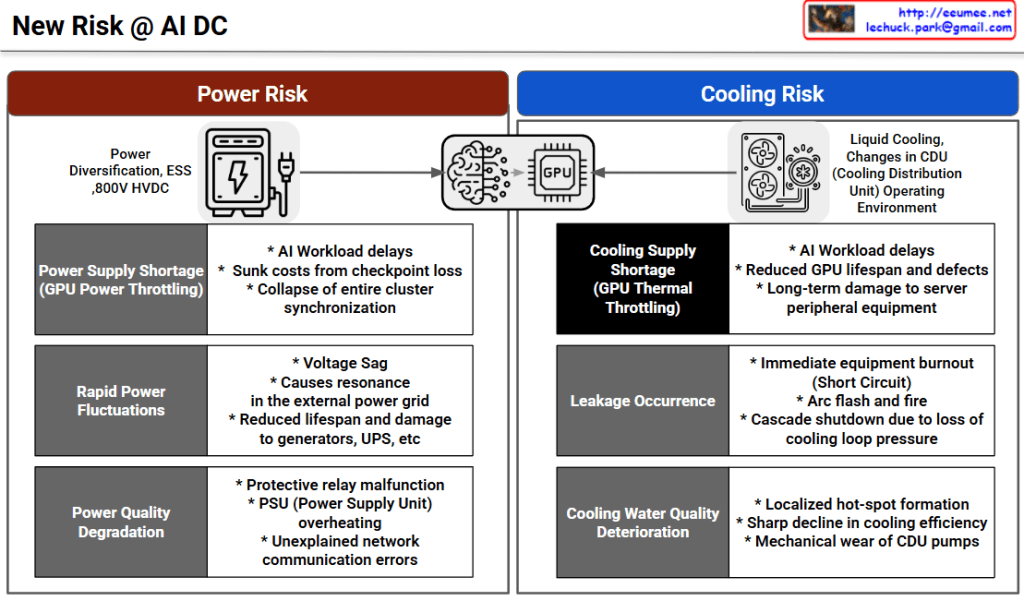
The image outlines the infrastructure challenges faced by modern AI Data Centers (AI DC), specifically focusing on the high demands placed on hardware like GPUs. It divides these challenges into two primary categories: Power Risk and Cooling Risk.

The central graphic illustrates that the core AI processing units (Brains/GPUs) are entirely dependent on these two foundational elements.


⚡ Power Risk

This section highlights issues related to power supply and infrastructure (such as Power Diversification, ESS, and 800V HVDC).

  • Power Supply Shortage (GPU Power Throttling): When the facility cannot provide enough power, GPUs slow down to compensate.
    • Impacts: Delays in AI workloads, financial losses due to lost data checkpoints, and the collapse of synchronization across the entire computing cluster.
  • Rapid Power Fluctuations: Sudden spikes or drops in the power supply.
    • Impacts: Voltage sag, electrical resonance in external grids, and reduced lifespan or physical damage to backup power systems like generators and UPS (Uninterruptible Power Supplies).
  • Power Quality Degradation: When the provided electricity is “noisy” or unstable.
    • Impacts: Malfunctions in protective electrical relays, overheating of server Power Supply Units (PSUs), and unexplained network communication errors.

❄️ Cooling Risk

This section focuses on the challenges of managing the massive heat generated by AI workloads, specifically looking at Liquid Cooling and changes in Cooling Distribution Unit (CDU) environments.

  • Cooling Supply Shortage (GPU Thermal Throttling): When the cooling system cannot remove heat fast enough, GPUs slow down to prevent melting.
    • Impacts: Delays in AI workloads, reduced lifespan and increased defects in GPUs, and long-term damage to surrounding server equipment.
  • Leakage Occurrence: Physical leaks in the liquid cooling system.
    • Impacts: Immediate equipment burnout (short circuits), risk of electrical arc flashes and fires, and cascading system shutdowns due to a loss of pressure in the cooling loop.
  • Cooling Water Quality Deterioration: When the liquid used for cooling becomes contaminated or degrades.
    • Impacts: Formation of localized “hot-spots” where cooling fails, a sharp decline in overall cooling efficiency, and mechanical wear and tear on the CDU pumps.

📝 Summary

  1. AI Data Centers face critical new infrastructure risks divided into two main categories: supplying massive amounts of power and managing extreme heat.
  2. Power-related risks (shortages, fluctuations, and poor quality) lead to severe workload delays, cluster synchronization failures, and damage to backup generators.
  3. Cooling-related risks (insufficient cooling, leaks, and poor water quality) cause thermal throttling, severe hardware damage, and potentially catastrophic fires.

#AIDataCenter #DataCenterInfrastructure #GPUPower #LiquidCooling #DataCenterRisk #ThermalThrottling #TechInfrastructure

With Gemini

AI DC : CAPEX to OPEX (2) inside


AI DC: The Chain Reaction from CAPEX to OPEX Risk

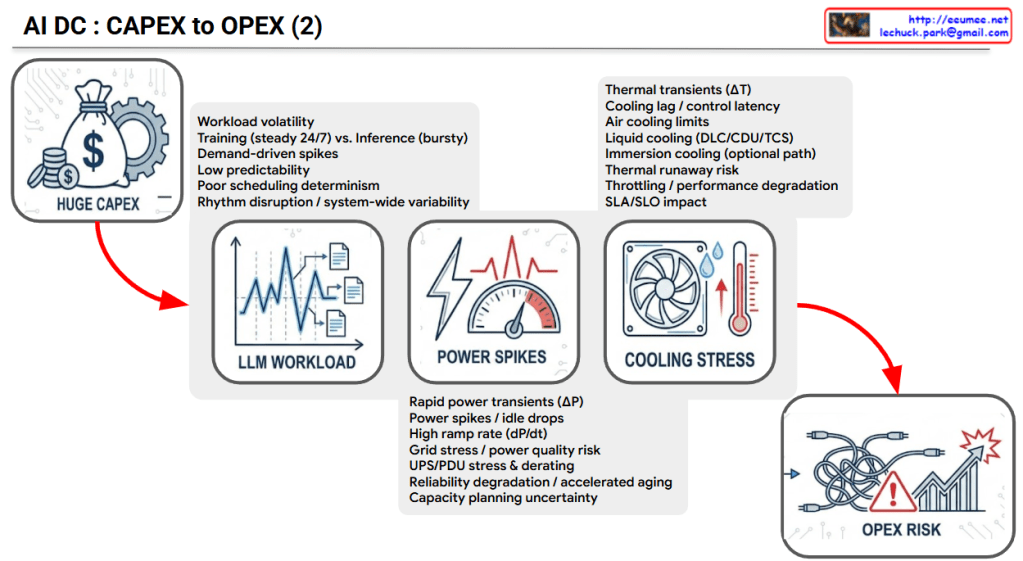
The provided image logically illustrates the sequential mechanism of how the massive initial capital expenditure (CAPEX) of an AI Data Center (AI DC) translates into complex operational risks and increased operating expenses (OPEX).

1. HUGE CAPEX (Massive Initial Investment)

  • Context: Building an AI data center requires enormous capital expenditure (CAPEX) due to high-cost GPU servers, high-density racks, and specialized networking infrastructure.
  • Flow: However, the challenge does not end with high initial costs. Driven by the following three factors, this massive infrastructure investment inevitably cascades into severe operational risks.

2. LLM WORKLOAD (The Root Cause)

  • Characteristics: Unlike traditional IT workloads, AI (especially LLM) workloads are highly volatile and unpredictable.
  • Key Factors: * The continuous, heavy load of Training (steady 24/7) mixed with the bursty, erratic nature of Inference.
    • Demand-driven spikes and low predictability, which lead to poor scheduling determinism and system-wide rhythm disruption.

3. POWER SPIKES (Electrical Infrastructure Stress)

  • Characteristics: The extreme volatility of LLM workloads causes sudden, extreme fluctuations in server power consumption.
  • Key Factors:
    • Rapid power transients (ΔP) and high ramp rates (dP/dt) create sudden power spikes and idle drops.
    • These fluctuations cause significant grid stress, accelerate the aging of power distribution equipment (UPS/PDU stress & derating), degrade overall system reliability, and create major capacity planning uncertainty.

4. COOLING STRESS (Thermal System Stress)

  • Characteristics: Sudden surges in power consumption immediately translate into rapid temperature increases (Thermal transients, ΔT).
  • Key Factors:
    • Cooling lag / control latency: There is an inevitable delay between the sudden heat generation and the cooling system’s physical response.
    • Physical limits: Traditional air cooling hits its limits, forcing transitions to Liquid cooling (DLC/CDU) or Immersion cooling. Failure to manage this latency increases the risk of thermal runaway, triggers system throttling (performance degradation), and negatively impacts SLAs/SLOs.

5. OPEX RISK (The Final Operational Consequence)

  • Context: The combination of unpredictable LLM workloads, power infrastructure stress, and cooling system limitations culminates in severe OPEX Risk.
  • Conclusion: Ultimately, this chain reaction exponentially increases daily operational costs and uncertainties—ranging from accelerated equipment replacement costs and higher power bills (due to degraded PUE) to massive expenses related to frequent incident responses and infrastructure instability.

Summary:

The slide delivers a powerful message: While the physical construction of an AI data center is highly expensive (CAPEX), the true danger lies in the unique volatility of AI workloads. This volatility triggers extreme power (ΔP) and thermal (ΔT) spikes. If these physical transients are not strictly managed, the operational costs and risks (OPEX) will spiral completely out of control.

#AIDataCenter #AIDC #CAPEX #OPEX #LLMWorkload #PowerSpikes #CoolingStress #LiquidCooling #ThermalManagement #DataCenterInfrastructure #GPUInfrastructure #OPEXRisk

With Gemini

AI-Driven Proactive Cooling Architecture

The provided image illustrates an AI-Driven Proactive Cooling Architecture, detailing a sophisticated pipeline that transforms operational data into precise thermal management.


1. The Proactive Data Hierarchy

The architecture categorizes data sources along a spectrum, moving from “More Proactive” (predicting future heat) to “Reactive” (measuring existing heat).

  • LLM Job Schedule (Most Proactive): This layer looks at the job queue, node thermal headroom, and resource availability. It allows the system to prepare for heat before the first calculation even begins.
  • LLM Workload: Monitors real-time GPU utilization (%) and token throughput to understand the intensity of the current processing task.
  • GPU / HBM: Captures direct hardware telemetry, including GPU power draw (Watts) and High Bandwidth Memory (HBM) temperatures.
  • Server Internal Temperature: Measures the junction temperature, fan/pump speeds, and the $\Delta T$ (temperature difference) between server inlet and outlet.
  • Floor & Rack Temperature (Reactive): The traditional monitoring layer that identifies hot spots and rack density (kW) once heat has already entered the environment.

2. The Analysis and Response Loop

The bottom section of the diagram shows how this multi-layered data is converted into action:

  • Gathering Data: Telemetry from all five layers is aggregated into a central repository.
  • Analysis with ML: A Machine Learning engine processes this data to predict thermal trends. It doesn’t just look at where the temperature is now, but where it will be in the next few minutes based on the workload.
  • Cooling Response: The ML insights trigger physical adjustments in the cooling infrastructure, specifically controlling the $\Delta T$ (Supply/Return) and Flow Rate (LPM – Liters Per Minute) of the coolant.

3. Technical Significance

By shifting the control logic “left” (toward the LLM Job Schedule), data centers can eliminate the thermal lag inherent in traditional systems. This is particularly critical for AI infrastructure, where GPU power consumption can spike almost instantaneously, often faster than traditional mechanical cooling systems can ramp up.


Summary

  1. This architecture shifts cooling from a reactive sensor-based model to a proactive workload-aware model using AI/ML.
  2. It integrates data across the entire stack, from high-level LLM job queues down to chip-level GPU power draw and rack temperatures.
  3. The ML engine predicts thermal demand to dynamically adjust coolant flow rates and supply temperatures, significantly improving energy efficiency and hardware longevity.

#AICooling #DataCenterInfrastructure #ProactiveCooling #GPUManagement #LiquidCooling #LLMOps #ThermalManagement #EnergyEfficiency #SmartDC

With Gemini