Power To Thermal Latency

The provided image illustrates a smart thermal management process that utilizes Artificial Intelligence (AI) and Digital Twin technology to control cooling systems “preemptively” in data centers or high-performance computing environments. The provided image, image_b7b685.png, illustrates a smart thermal management process that utilizes Artificial Intelligence (AI) and Digital Twin technology to control cooling systems “preemptively” in data centers or high-performance computing environments.

The timeline at the top of the image highlights the core concept: “Power To Thermal Latency.” It shows that there is a physical delay of approximately 8 seconds from the moment a power spike occurs in the GPU (T=0s) to when the actual heat arrives (T=~8s). The system operates in a 4-phase process to execute cooling in advance during this critical 8-second window before the heat even hits.

  • PHASE 1: INPUT DATA
    • GPU Telemetry: Real-time data regarding power consumption (POWER, W) and processing tasks (WORKLOAD) is collected from the GPU.
    • CDU Telemetry: Data such as coolant flow rate (FLOW, LPM) and supply/return temperatures (TEMP) is gathered from the Cooling Distribution Unit (CDU).
  • PHASE 2: ANALYTICS (AI Prediction)
    • Digital Twin & Thermal Analysis: All data collected in Phase 1 is fed into an AI brain. Here, the system calculates the Power to Thermal Latency (PTL), predicts the impending heat load, and computes the exact cooling demand required to handle it.
  • PHASE 3: CONTROL (Logic & Signal)
    • Cooling Logic & Orchestration: Based on the AI’s predictions, the system performs PID tuning and optimizes the cooling strategy. It then issues a “Cooling Signal” that triggers “PREEMPTIVE COOLING.” The first dotted vertical line on the timeline marks the exact moment this preemptive decision is made.
  • PHASE 4: AUCTIONATION / ACTUATION (Preemptive Execution)
    • CDU Actuation: Upon receiving the signal, the hardware executes a “PREEMPTIVE COOLING ACTION” well before the thermal arrival. It pre-adjusts the Pump Variable Frequency Drive (PUMP VFD) and Valve Position. As a result, an “ENHANCED COOLANT FLOW” is delivered directly to the GPU right before the heat strikes, preventing overheating at its source. (Note: The phase arrow reads “AUCTIONATION,” but contextually refers to “ACTUATION” of the hardware.)

💡 Summary

This image demonstrates a predictive, Digital Twin-based proactive cooling architecture for data centers. By capitalizing on the ~8-second latency between a GPU power spike and the resulting heat generation, the AI predicts future thermal loads. It then proactively adjusts coolant pumps and valves to supply an “Enhanced Coolant Flow” before the heat actually arrives. This preemptive closed-loop process maximizes cooling efficiency and prevents hardware overheating.This image demonstrates a predictive, Digital Twin-based proactive cooling architecture for data centers. By capitalizing on the ~8-second latency between a GPU power spike and the resulting heat generation, the AI predicts future thermal loads. It then proactively adjusts coolant pumps and valves to supply an “Enhanced Coolant Flow” before the heat actually arrives. This preemptive closed-loop process maximizes cooling efficiency and prevents hardware overheating.

#DataCenterCooling #DigitalTwin #PreemptiveCooling #ThermalManagement #GPUCooling #AICooling #SmartCooling #PowerToThermalLatency #AIAnalytics #CDU

With Gemini

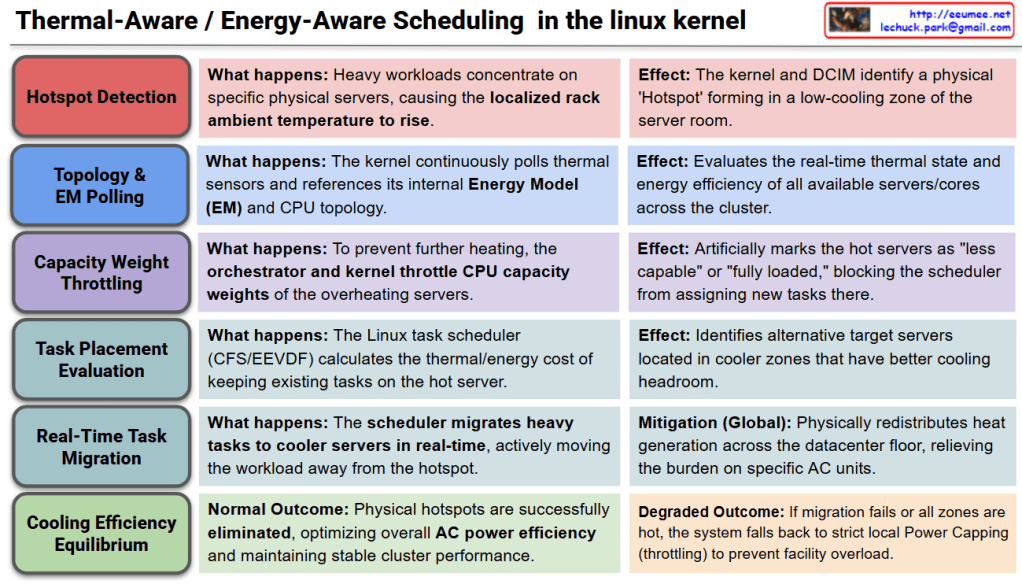
Thermal-Aware / Energy-Aware Scheduling in the Linux kernel

Thermal-Aware / Energy-Aware Scheduling

This diagram illustrates the macro-level, spatial cooling strategy within the Linux kernel. Instead of merely throttling hardware locally, the scheduler actively redistributes workloads across the datacenter floor to optimize overall cooling infrastructure. The process is broken down into six sequential stages:

  • Stage 1: Hotspot DetectionWhen heavy compute workloads concentrate heavily on specific physical servers, the localized ambient temperature around that rack begins to rise. As a result, the Linux kernel and the Datacenter Infrastructure Management (DCIM) system detect a physical ‘Hotspot’ forming within a low-cooling zone of the server room.
  • Stage 2: Topology & EM PollingTo assess the cluster’s environment, the kernel continuously polls hardware thermal sensors and cross-references this data with its internal Energy Model (EM) and CPU topology. This allows the system to evaluate the real-time thermal state and power efficiency of all available servers and cores across the entire cluster.
  • Stage 3: Capacity Weight ThrottlingTo prevent the hotspot from worsening, the cluster orchestrator and the local kernel intervene by artificially throttling the CPU capacity weights of the overheating servers. This mechanism marks the hot servers as “less capable” or “fully loaded” to the system, effectively blocking the scheduler from assigning any new tasks to that specific physical location.
  • Stage 4: Task Placement EvaluationThe Linux task scheduler (such as CFS or EEVDF) calculates the thermal and energy cost of keeping currently running tasks on the hot server. It evaluates the previously polled topology data to identify alternative target servers located in cooler zones that possess better cooling headroom.
  • Stage 5: Real-Time Task MigrationIn a decisive global mitigation step, the scheduler actively migrates heavy tasks to the cooler servers in real-time. By physically moving the workload away from the hotspot, the kernel seamlessly redistributes heat generation across the datacenter floor, immediately relieving the thermal burden on specific Air Conditioning (AC) units.
  • Stage 6: Cooling Efficiency Equilibrium
    • Normal Outcome: The physical hotspots are successfully eliminated. The datacenter achieves an optimal thermal equilibrium, maximizing overall AC power efficiency while maintaining stable, high-performance cluster operations.
    • Degraded Outcome: If task migration is impossible (e.g., all zones in the datacenter are equally hot), the system abandons spatial scheduling and falls back to strict local Power Capping (aggressive frequency/voltage throttling) to prevent total facility overload.

Summary

  • Unlike traditional local throttling, Energy-Aware Scheduling actively detects physical “hotspots” in the datacenter and artificially lowers the compute capacity weight of overheating servers.
  • The Linux scheduler utilizes its Energy Model (EM) to identify cooler servers and actively migrates heavy AI workloads away from the hotspot in real-time.
  • This macro-level load balancing redistributes heat generation across the datacenter floor, maximizing overall AC cooling efficiency and preventing localized cooling failures.

#LinuxKernel #EnergyAwareScheduling #ThermalManagement #DataCenterOptimization #TaskMigration #GreenComputing #HPC #CloudInfrastructure

Thermal Management in the Linux kernel

Thermal Management in the Linux Kernel

This diagram illustrates the closed-loop architecture of the Linux kernel’s thermal management subsystem, specifically detailing how it handles heavy AI workloads by coordinating both internal server hardware and external datacenter cooling infrastructure. The process is broken down into six sequential stages:

  • Stage 1: Workload InitializationWhen a high-intensity AI or LLM task is dispatched, it causes an immediate surge in electrical current across the hardware transistors. As a direct physical effect, the internal die temperature of the accelerator spikes within mere milliseconds.
  • Stage 2: Polling & SensingTo monitor this heat, the kernel utilizes hardware monitoring (hwmon) and ACPI drivers to continuously read data from internal Digital Thermal Sensors. This raw temperature data is mapped into an abstracted “Thermal Zone” and constantly compared against predefined safety thresholds known as “Trip Points.”
  • Stage 3: Trip Point & Governor ActivationIf the temperature crosses a specific threshold (such as a Warning Trip Point), it triggers a Thermal Governor, like the Intelligent Power Allocation (IPA) or Step Wise governor. This governor uses PID control algorithms to calculate a safe “Thermal Budget” that the hardware can sustain without damage.
  • Stage 4: Passive & Active CoolingBased on the calculated budget, the kernel initiates local mitigation through registered Cooling Devices. Active cooling involves instantly cranking up the internal server fan RPMs. Passive cooling relies on Dynamic Voltage and Frequency Scaling (DVFS), interacting with cpufreq to throttle clock speeds and lower voltages, thereby suppressing heat generation at the silicon level.
  • Stage 5: Infrastructure Telemetry SyncIf local cooling is insufficient to handle the load, the kernel exports real-time thermal telemetry via sysfs and IPMI/Redfish agents. The external datacenter infrastructure—specifically the Coolant Distribution Unit (CDU) or Chiller—receives this data and dynamically increases the liquid coolant flow rate directed to that specific server rack. ( Kernel works with BMC & DCIM/BMS.)
  • Stage 6: Thermal Equilibrium / EmergencyThe system continuously evaluates the outcome of these mitigations. Under normal conditions, the cooling capacity matches the heat generation, achieving a state of “Thermal Equilibrium” that allows the workload to run continuously and stably. However, if cooling fails and a Critical Trip Point is breached, the kernel immediately triggers an Emergency Shutdown to protect the hardware from permanent damage.

Summary

  • The Linux kernel continuously monitors hardware temperatures and maps them to virtual Thermal Zones to detect sudden heat spikes caused by heavy AI workloads.
  • Upon reaching safety thresholds, the kernel’s Thermal Governor simultaneously throttles CPU/GPU performance (local) and signals the datacenter’s CDU to increase liquid coolant flow (global).
  • This closed-loop system ultimately aims to achieve thermal equilibrium for stable high-performance computing, or safely halts the system if critical failure conditions are met.

#LinuxKernel #ThermalManagement #DataCenterInfrastructure #LiquidCooling #HPC #AIWorkloads #GreenComputing #ServerArchitecture

With Gemini

AI optimization

AI Optimization Diagram Interpretation

The provided diagram, titled “AI Optimization,” illustrates the process of AI learning and inference in relation to data flow, along with the physical hardware infrastructure optimization (power and thermal management) required to sustain it. It goes beyond simple software algorithms to provide architectural insights into AI infrastructure and system design.

1. Data Acquisition and Preprocessing (Left Section)

  • Infinite World Data (Green Arrow): Represents the vast, unstructured, and infinite source data existing in the real world.
  • For All World Data & RAM: Shows the process of loading this infinite real-world data into RAM (a finite computing resource) so that the AI can process it. This represents the beginning of the data pipeline, where massive amounts of data are ingested, compressed, and refined for the system.

2. AI Computation & Infrastructure Optimization (Center Section)

This is the core of the diagram, showing how software-driven data optimization and hardware-driven power/cooling optimization intersect around the central AI processor (such as a GPU or NPU).

  • Algorithm & Model Optimization (Horizontal Flow):
    • Learning: The process where the AI trains on and optimizes data based on human-built statistical frameworks (Human Statistics).
    • Inference: The process of executing the trained model to run computations on new inputs and derive actionable results.
  • Physical Infrastructure Optimization (Vertical Flow): Represents the data center-level physical management required to sustain high-performance AI workloads.
    • Fit Optimization For Computing (Top): The lightning bolt icon signifies the optimization of high-density power supply systems and computing efficiency necessary for heavy AI workloads.
    • Fit Optimization For Heat (Bottom): The snowflake and circulation icon represents thermal management and cooling system optimization (such as liquid immersion cooling or advanced HVAC) to control the massive heat generated by the chips during intense computation.

3. Generation of Meaningful Information (Right Section)

  • For All Human Data & RAM: Shows the final output derived from the AI’s inference process being loaded back into the memory (RAM).
  • Unlike the large, single bar of raw source data on the left, the data on the right is fragmented into multiple smaller blocks. This symbolizes that massive, unrefined data has been successfully processed by the AI into structured, meaningful, and digestible information that humans can immediately consume and utilize for specific purposes.

Summary

This diagram emphasizes that AI value creation is not merely a software algorithm that takes data in and spits results out. It conveys a system engineering philosophy: true AI Optimization can only be achieved when software models are perfectly synchronized with the physical architecture—specifically high-density power delivery (Computing) and efficient thermal management (Heat)—that supports the hardware at its core.

#AIOptimization #AIInfrastructure #SystemArchitecture #MachineLearning #DeepLearning #DataPipeline #DataCenter #ThermalManagement #ComputingPower #ArtificialIntelligence #TechInference #BigData

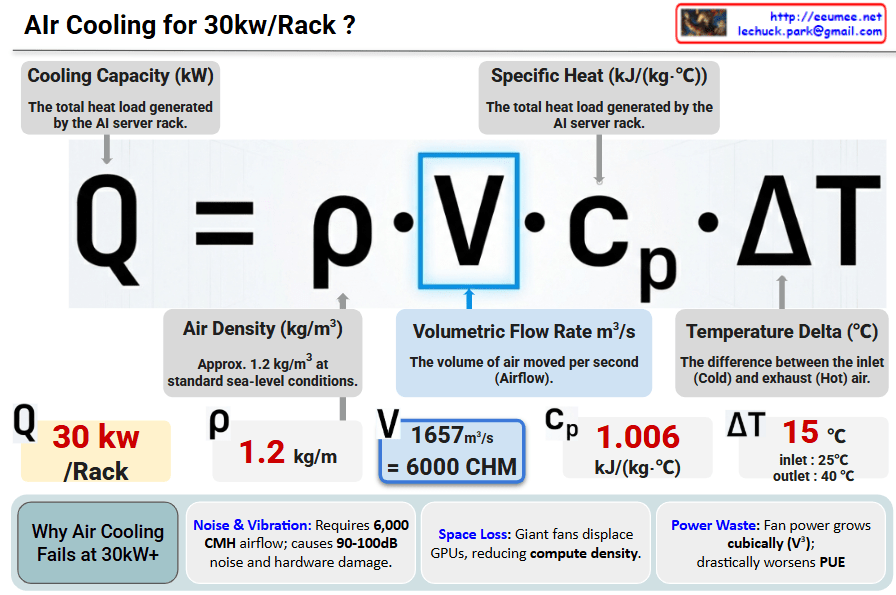
Air Cooling For 30kw/Rack

Why Air Cooling Fails at 30kW+

  • Noise & Vibration: Achieving 6,000 CMH airflow generates 90-100dB noise and vibrations that damage hardware.
  • Space Loss: Massive cooling fans displace GPUs/CPUs, drastically reducing compute density.
  • Power Waste: Fan power consumption grows cubically (V^3), causing a significant spike in PUE (Power Usage Effectiveness).

Conclusion: At 30kW/Rack, air cooling hits a physical and economic “wall”. Transitioning to Liquid Cooling is mandatory for next-generation AI Data Centers.


#AIDataCenter #LiquidCooling #ThermalManagement #30kWRack #DataCenterEfficiency #PUE #HighDensityComputing #GPUCooling

Proactive Cooling

The provided image illustrates the fundamental shift in data center thermal management from traditional Reactive methods to AI-driven Proactive strategies.


1. Comparison of Control Strategies

The slide contrasts two distinct approaches to managing the cooling load in a high-density environment, such as an AI data center.

FeatureReactive (Traditional)Proactive (Advanced)
PhilosophyAct After: Responds to changes.Act Before: Anticipates changes.
MechanismPID Control: Proportional-Integral-Derivative.MPC: Model Predictive Control.
ScopeLocal Control: Focuses on individual units/sensors.Central ML Control: Data-driven, system-wide optimization.
LogicFeedback-based (error correction).Feedforward-based (predictive modeling).

2. Graph Analysis: The “Sensing & Delay” Factor

The graph on the right visualizes the efficiency gap between these two methods:

  • Power (Red Line): Represents the IT load or power consumption which generates heat.
  • Sensing & Delay: There is a temporal gap between when a server starts consuming power and when the cooling system’s sensors detect the temperature rise and physically ramp up the fans or chilled water flow.
  • Reactive Cooling (Dashed Blue Line): Because it “acts after,” the cooling response lags behind the power curve. This often results in thermal overshoot, where the hardware momentarily operates at higher temperatures than desired, potentially triggering throttling.
  • Proactive Cooling (Solid Blue Line): By using Model Predictive Control (MPC), the system predicts the impending power spike. It initiates cooling before the heat is fully sensed, aligning the cooling curve more closely with the power curve to maintain a steady temperature.

3. Technical Implications for AI Infrastructure

In modern data centers, especially those handling fluctuating AI workloads (like LLM training or high-concurrency inference), the “Sensing & Delay” in traditional PID systems can lead to significant energy waste and hardware stress. MPC leverages historical data and real-time telemetry to:

  1. Reduce PUE (Power Usage Effectiveness): By avoiding over-cooling and sudden spikes in fan power.
  2. Improve Reliability: By maintaining a constant thermal envelope, reducing mechanical stress on chips.
  3. Optimize Operational Costs: Through centralized, intelligent resource allocation.

Summary

  1. Proactive Cooling utilizes Model Predictive Control (MPC) and Machine Learning to anticipate heat loads before they occur.
  2. Unlike traditional PID systems that respond to temperature errors, MPC eliminates the Sensing & Delay lag by acting on predicted power spikes.
  3. This shift enables superior energy efficiency and thermal stability, which is critical for high-density AI data center operations.

#DataCenter #AICooling #ModelPredictiveControl #MPC #ThermalManagement #EnergyEfficiency #SmartInfrastructure #PUEOptimization #MachineLearning

With Gemini

AI-Driven Proactive Cooling Architecture

The provided image illustrates an AI-Driven Proactive Cooling Architecture, detailing a sophisticated pipeline that transforms operational data into precise thermal management.


1. The Proactive Data Hierarchy

The architecture categorizes data sources along a spectrum, moving from “More Proactive” (predicting future heat) to “Reactive” (measuring existing heat).

  • LLM Job Schedule (Most Proactive): This layer looks at the job queue, node thermal headroom, and resource availability. It allows the system to prepare for heat before the first calculation even begins.
  • LLM Workload: Monitors real-time GPU utilization (%) and token throughput to understand the intensity of the current processing task.
  • GPU / HBM: Captures direct hardware telemetry, including GPU power draw (Watts) and High Bandwidth Memory (HBM) temperatures.
  • Server Internal Temperature: Measures the junction temperature, fan/pump speeds, and the $\Delta T$ (temperature difference) between server inlet and outlet.
  • Floor & Rack Temperature (Reactive): The traditional monitoring layer that identifies hot spots and rack density (kW) once heat has already entered the environment.

2. The Analysis and Response Loop

The bottom section of the diagram shows how this multi-layered data is converted into action:

  • Gathering Data: Telemetry from all five layers is aggregated into a central repository.
  • Analysis with ML: A Machine Learning engine processes this data to predict thermal trends. It doesn’t just look at where the temperature is now, but where it will be in the next few minutes based on the workload.
  • Cooling Response: The ML insights trigger physical adjustments in the cooling infrastructure, specifically controlling the $\Delta T$ (Supply/Return) and Flow Rate (LPM – Liters Per Minute) of the coolant.

3. Technical Significance

By shifting the control logic “left” (toward the LLM Job Schedule), data centers can eliminate the thermal lag inherent in traditional systems. This is particularly critical for AI infrastructure, where GPU power consumption can spike almost instantaneously, often faster than traditional mechanical cooling systems can ramp up.


Summary

  1. This architecture shifts cooling from a reactive sensor-based model to a proactive workload-aware model using AI/ML.
  2. It integrates data across the entire stack, from high-level LLM job queues down to chip-level GPU power draw and rack temperatures.
  3. The ML engine predicts thermal demand to dynamically adjust coolant flow rates and supply temperatures, significantly improving energy efficiency and hardware longevity.

#AICooling #DataCenterInfrastructure #ProactiveCooling #GPUManagement #LiquidCooling #LLMOps #ThermalManagement #EnergyEfficiency #SmartDC

With Gemini