1. The 5 Pillars & Potential Bottlenecks (Top Section)
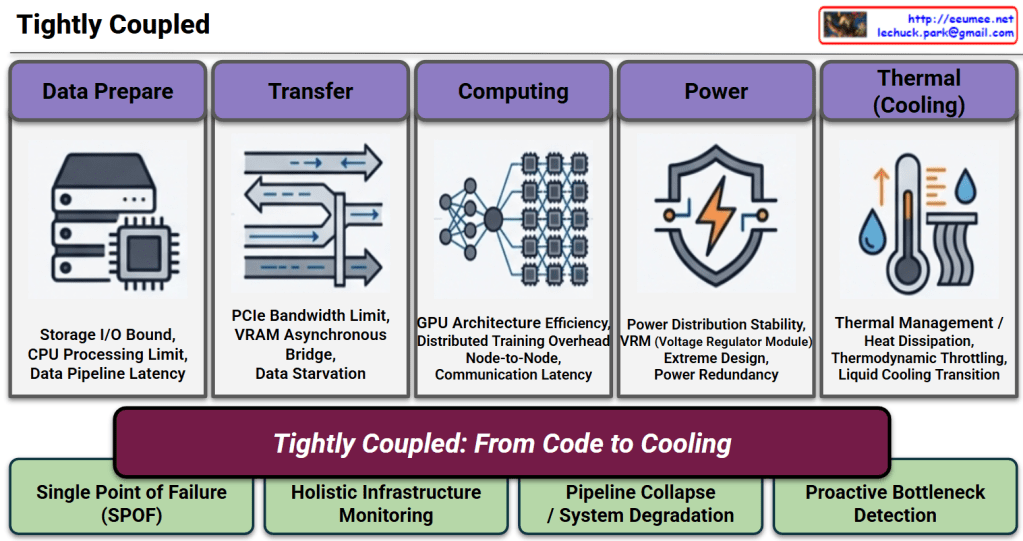
The Flow: The diagram visualizes the critical path of an AI workload, moving sequentially through Data Prepare ➔ Transfer ➔ Computing ➔ Power ➔ Thermal (Cooling).
The Risks: Below each pillar, specific technical bottlenecks are listed (e.g., Storage I/O Bound, PCIe Bandwidth Limit, Thermodynamic Throttling). This highlights that each stage is highly sensitive; a delay or failure in any single component can starve the GPU or cause system-wide degradation.
2. The Core Message (Center Section)
The Banner: The central phrase, “Tightly Coupled: From Code to Cooling”, acts as the heart of the presentation. It boldly declares that AI infrastructure is no longer divided into “IT” and “Facilities.” Instead, it is a single, inextricably linked ecosystem where the execution of a single line of code directly translates to immediate physical power and cooling demands.
The Reality (Left): Because the system is so interdependent, any Single Point of Failure (SPOF) will lead to a complete Pipeline Collapse / System Degradation.
The Operational Shift (Right): To prevent this, traditional siloed management must be replaced. The slide strongly argues for Holistic Infrastructure Monitoring and Proactive Bottleneck Detection. It visually proves that reacting to issues after they happen is too late; operations must be predictive and unified across the entire stack.
💡Summary
Interdependence: AI data centers operate as a single, highly sensitive organism where one isolated bottleneck can collapse the entire computational pipeline.
Paradigm Shift: The tight coupling of software workloads and physical facilities (“From Code to Cooling”) makes legacy, reactive monitoring obsolete.
Strategic Imperative: To ensure stability and efficiency, operations must transition to holistic, proactive detection driven by intelligent, autonomous management solutions.
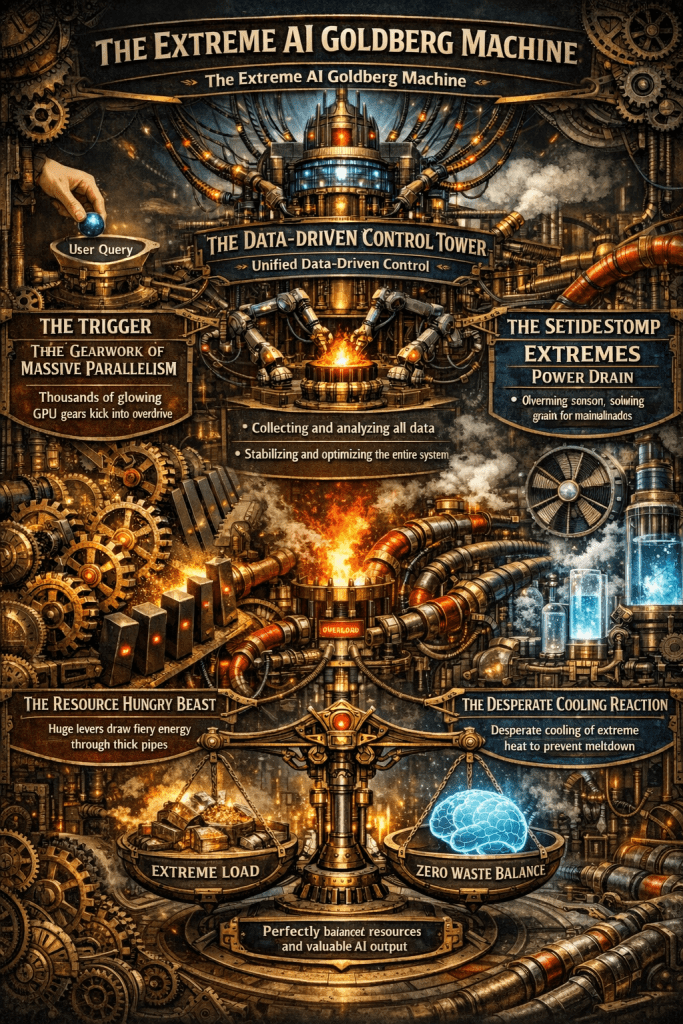
A single AI response triggers a massive chain reaction of compute, power, and cooling. Only unified, data-driven control can stabilize this fragile system and eliminate waste.
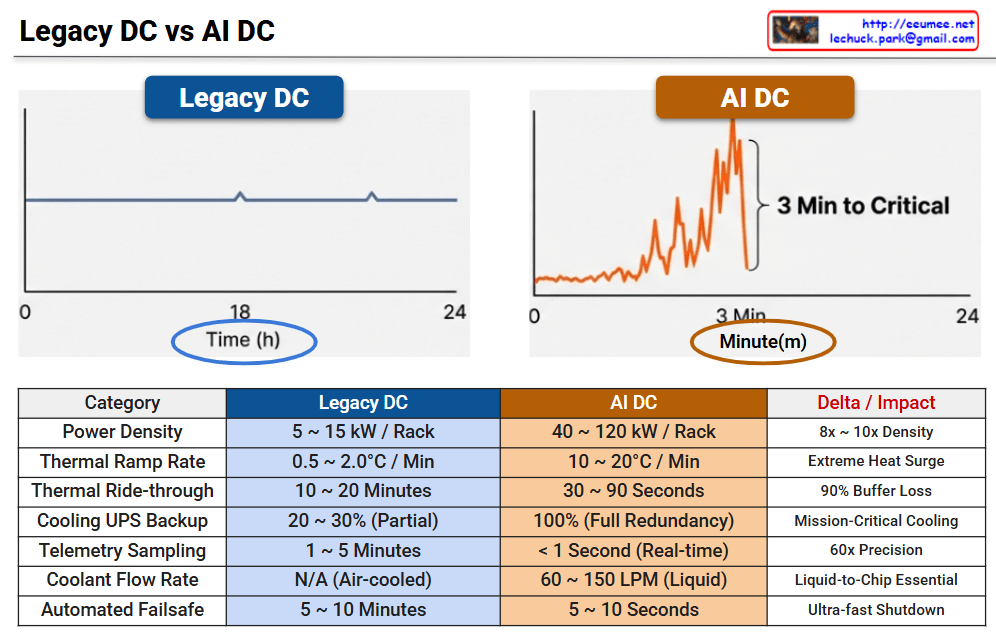
This infographic illustrates the radical shift in operational paradigms between Legacy Data Centers and AI Data Centers, highlighting the transition from “Human-Speed” steady-state management to “Machine-Speed” real-time automation.
📊 Legacy DC vs. AI DC: Operational Metrics Comparison
Category
Legacy DC
AI DC
Delta / Impact
Power Density
5 ~ 15 kW / Rack
40 ~ 120 kW / Rack
8x ~ 10x Density
Thermal Ramp Rate
0.5 ~ 2.0°C / Min
10 ~ 20°C / Min
Extreme Heat Surge
Thermal Ride-through
10 ~ 20 Minutes
30 ~ 90 Seconds
90% Buffer Loss
Cooling UPS Backup
20 ~ 30% (Partial)
100% (Full Redundancy)
Mission-Critical Cooling
Telemetry Sampling
1 ~ 5 Minutes
< 1 Second (Real-time)
60x Precision
Coolant Flow Rate
N/A (Air-cooled)
60 ~ 150 LPM (Liquid)
Liquid-to-Chip Essential
Automated Failsafe
5 ~ 10 Minutes
5 ~ 10 Seconds
Ultra-fast Shutdown
🔍 Graphical Analysis
1. The Volatility Gap
Legacy DC: Shows a stable, predictable power load across a 24-hour cycle. Operations are steady-state and managed on an hourly basis.
AI DC: Features extreme load fluctuations that can reach critical levels within just 3 minutes. This requires monitoring and response to be measured in minutes and seconds rather than hours.
2. The Cooling Imperative
With rack densities reaching 120 kW, air cooling is no longer viable. The shift to Liquid-to-Chip cooling with flow rates up to 150 LPM is mandatory to manage the 10–20°C per minute thermal ramp rates.
3. The End of Manual Intervention
In a Legacy DC, operators have a 20-minute “Golden Hour” to respond to cooling failures. In an AI DC, this buffer collapses to seconds, making sub-second telemetry and automated failsafe protocols the only way to prevent hardware damage.
💡 Summary
Density & Cooling Leap: AI DC demands up to 10x higher power density, necessitating a fundamental shift from traditional air cooling to Direct-to-Chip liquid cooling.
Vanishing Buffer Time: Thermal ride-through time has shrunk from 20 minutes to less than 90 seconds, leaving zero room for manual human intervention during failures.
Real-Time Autonomy: The operational paradigm has shifted to “Machine-Speed” automated control, requiring sub-second telemetry to handle extreme load volatility and ultra-fast failsafe needs.
This diagram illustrates how data centers are transforming as they enter the AI era.
📅 Timeline of Technological Evolution
The top section shows major technology revolutions and their timelines:
Internet ’95 (Internet era)
Mobile ’07 (Mobile era)
Cloud ’10 (Cloud era)
Blockchain
AI(LLM) ’22 (Large Language Model-based AI era)
🏢 Traditional Data Center Components
Conventional data centers consisted of the following core components:
Software
Server
Network
Power
Cooling
These were designed as relatively independent layers.
🚀 New Requirements in the AI Era
With the introduction of AI (especially LLMs), data centers require specialized infrastructure:
LLM Model – Operating large language models
GPU – High-performance graphics processing units (essential for AI computations)
High B/W – High-bandwidth networks (for processing large volumes of data)
SMR/HVDC – Switched-Mode Rectifier/High-Voltage Direct Current power systems
Liquid/CDU – Liquid cooling/Cooling Distribution Units (for cooling high-heat GPUs)
🔗 Key Characteristic of AI Data Centers: Integrated Design
The circular connection in the center of the diagram represents the most critical feature of AI data centers:
Tight Interdependency between SW/Computing/Network ↔ Power/Cooling
Unlike traditional data centers, in AI data centers:
GPU-based computing consumes enormous power and generates significant heat
High B/W networks consume additional power during massive data transfers between GPUs
Power systems (SMR/HVDC) must stably supply high power density
Liquid cooling (Liquid/CDU) must handle high-density GPU heat in real-time
These elements must be closely integrated in design, and optimizing just one element cannot guarantee overall system performance.
💡 Key Message
AI workloads require moving beyond the traditional layer-by-layer independent design approach of conventional data centers, demanding that computing-network-power-cooling be designed as one integrated system. This demonstrates that a holistic approach is essential when building AI data centers.
📝 Summary
AI data centers fundamentally differ from traditional data centers through the tight integration of computing, networking, power, and cooling systems. GPU-based AI workloads create unprecedented power density and heat generation, requiring liquid cooling and HVDC power systems. Success in AI infrastructure demands holistic design where all components are co-optimized rather than independently engineered.
AI Workload Cooling Systems: Bidirectional Physical-Software Optimization
This image summarizes four cutting-edge research studies demonstrating the bidirectional optimization relationship between AI LLMs and cooling systems. It proves that physical cooling infrastructure and software workloads are deeply interconnected.
🔄 Core Concept of Bidirectional Optimization
Direction 1: Physical Cooling → AI Performance Impact
Cooling methods directly affect LLM/VLM throughput and stability
Direction 2: AI Software → Cooling Control
LLMs themselves act as intelligent controllers for cooling systems
📊 Research Analysis
1. Physical Cooling Impact on AI Performance (2025 arXiv)
[Cooling HW → AI SW Performance]
Experiment: Liquid vs Air cooling comparison on H100 nodes
Physical Differences:
GPU Temperature: Liquid 41-50°C vs Air 54-72°C (up to 22°C difference)
GPU Power Consumption: 148-173W reduction
Node Power: ~1kW savings
Software Performance Impact:
Throughput: 54 vs 46 TFLOPs/GPU (+17% improvement)
Sustained and predictable performance through reduced throttling
Adaptive cooling strategies based on workload characteristics
3. Virtuous Cycle Effect
Better cooling → AI performance improvement → smarter cooling control
→ Energy savings → more AI jobs → advanced cooling optimization
→ Sustainable large-scale AI infrastructure
🎯 Practical Implications
These studies demonstrate:
Cooling is no longer passive infrastructure: It’s an active determinant of AI performance
AI optimizes its own environment: Meta-level self-optimizing systems
Hardware-software co-design is essential: Isolated optimization is suboptimal
Simultaneous achievement of sustainability and performance: Synergy, not trade-off
📝 Summary
These four studies establish that next-generation AI data centers must evolve into integrated ecosystems where physical cooling and software workloads interact in real-time to self-optimize. The bidirectional relationship—where better cooling enables superior AI performance, and AI algorithms intelligently control cooling systems—creates a virtuous cycle that simultaneously achieves enhanced performance, energy efficiency, and sustainable scalability for large-scale AI infrastructure.
This image shows a CDU (Coolant Distribution Unit) Metrics & Control System diagram illustrating the overall structure. The system can be organized as follows:
System Structure
Upper Section: CDU Structure
First Loop: CPU with Coolant Distribution Unit
Second Main Loop: Row Manifold and Rack Manifold configuration
Process Chill Water Supply/Return: Process chilled water circulation system
Lower Section: Data Collection & Control Devices
Control Devices:
Pump (Pump RPM, Rate of max speed)
Valve (Valve Open %)
Sensor Configuration:
Temperature & Pressure Sensors on manifolds
Supply System:
Rack Water Supply/Return
Main Control Methods
1. Fixed Pressure Control (Fixed Pressure Drop)
Primary Method: Maintaining fixed pressure drop between rack supply-return
Primary Method: Maintaining constant approach temperature
Alternatives: Fixed open, fixed secondary supply temperature control
Summary
This CDU system provides precise cooling control for data centers through dual management of pressure and temperature. The system integrates sensor feedback from manifolds with pump and valve control to maintain optimal cooling conditions across server racks.
The provided visual summarizes the key performance metrics of the CDU (Cooling Distribution Unit) that adheres to the OCP (Open Compute Project) ‘Project Deschutes’ specification. This CDU is designed for high-performance computing environments, particularly for massive-scale liquid cooling of AI/ML workloads.
Key Performance Indicators
System Availability: The primary target for system availability is 99.999%. This represents an extremely high level of reliability, with less than 5 minutes and 15 seconds of downtime per year.
Thermal Load Capacity: The CDU is designed to handle a thermal load of up to 2,000 kW, which is among the highest thermal capacities in the industry.
Power Usage: The CDU itself consumes 74 kW of power.
IT Flow Rate: It supplies coolant to the servers at a rate of 500 GPM (approximately 1,900 LPM).
Operating Pressure: The overall system operating pressure is within a range of 0-130 psig (approximately 0-900 kPa).
IT Differential Pressure: The pressure difference required on the server side is 80-90 psi (approximately 550-620 kPa).
Approach Temperature: The approach temperature, a key indicator of heat exchange efficiency, is targeted at ≤3∘C. A lower value is better, as it signifies more efficient heat removal.
Why Cooling is Crucial for GPU Performance
Cooling has a direct and significant impact on GPU performance and stability. Because GPUs are highly sensitive to heat, if they are not maintained within an optimal temperature range, they will automatically reduce their performance through a process called thermal throttling to prevent damage.
The ‘Project Deschutes’ CDU is engineered to prevent this by handling a massive thermal load of 2,000 kW with a powerful 500 GPM flow rate and a low approach temperature of ≤3∘C. This robust cooling capability ensures that GPUs can operate at their maximum potential without being limited by heat, which is essential for maximizing performance in demanding AI workloads.