Fault Detection and Recovery: Data Pipeline


Fault Detection and Recovery: Data Pipeline

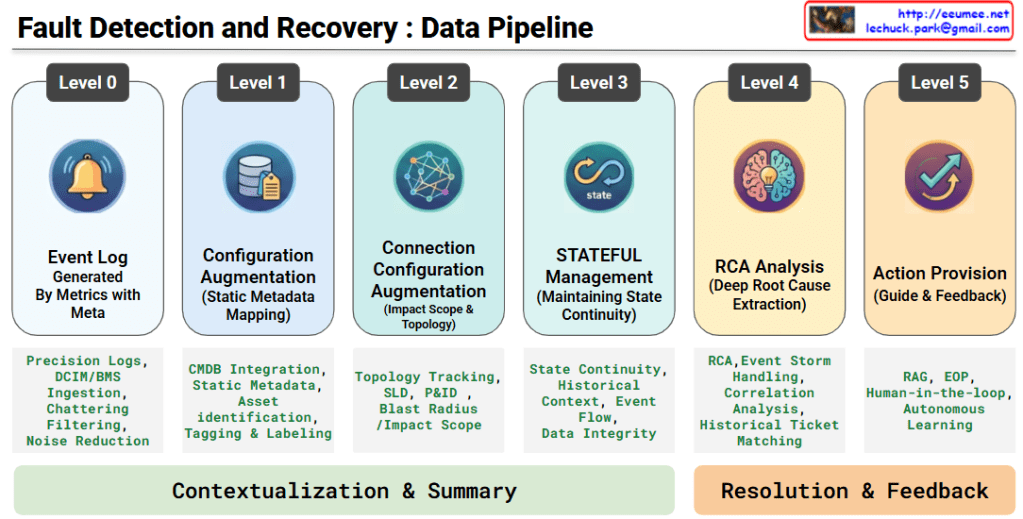
This architecture illustrates an advanced, six-stage, end-to-end data pipeline designed for an AI-driven infrastructure agent. It demonstrates how raw telemetry is systematically transformed into actionable, automated remediation through two primary phases.

Phase 1: Contextualization & Summary

This phase is dedicated to building a high-resolution, stateful understanding of the infrastructure. It takes raw alerts and layers them with critical physical and logical context.

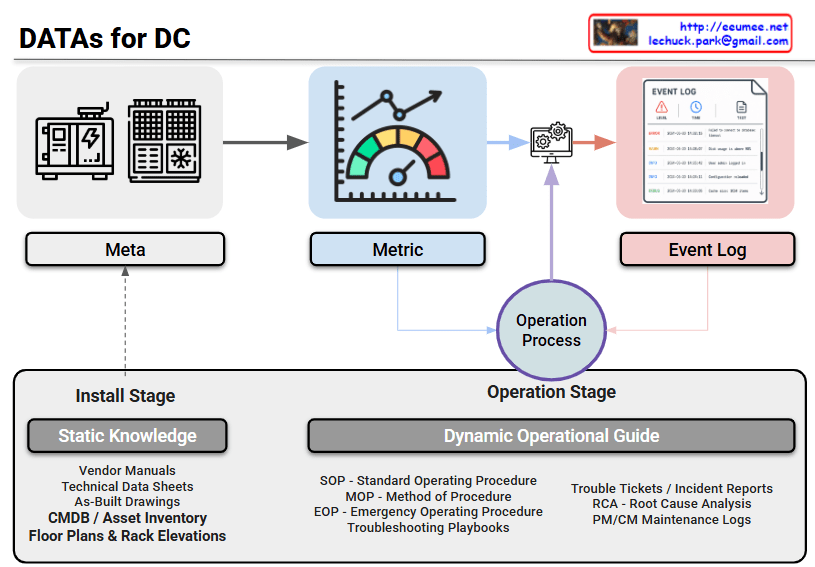
  • Level 0: Event Log (Generated By Metrics with Meta)The foundation of the pipeline. High-precision logs and telemetry are ingested from DCIM/BMS systems. Crucially, this stage performs chattering filtering and noise reduction to isolate genuine anomalies from meaningless alerts.
  • Level 1: Configuration Augmentation (Static Metadata Mapping)Raw events are enriched by integrating with the CMDB. By mapping static metadata to the alerts, the system performs precise asset identification, tagging, and labeling to know exactly which component is affected.
  • Level 2: Connection Configuration Augmentation (Impact Scope & Topology)The pipeline maps the isolated asset against physical and logical topologies (such as Single Line Diagrams and P&IDs). This enables the system to track dependencies and accurately calculate the blast radius or impact scope of a fault.
  • Level 3: STATEFUL Management (Maintaining State Continuity)Moving beyond isolated, point-in-time alerts, this level links current events with historical context and event flows. It ensures data integrity and maintains a continuous, stateful tracking of the system’s health.

Phase 2: Resolution & Feedback

With a fully contextualized baseline established, the pipeline shifts from situational awareness to intelligent diagnosis and automated remediation.

  • Level 4: RCA Analysis (Deep Root Cause Extraction)During an event storm, the system performs advanced correlation analysis and historical trouble-ticket matching. It sifts through the cascading symptoms to pinpoint the deep root cause (RCA) of the failure.
  • Level 5: Action Provision (Guide & Feedback)In the final stage, the platform leverages RAG (Retrieval-Augmented Generation) to instantly surface the most relevant Emergency Operating Procedures (EOP). By incorporating a Human-in-the-loop (HITL) feedback mechanism, expert operators validate the actions, allowing the AI model to continuously undergo autonomous learning and refine its future responses.

Summary

This data pipeline elegantly maps the journey from raw infrastructure noise to intelligent, automated resolution. By progressively layering static configuration data, topology mapping, and stateful tracking over high-precision logs, the architecture effectively neutralizes event storms. Ultimately, it empowers AI-driven agents to deliver highly accurate root cause analyses and RAG-assisted operational guides, creating a resilient system that continuously learns and improves through expert human feedback.

#AIOps #DataCenterArchitecture #RootCauseAnalysis #SystemObservability #RAG #FaultDetection #Telemetry #HumanInTheLoop #InfrastructureAutomation #TechInfographic

With Gemini

Data for DC

1. The Three Core Data Types (Top Section)

At the top, the diagram maps out the primary real-time and structural data inputs flowing from the infrastructure:

  • Meta: This represents the foundational metadata of the facility—the physical and logical configuration of equipment like generators, server racks, and liquid cooling units. It acts as the anchor point for the entire monitoring ecosystem.
  • Metric: Illustrated by the gauge, this is the continuous, time-series telemetry data. It includes critical real-time performance indicators, such as power loads, latency, or the return temperature from cooling units.
  • Event Log: The document icon on the right captures asynchronous system logs, alerts, and warnings (e.g., error thresholds being breached or state changes).

2. The Knowledge Base / RAG Corpus (Bottom Section)

The bottom half categorizes the facility’s documentation across its lifecycle. This perfectly outlines the corpus structure required to feed an AI’s Retrieval-Augmented Generation (RAG) system:

  • Install Stage (Static Knowledge): This is the baseline documentation established during construction and deployment. It includes Vendor Manuals, Technical Data Sheets, As-Built Drawings, CMDB, and Rack Elevations. Notice the dotted arrow showing how this static knowledge directly informs and establishes the “Meta” data above.
  • Operation Stage (Dynamic Operational Guide): This represents the evolving, lived intelligence of the facility. It captures structured response frameworks (SOP, MOP, EOP) alongside historical operational data like Trouble Tickets, RCA (Root Cause Analysis), and Maintenance Logs.

3. The Operation Process (Center)

The purple “Operation Process” node acts as the cognitive center or the execution engine. Real-time anomalies detected via Metrics and Event Logs flow into this process. The system then queries the Dynamic Operational Guide to find the correct standard operating procedures or historical RCA to resolve the issue. The resulting action or insight is then fed back into the central monitoring and management system.


Summary

This diagram elegantly maps out the data architecture of a modern facility. It visualizes how static foundational knowledge and dynamic operational history combine to inform real-time monitoring and incident response. By categorizing data into Meta, Metric, Event Logs, and structural lifecycle knowledge, it provides a clear, actionable framework for implementing data-driven operations, high-resolution observability, and AI-assisted automation platforms.

#DataCenterArchitecture #AIOps #RAG #InfrastructureObservability #SystemTelemetry #RootCauseAnalysis #TechInfographic

With Gemini

Metric Data

This image visually and intuitively defines the “6 Core Criteria of a Good Metric.” It effectively encompasses both the technical properties of the data itself and its practical value in a business context.

📊 The 6 Core Elements of a Metric

1. Data Foundation

  • Numeric: Represented by the 1 2 3 4 icon. A metric must be expressed as objective, quantifiable numbers rather than subjective feelings or qualitative text.
  • Measurable: Represented by the ruler icon. The data must be accurately collected and tracked using systems, logs, or measurement tools.

2. Data Processing

  • Changing: Represented by the refresh arrows icon. A metric is not a fixed constant; it must dynamically fluctuate over time, environments, or in response to user actions.
  • Computable: Represented by the calculator icon. You should be able to process raw data using mathematical operations (addition, division, ratios) to derive a meaningful value.

3. Business Value

  • Actionable: Represented by the hand adjusting a gear icon. A good metric should not just be “nice to know.” It must drive concrete actions, strategic adjustments, or immediate decision-making to improve a system or service.
  • Comparable: Represented by the A/B panel icon. A metric gains its true meaning when evaluated against past data (e.g., month-over-month), target goals, or different user cohorts (A/B testing) to diagnose current performance.

💡 Summary

Overall, this slide provides an excellent framework that bridges the gap between data engineering (how data is collected and computed) and business strategy (how data drives decisions). It is a highly polished visual guide for defining ideal metrics!

#Metrics #KPI #BusinessIntelligence #DataStrategy #DataEngineering #ActionableInsights

With Gemini

AI Data Center Operation Platform Layer

The provided image illustrates the architecture of an AI DataCenter Operation Platform, mapping it out in five distinct stages from the physical foundation layer up to the top-tier artificial intelligence application layer.

The upward-pointing arrows depict the flow of raw data collected from the infrastructure, demonstrating the system’s upward evolution and how the data is ultimately utilized intelligently by AI.

Here is the breakdown of the core roles and components of each layer:

  • Layer 1: Facility & Physical Edge
    • Role: The foundational layer responsible for collecting data and controlling the physical infrastructure equipment of the data center, such as power and cooling systems.
    • Key Elements: High-Frequency Data Sampling, Precision Time Synchronization (Precision NTP/PTP), Standard Interfaces, and Zero-Latency Control & Redundancy. This layer focuses on extracting data and issuing control commands to hardware with extreme speed and accuracy.
  • Layer 2: Network Fabric
    • Role: The neural network of the data center. It reliably and rapidly transmits the massive amounts of collected data to the upper platforms without bottlenecks.
    • Key Elements: Non-blocking Leaf-Spine Architecture, Ultra-High-Speed Telemetry, and Integrated Security & NMS (Network Management System) Monitoring. These elements work together to efficiently handle large-scale traffic.
  • Layer 3: Control & Management (Integrated Control)
    • Role: The layer that integrates and normalizes heterogeneous data streaming in from various facilities and solutions to execute practical operations and management.
    • Key Elements: Operational Solution Convergence, Heterogeneous Data Normalization, Traffic-based Anomaly Detection, and Monitoring-Based Commissioning (MBCx). It acts as a critical gateway to identify infrastructure issues early and improve overall operational efficiency.
  • Layer 4: Analysis Platform
    • Role: The stage where refined data is stored, analyzed, and visualized, allowing administrators to intuitively grasp the system’s status at a glance.
    • Key Elements: Utilizes a High-Performance Time-Series Database (TSDB) to record state changes over time and provides Customized Views/Dashboards for tailored monitoring.
  • Layer 5: Intelligent Expansion
    • Role: The ultimate destination of this platform. It is the highest layer where AI autonomously operates and optimizes the data center, leveraging the well-organized data provided by the lower layers.
    • Key Elements: Generative AI Agent (LLM+RAG), Digital Twin technology, ML-based Automated Power/Cooling Control, and Intelligent Report Generation.

This blueprint clearly demonstrates the overall solution architecture: precisely collecting and transmitting raw data from hardware facilities (Layers 1-2), standardizing, storing, and analyzing that data (Layers 3-4), and ultimately achieving advanced, autonomous operations through intelligent, automatic control of power and cooling systems via a Generative AI Agent (Layer 5).


#AIDataCenter #AIOps #DataCenterManagement #GenerativeAI #DigitalTwin #NetworkFabric #ITInfrastructure #SmartDataCenter #MachineLearning #TechArchitecture

With Gemini

DPU

1. Core Components (Left Panel)

The left side outlines the fundamental building blocks of a DPU, detailing how tasks are distributed across its hardware:

  • Control Plane (Multi-core ARM CPU): Operates independently from the host server, running a localized OS and infrastructure management services.
  • Data Path (Hardware Accelerators with FPGA): Utilizes specialized silicon to handle heavy, repetitive tasks like packet processing, cryptography, and data compression at wire-speed without latency.
  • I/O Ports (Network Interfaces): Correction Note: The description text in your image here is accidentally duplicated from the “Data Path” section. Ideally, this should note the physical connections, such as high-bandwidth Ethernet or InfiniBand (100G/400G+), designed to ingest massive data center traffic.
  • PCIe Gen 4/5/6 (Host Interface): Provides the high-bandwidth, low-latency bridge connecting the DPU to the host’s CPU and GPUs.

2. Key Use Cases (Right Panel)

The right side highlights how these hardware components translate into tangible infrastructure benefits:

  • Network Offloading: Shifts complex network protocols (OVS, VxLAN, RoCE) away from the host CPU, reserving those critical compute cycles entirely for AI workloads.
  • Storage Acceleration: Leverages NVMe-oF to disaggregate storage, allowing the server to access remote storage arrays with the same low latency and high throughput as local drives.
  • Security Offloading: Enforces Zero Trust and micro-segmentation directly at the server edge by performing inline IPsec/TLS encryption and firewalling.
  • Bare-Metal Isolation: Creates an “air-gapped” environment that physically separates tenant applications from infrastructure management, eliminating the need for management agents on the host OS.

Summary

This infographic perfectly illustrates how DPUs transform server architectures by offloading critical network, storage, and security tasks to specialized hardware. By isolating infrastructure management from core compute resources, DPUs maximize overall efficiency, making them an indispensable foundation for a high-performance AI Data Center Integrated Operations Platform.

#DPU #DataProcessingUnit #NetworkOffloading #SmartNIC #FPGA #ZeroTrust #CloudInfrastructure

Operation Evolutions

By following the red circle with the ‘Actions’ (clicking hand) icon, you can easily track how the control and operational authority shift throughout the four stages.

Stage 1: Human Control

  • Structure: Facility ➡️ Human Control
  • Description: This represents the most traditional, manual approach. Without a centralized data system, human operators directly monitor the facility’s status and manually execute all Actions based on their physical observations and judgment.

Stage 2: Data System

  • Structure: Facility ➡️ Data System ➡️ Human Control
  • Description: A monitoring or data system (like a dashboard) is introduced. Humans now rely on the data collected by the system to understand the facility’s condition. However, the final Actions are still manually performed by humans.

Stage 3: Agent Co-work

  • Structure: Facility ➡️ Data System ➡️ Agent Co-work ➡️ Human Control
  • Description: An AI Agent is introduced as an intermediary between the data system and the human operator. The AI analyzes the data and provides insights, recommendations, or assistance. Even with this support, the final decision-making and physical Actions remain entirely the human’s responsibility.

Stage 4: Autonomous (Auto-nomous)

  • Structure: Facility ➡️ Data System ➡️ Auto-nomous ↔️ Human Guide
  • Description: This is the ultimate stage of operational evolution. The authority to execute Actions has shifted from the human to the AI. The AI analyzes data, makes independent decisions, and autonomously controls the facility. The human’s role transitions from a direct controller to a ‘Human Guide’, supervising the AI and providing high-level directives. The two-way arrow indicates a continuous, interactive feedback loop where the human and AI collaborate to refine and optimize the system.

Summary:

This slide intuitively illustrates a paradigm shift in infrastructure operations: progressing from Direct Human Intervention ➡️ System-Assisted Cognition ➡️ AI-Assisted Operations (Co-work) ➡️ Fully Autonomous AI Control with Human Supervision.

#AIOps #AutonomousOperations #TechEvolution #DigitalTransformation #DataCenter #FacilityManagement #InfrastructureAutomation #SmartFacilities #AIAgents #FutureOfWork #HumanAndAI #Automation

with Gemini