1. The Three Core Data Types (Top Section)
At the top, the diagram maps out the primary real-time and structural data inputs flowing from the infrastructure:
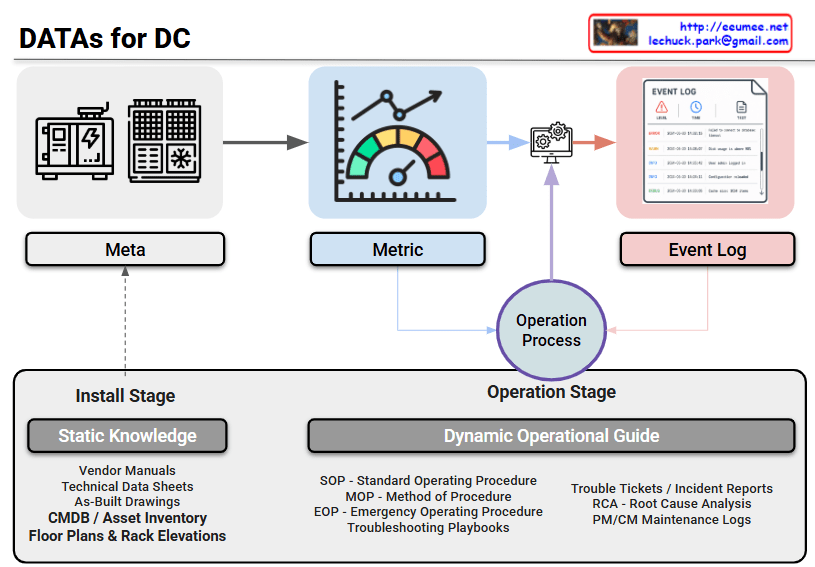
- Meta: This represents the foundational metadata of the facility—the physical and logical configuration of equipment like generators, server racks, and liquid cooling units. It acts as the anchor point for the entire monitoring ecosystem.
- Metric: Illustrated by the gauge, this is the continuous, time-series telemetry data. It includes critical real-time performance indicators, such as power loads, latency, or the return temperature from cooling units.
- Event Log: The document icon on the right captures asynchronous system logs, alerts, and warnings (e.g., error thresholds being breached or state changes).
2. The Knowledge Base / RAG Corpus (Bottom Section)
The bottom half categorizes the facility’s documentation across its lifecycle. This perfectly outlines the corpus structure required to feed an AI’s Retrieval-Augmented Generation (RAG) system:
- Install Stage (Static Knowledge): This is the baseline documentation established during construction and deployment. It includes Vendor Manuals, Technical Data Sheets, As-Built Drawings, CMDB, and Rack Elevations. Notice the dotted arrow showing how this static knowledge directly informs and establishes the “Meta” data above.
- Operation Stage (Dynamic Operational Guide): This represents the evolving, lived intelligence of the facility. It captures structured response frameworks (SOP, MOP, EOP) alongside historical operational data like Trouble Tickets, RCA (Root Cause Analysis), and Maintenance Logs.
3. The Operation Process (Center)
The purple “Operation Process” node acts as the cognitive center or the execution engine. Real-time anomalies detected via Metrics and Event Logs flow into this process. The system then queries the Dynamic Operational Guide to find the correct standard operating procedures or historical RCA to resolve the issue. The resulting action or insight is then fed back into the central monitoring and management system.
Summary
This diagram elegantly maps out the data architecture of a modern facility. It visualizes how static foundational knowledge and dynamic operational history combine to inform real-time monitoring and incident response. By categorizing data into Meta, Metric, Event Logs, and structural lifecycle knowledge, it provides a clear, actionable framework for implementing data-driven operations, high-resolution observability, and AI-assisted automation platforms.
#DataCenterArchitecture #AIOps #RAG #InfrastructureObservability #SystemTelemetry #RootCauseAnalysis #TechInfographic
With Gemini
