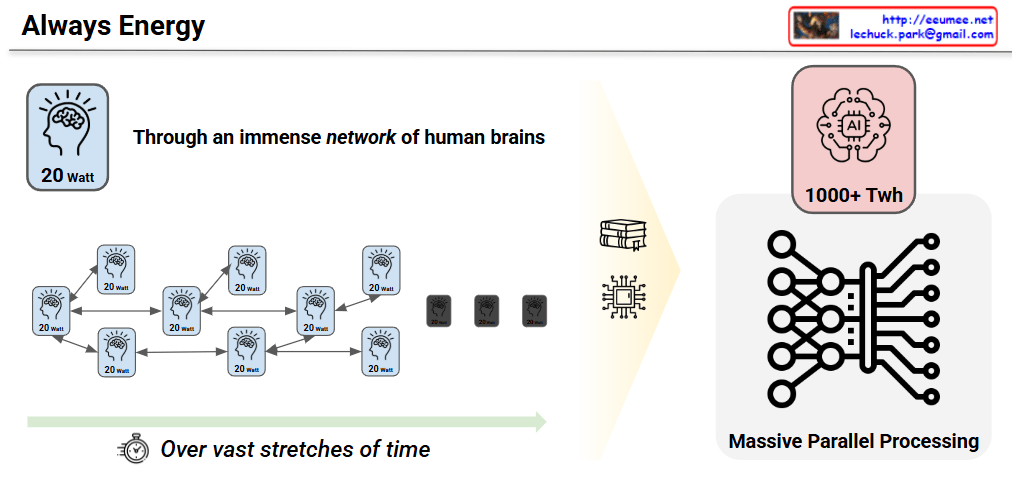
Operation Evolutions

By following the red circle with the ‘Actions’ (clicking hand) icon, you can easily track how the control and operational authority shift throughout the four stages.

Stage 1: Human Control

  • Structure: Facility ➡️ Human Control
  • Description: This represents the most traditional, manual approach. Without a centralized data system, human operators directly monitor the facility’s status and manually execute all Actions based on their physical observations and judgment.

Stage 2: Data System

  • Structure: Facility ➡️ Data System ➡️ Human Control
  • Description: A monitoring or data system (like a dashboard) is introduced. Humans now rely on the data collected by the system to understand the facility’s condition. However, the final Actions are still manually performed by humans.

Stage 3: Agent Co-work

  • Structure: Facility ➡️ Data System ➡️ Agent Co-work ➡️ Human Control
  • Description: An AI Agent is introduced as an intermediary between the data system and the human operator. The AI analyzes the data and provides insights, recommendations, or assistance. Even with this support, the final decision-making and physical Actions remain entirely the human’s responsibility.

Stage 4: Autonomous (Auto-nomous)

  • Structure: Facility ➡️ Data System ➡️ Auto-nomous ↔️ Human Guide
  • Description: This is the ultimate stage of operational evolution. The authority to execute Actions has shifted from the human to the AI. The AI analyzes data, makes independent decisions, and autonomously controls the facility. The human’s role transitions from a direct controller to a ‘Human Guide’, supervising the AI and providing high-level directives. The two-way arrow indicates a continuous, interactive feedback loop where the human and AI collaborate to refine and optimize the system.

Summary:

This slide intuitively illustrates a paradigm shift in infrastructure operations: progressing from Direct Human Intervention ➡️ System-Assisted Cognition ➡️ AI-Assisted Operations (Co-work) ➡️ Fully Autonomous AI Control with Human Supervision.

#AIOps #AutonomousOperations #TechEvolution #DigitalTransformation #DataCenter #FacilityManagement #InfrastructureAutomation #SmartFacilities #AIAgents #FutureOfWork #HumanAndAI #Automation

with Gemini

Operation Digitalization Step

Operation Digitalization Step: A 4-Step Roadmap

Step 1: Digitalization (The Start)

  • Goal: Securing data digitization and observability. It is the foundational phase of gathering and monitoring data before applying any advanced automation.

Step 2: Reactive Enhancement (Human Knowledge)

  • Goal: Applying LLM & RAG agents as a “Human Help Tool.”
  • Details: It relies on pre-verified processes to prevent AI hallucinations. By analyzing text-based event messages and operation manuals, it provides an “Easy and Effective first” approach to assist human operators.

Step 3: Proactive Enhancement (Machine Learning)

  • Goal: Deriving new insights through pattern analysis and machine learning.
  • Details: It utilizes specific and deep AI models based on metric statistics to provide an “AI Analysis Guide.” However, the final action still relies on a “Human Decision.”

Step 4: Autonomous Enhancement (Full-Validated Closed-Loop)

  • Goal: Achieving stable, AI-controlled operations.
  • Details: It prioritizes low-risk, high-gain loops. Through verified machines and strict guide rails, the system executes autonomous “AI Control” under full verification to manage risks.
  • Core Feedback Loop: The outcomes from both human decisions (Step 3) and AI control (Step 4) are ultimately designed to make “Everything Easy to Read,” ensuring transparency and intuitive understanding for operators.

  1. Progressive Evolution: The roadmap illustrates a strategic 4-step journey from basic data observability to fully autonomous, AI-controlled operations.
  2. Practical AI Adoption: It emphasizes a safe, low-risk strategy, starting with LLM/RAG as human-assist tools before advancing to predictive machine learning and closed-loop automation.
  3. Human-Centric Transparency: Regardless of the automation level, the ultimate design ensures all AI actions and system insights remain intuitive and “Easy to Read” for human operators.

#OperationDigitalization #AIOps #AutonomousOperations #DataCenterManagement #ITInfrastructure #LLM #RAG #MachineLearning #DigitalTransformation

Event Processing Functional Architecture

This image illustrates a Data Processing Pipeline (Architecture) where raw data is ingested, analyzed through an AI engine, and converted into actionable business intelligence.


## Image Interpretation: AI-Driven Data Pipeline

### 1. Input Layer (Left: Data Ingestion)

This represents the raw data collected from various sources within the infrastructure:

  • Log Data (Document Icon): System logs and event records that capture operational history.
  • Sensor Data (Thermometer & Waveform Icons): Real-time monitoring of physical environments, specifically focusing on Thermal (heat) and Acoustic (noise) patterns.
  • Topology Map (Network Icon): The structural map of equipment and their interconnections, providing context for how data flows through the system.

### 2. Integration & Processing (Center: The AI Funnel)

  • The Funnel/Pipe Shape: This symbolizes the process of data fusion and refinement. It represents different data types being standardized and processed through an AI model or analytics engine to filter out noise and identify patterns.

### 3. Output Layer (Right: Actionable Insights)

The final results generated by the analysis, designed to provide immediate value to operators:

  • Root Cause Report (Document with Magnifying Glass): Identifies the underlying reason for a specific failure or anomaly.
  • Step-by-Step Recovery Guide (Checklist with Arrows): Provides a sequential, automated, or manual procedure to restore the system to a healthy state.
  • Predictive Maintenance (Gear with Upward Arrow): Utilizes historical trends to predict potential failures before they occur, optimizing maintenance schedules and reducing downtime.

# Summary

The diagram effectively visualizes the transition from complex raw data to actionable intelligence. It highlights the core value of an AI-driven platform: reducing cognitive load for human operators by providing clear, data-backed directions for maintenance and recovery.


#AI #DataCenter #PredictiveMaintenance #DataAnalytics #SmartInfrastructure #RootCauseAnalysis #DigitalTransformation #OperationsOptimization

With Gemini

Intelligent Event Analysis Framework ( RAG Works )

This diagram illustrates a sophisticated Intelligent Event Processing architecture that utilizes Retrieval-Augmented Generation (RAG) to transform raw system logs into actionable technical solutions.

Architecture Breakdown: Intelligent Event Processing (RAG Works)

1. Data Inflow & Prioritization

  • Data Stream (Event Log): The system captures real-time logs and events.
  • Importance Level Decision: Instead of processing every minor log, this “gatekeeper” identifies critical events, ensuring the AI engine focuses on high-priority issues.

2. The RAG Core (The Reasoning Engine)

This is the heart of the system (the pink area), where the AI analyzes the problem:

  • Search (Retrieval): The system performs a Semantic Search and Top-K Retrieval to find the most relevant technical information from the Vector DB.
  • Augmentation: It injects this retrieved context into the LLM (Large Language Model) via In-Context Learning, giving the model “temporary memory” of your specific systems.
  • CoT Works (Chain of Thought): This is the “thinking” phase. It uses a Reasoning Path to analyze the data step-by-step and performs Conflict Resolution to ensure the final answer is logically sound.

3. Knowledge Management Pipeline

The bottom section shows how the system “learns”:

  • Knowledge Documents: Technical manuals, past incident reports, and guidelines are collected.
  • Standardization & Chunking: Data is broken down into manageable “chunks” and tagged with metadata.
  • Vector DB: These chunks are converted into mathematical vectors (embeddings) and stored, allowing the engine to search for “meaning” rather than just keywords.

4. Final Output

  • RCA & Recovery Guide: The ultimate goal. The system doesn’t just say there’s an error; it provides a Root Cause Analysis (RCA) and a step-by-step Recovery Guide to help engineers fix the issue immediately.

Summary

  1. Automated Intelligence: It’s an “IT First Responder” that converts raw system noise into precise, logical troubleshooting steps.
  2. Context-Aware Analysis: By combining RAG with Chain-of-Thought reasoning, the system “reads the manual” for you to solve complex errors.
  3. Data-Driven Recovery: The workflow bridges the gap between massive event logs and actionable Root Cause Analysis (RCA) to minimize downtime.

#AIOps #RAG #LLM #GenerativeAI #SystemArchitecture #DevOps #TechInsights #RootCauseAnalysis


With Gemini

Intelligent Event Analysis Framework

Intelligent Event Processing Architecture Analysis

The provided diagrams, titled Event Level Flow and Intelligent Event Processing, illustrate a sophisticated dual-path framework designed to optimize incident response within data center environments. This architecture effectively balances the need for immediate awareness with the requirement for deep, evidence-based diagnostics.


1. Data Ingestion and Intelligent Triage

The process begins with a continuous Data Stream of event logs. An Importance Level Decision gate acts as a triage point, routing traffic based on urgency and complexity:

  • Critical, single-source issues are designated as Alert Event One and sent to the Fast Path.
  • Standard or bulk logs are labeled Normal Event Multi and directed to the Slow Path for batch or deeper processing.

2. Fast Path: The Low-Latency Response Track

This path minimizes the time between event detection and operator awareness.

  • A Symbolic Engine handles rapid, rule-based filtering.
  • A Light LLM (typically a smaller parameter model) summarizes the event for human readability.
  • The Fast Notification system delivers immediate alerts to operators.
  • Crucially, a Rerouting function triggers the Slow Path, ensuring that even rapidly reported issues receive full analytical scrutiny.

3. Slow Path: The Comprehensive Diagnostic Track

The Slow Path focuses on precision, using advanced reasoning to solve complex problems.

  • Upon receiving a Trigger, a Bigger Engine prepares the data for high-level inference.
  • The Heavy LLM executes Chain of Thought (CoT) Works, breaking down the incident into logical steps to avoid errors.
  • This is supported by a Retrieval-Augmented Generation (RAG) system that performs a Search across internal knowledge bases (like manuals) and performs an Augmentation to enrich the LLM prompt with specific context.
  • The final output is a comprehensive Root Cause Analysis (RCA) and an actionable Recovery Guide.

Summary

  1. This architecture bifurcates incident response into a Fast Path for rapid awareness and a Slow Path for in-depth reasoning.
  2. By combining lightweight LLMs for speed and heavyweight LLMs with RAG for accuracy, it ensures both rapid alerting and reliable recovery guidance.
  3. The integration of symbolic rules and AI-driven Chain of Thought logic enhances both the operational efficiency and the technical reliability of the system.

#AIOps #LLM #RAG #DataCenter #IncidentResponse #IntelligentMonitoring #AI_Operations #RCA #Automation

With Gemini

Event Processing

This diagram illustrates a workflow that handles system logs/events by dividing them into real-time urgent responses and periodic deep analysis.

1. Data Ingestion & Filtering

  • Event Log → One-time Event Noti: The process begins with incoming event logs triggering an initial, single-instance notification.
  • Hot Event Decision: A decision node determines if the event is critical (“Hot Event?”). This splits the workflow into two distinct paths: a Hot Path for emergencies and an Analytical Path for deeper insights.

2. Hot Path (Real-time Response)

  • Urgent Event Noti & Analysis: If identified as a “Hot Event,” the system immediately issues an urgent notification and performs an urgent analysis while persisting the data to the database. This path appears designed to minimize MTTD (Mean Time To Detect) for critical failures.

3. Periodic & Contextual Analysis (AIOps Layer)

This section indicates a shift from simple monitoring to intelligent AIOps.

  • Periodic Analysis: Events are aggregated and analyzed over fixed time windows (1 min, 1 Hour, 1 Day). The purple highlight on “1 min” suggests the current focus is on short-term trend analysis.
  • Contextual Similarity Search: This is a critical advanced feature. By explicitly mentioning “Embedding / Indexing,” the architecture suggests the use of Vector Search (likely via a Vector DB). It implies the system doesn’t just match keywords but understands the semantic context of an error to find similar past cases.
  • Historical Co-relation Analysis: This module synthesizes the periodic trends and similarity search results to correlate the current event with historical patterns, aiding in Root Cause Analysis (RCA).

4. User Interface (UI/UX)

The processed insights are delivered to the user through four channels:

  • Dashboard: High-level status visualization.
  • Notification: Alerts for urgent issues.
  • Report: Summarized periodic findings.
  • Search & Analysis Tool: A tool for granular log investigation.

Summary

  1. Hybrid Architecture: Efficiently separates critical “Hot Event” handling (Real-time) from deep “Periodic Analysis” (Batch) to balance speed and insight.
  2. Semantic Intelligence: Incorporates “Contextual Similarity Search” using Embeddings, enabling the system to identify issues based on meaning rather than just keywords.
  3. Holistic Observability: interconnected modules (Urgent, Periodic, Historical) feed into a comprehensive UI/UX to support rapid decision-making and post-mortem analysis.

#EventProcessing #SystemArchitecture #VectorSearch #Observability #RCA

Labeling for AI World

The image illustrates a logical framework titled “Labeling for AI World,” which maps how human cognitive processes are digitized and utilized to train Large Language Models (LLMs). It emphasizes the transition from natural human perception to optimized AI integration.


1. The Natural Cognition Path (Top)

This track represents the traditional human experience:

  • World to Human with a Brain: Humans sense the physical world through biological organs, which the brain then analyzes and processes into information.
  • Human Life & History: This cognitive processing results in the collective knowledge, culture, and documented history of humanity.

2. The Digital Optimization Path (Bottom)

This track represents the technical pipeline for AI development:

  • World Data: Through Digitization, the physical world is converted into raw data stored in environments like AI Data Centers.
  • Human Optimization: This raw data is refined through processes like RLHF (Reinforcement Learning from Human Feedback) or fine-tuning to align AI behavior with human intent.
  • Human Life with AI (LLM): The end goal is a lifestyle where humans and LLMs coexist, with the AI acting as a sophisticated partner in daily life.

3. The Central Bridge: Labeling (Corpus & Ontology)

The most critical element of the diagram is the central blue box, which acts as a bridge between human logic and machine processing:

  • Corpus: Large-scale structured text data necessary for training.
  • Ontology: The formal representation of categories, properties, and relationships between concepts that define the human “worldview.”
  • The Link: High-quality Labeling ensures that AI optimization is grounded in human-defined logic (Ontology) and comprehensive language data (Corpus), ensuring both Quality and Optimization.

Summary

The diagram demonstrates that Data Labeling, guided by Corpus and Ontology, is the essential mechanism that translates human cognition into the digital realm. It ensures that LLMs are not just processing raw numbers, but are optimized to understand the world through a human-centric logical framework.

#AI #DataLabeling #LLM #Ontology #Corpus #CognitiveComputing #AIOptimization #DigitalTransformation

With Gemini