Steps for Energy Efficiency Improvement

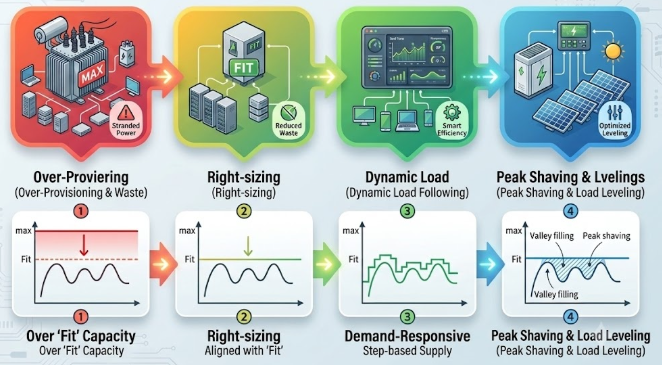
This image illustrates the evolution of power supply optimization across four progressive stages, moving from basic over-provisioning to advanced load leveling, using intuitive graphics and charts.

  • Stage 1: Over-Provisioning & Waste
    • This represents an inefficient initial state where power is supplied at a maximum capacity (MAX) that far exceeds the actual wavy demand curve. A large gap exists, resulting in significant “Stranded Power” and massive energy waste.
  • Stage 2: Right-sizing
    • The baseline for the continuous power supply is lowered (↓) to align exactly with the peak of the actual demand curve (Fit). This eliminates massive over-provisioning and ensures “Reduced Waste,” though some unused capacity still remains during off-peak periods.
  • Stage 3: Dynamic Load Following
    • Through real-time monitoring and dashboards, the power supply becomes demand-responsive, adjusting in a step-based manner to closely track fluctuations in power usage. The supply line tightly wraps around the demand curve, achieving “Smart Efficiency.”
  • Stage 4: Peak Shaving & Load Leveling
    • The ultimate optimization stage utilizes resources like solar panels and battery storage systems to completely flatten the grid draw into a straight line. It discharges stored energy during high-demand periods (“Peak shaving”) and stores energy during low-demand periods (“Valley filling”), achieving fully “Optimized Leveling.”

💡 Summary

This diagram visualizes the maturity journey of energy management: transitioning from a traditional over-provisioned power architecture, advancing through data-driven dynamic load tracking, and ultimately arriving at a perfectly balanced grid draw through peak shaving and energy storage integration.

#EnergyEfficiency #SmartGrid #PeakShaving #PowerOptimization #DynamicLoadFollowing #InfrastructureDesign #LoadLeveling

With Gemini
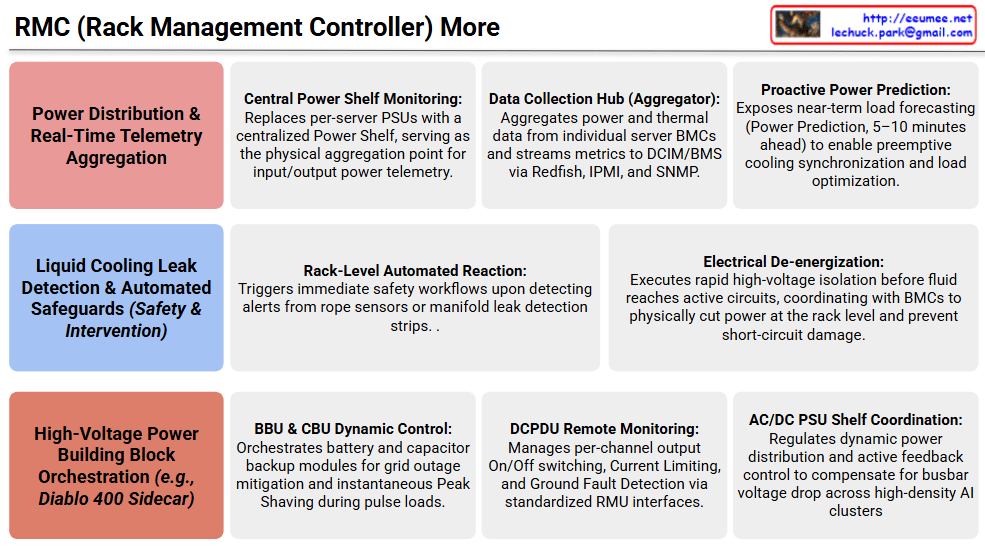
RMC (Rack Management Controller) More

This infographic, titled “RMC (Rack Management Controller) More,” details the three advanced core roles and operational capabilities of the RMC (or RMU) in high-density AI data center environments across three color-coded horizontal rows.

1. Power Distribution & Real-Time Telemetry Aggregation

The top pink row covers IT-domain centralized power management and data aggregation.

  • Central Power Shelf Monitoring: Replaces per-server PSUs with a centralized Power Shelf, serving as the physical aggregation point for input/output power telemetry.
  • Data Collection Hub (Aggregator): Aggregates power and thermal data from individual server BMCs and streams metrics to DCIM/BMS via Redfish, IPMI, and SNMP.
  • Proactive Power Prediction: Exposes near-term load forecasting (Power Prediction, 5–10 minutes ahead) to enable preemptive cooling synchronization and load optimization.

2. Liquid Cooling Leak Detection & Automated Safeguards (Safety & Intervention)

The middle green row outlines safety workflows and physical intervention capabilities for liquid cooling architectures.

  • Rack-Level Automated Reaction: Triggers immediate safety workflows upon detecting alerts from rope sensors or manifold leak detection strips.
  • Electrical De-energization: Executes rapid high-voltage isolation before fluid reaches active circuits, coordinating with BMCs to physically cut power at the rack level and prevent short-circuit damage.

3. High-Voltage Power Building Block Orchestration (e.g., Diablo 400 Sidecar)

The bottom blue row highlights hardware-level orchestration across high-voltage power components.

  • BBU & CBU Dynamic Control: Orchestrates battery and capacitor backup modules for grid outage mitigation and instantaneous Peak Shaving during pulse loads.
  • DCPDU Remote Monitoring: Manages per-channel output On/Off switching, Current Limiting, and Ground Fault Detection via standardized RMU interfaces.
  • AC/DC PSU Shelf Coordination: Regulates dynamic power distribution and active feedback control to compensate for busbar voltage drop across high-density AI clusters.

Summary

This infographic highlights the evolution of the RMC from a passive monitoring unit to an active, rack-scale brain. It operates as an IT telemetry neural hub aggregating real-time BMC data and power forecasts, a safety intervention authority enforcing electrical de-energization during liquid cooling leaks, and a power orchestrator managing complex building blocks (BBU, CBU, DCPDU, PSU) in next-generation high-voltage architectures like Diablo 400.

#OCP #OpenRack #ORv3 #RMC #RMU #DataCenterInfrastructure #LiquidCooling #LeakDetection #PeakShaving #Diablo400 #PowerManagement #AIOps #Redfish

With Gemini

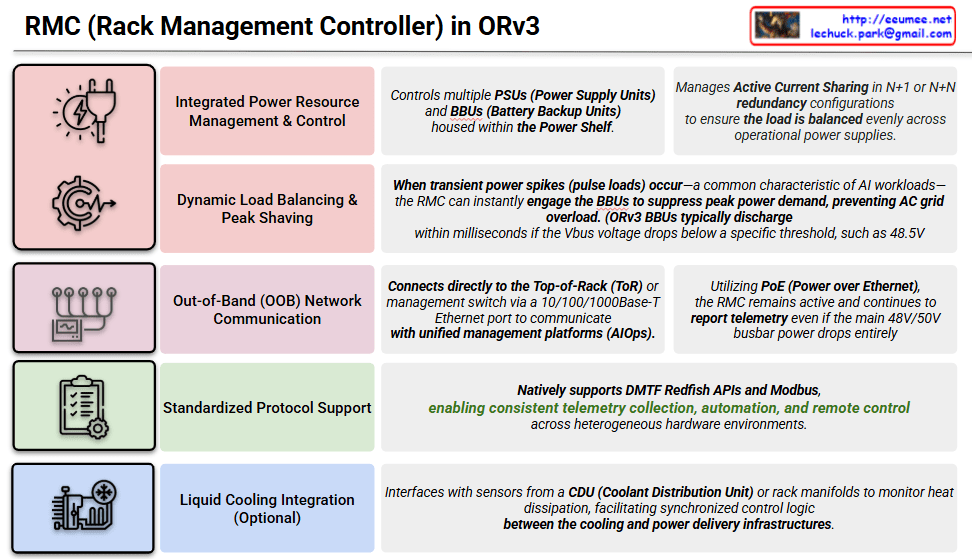
RMC (Rack Management Controller) in ORv3

RMC (Rack Management Controller) Features in ORv3

This image is an infographic that intuitively explains the five key functions of the RMC (Rack Management Controller) defined in the Open Compute Project (OCP) Open Rack v3 (ORv3) specification. Each function is categorized into a color-coded row, featuring a representative icon and title on the left, paired with a detailed description on the right.

1. Integrated Power Resource Management & Control

  • Icon: A gear with a power plug and a lightning bolt.
  • Detailed Description: This function controls multiple PSUs (Power Supply Units) and BBUs (Battery Backup Units) housed within the Power Shelf. It manages Active Current Sharing in N+1 or N+N redundancy configurations to ensure the load is balanced evenly across operational power supplies. This optimizes power efficiency and reliability.

2. Dynamic Load Balancing & Peak Shaving

  • Icon: A gear with a wave graph.
  • Detailed Description: When transient power spikes (pulse loads) occur—a common characteristic of AI workloads—the RMC can instantly engage the BBUs to suppress peak power demand, preventing AC grid overload. Note that ORv3 BBUs typically discharge within milliseconds if the Vbus voltage drops below a specific threshold, such as 48.5V.

3. Out-of-Band (OOB) Network Communication

  • Icon: A metering device with multiple cable connections.
  • Detailed Description: It connects directly to the Top-of-Rack (ToR) or management switch via a 10/100/1000Base-T Ethernet port to communicate with unified management platforms (AIOps). Utilizing PoE (Power over Ethernet), the RMC remains active and continues to report telemetry even if the main 48V/50V busbar power drops entirely, ensuring high availability of management functions.

4. Standardized Protocol Support

  • Icon: A clipboard with a checklist and a gear.
  • Detailed Description: The RMC natively supports DMTF Redfish APIs and Modbus. This enables consistent telemetry collection, automation, and remote control across heterogeneous hardware environments, facilitating interoperability in multi-vendor data centers.

5. Liquid Cooling Integration (Optional)

  • Icon: A gear shaped like a cooling system with piping and a fan.
  • Detailed Description: This optional feature interfaces with sensors from a CDU (Coolant Distribution Unit) or rack manifolds to monitor heat dissipation. This facilitates synchronized control logic between the cooling and power delivery infrastructures for holistic rack management.

Summary

This image illustrates the five core values of the RMC, a critical component of the OCP ORv3 standard rack. The RMC provides essential capabilities for advanced data center infrastructure management, including maximizing power efficiency, handling sudden power spikes typical of AI workloads, and maintaining management operations via PoE even during main power failures. Additionally, it addresses the complex demands of modern data centers through standardized protocol support and optional integration with liquid cooling systems.

#OCP #OpenComputeProject #ORv3 #RMC #RackManagementController #DataCenter #PowerManagement #PeakShaving #LiquidCooling #AIOps #Redfish

With Gemini

ESS + Supercapacitor: Coordination

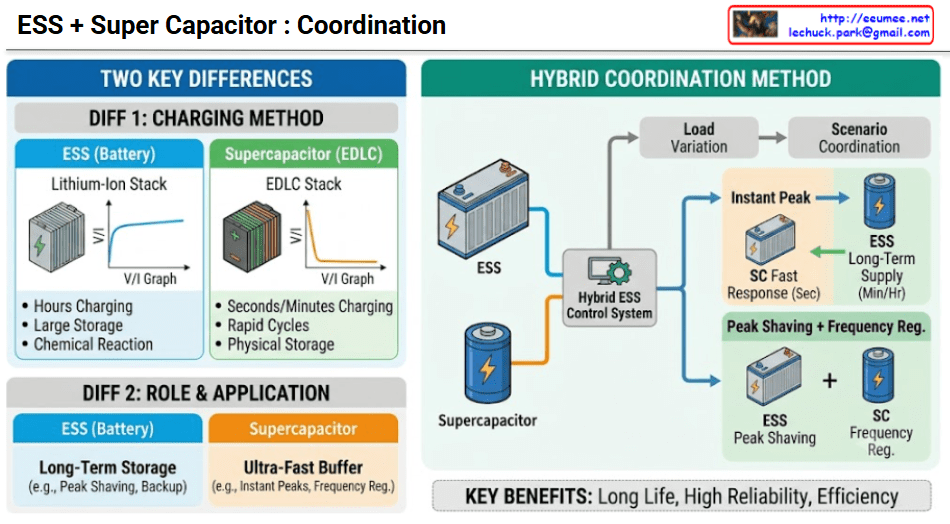
This infographic serves as a technical resource comparing the characteristics of Energy Storage Systems (ESS) and Supercapacitors, and explaining how a ‘Hybrid Coordination Method’ that combines these two technologies operates. The chart is primarily divided into ‘Two Key Differences’ on the left and ‘Hybrid Coordination Method’ on the right.

1. Left Section: Two Key Differences

This section highlights the fundamental technical distinctions between the two storage devices.

  • Diff 1: Charging Method
    • ESS (Battery): Utilizes a Lithium-Ion Stack. It stores energy via a Chemical Reaction, so as shown in the V/I graph, voltage and current rise gradually, taking hours for a full charge. However, it excels at large storage.
    • Supercapacitor (EDLC): Utilizes an EDLC (Electric Double-Layer Capacitor) Stack. It uses a Physical Storage method to store charge, resulting in a very steep rise in voltage and current in the graph, with charging complete in seconds or minutes. It can withstand repeated rapid cycles.
  • Diff 2: Role & Application
    • ESS (Battery): Functions as a long-term storage device. For example, it is used for Peak Shaving to reduce load during high-demand periods or as a backup power source.
    • Supercapacitor: Functions as an ultra-fast buffer. It is deployed where immediate and powerful responses are required, such as responding to instant peaks in power demand or for power grid Frequency Regulation.

2. Right Section: Hybrid Coordination Method

This section demonstrates how the two devices work together when combined into a single system.

  • System Configuration: The central ‘Hybrid ESS Control System’ is the brain. This controller detects external ‘Load Variation’ and executes the appropriate ‘Scenario Coordination’. The system consists of a blue, battery-shaped ESS unit and a blue, cylindrical Supercapacitor unit.
  • Coordination Scenario 1: Instant Peak
    • When an instant peak occurs (a sudden surge in load), the controller first commands the fast-responding Supercapacitor (SC) to provide a fast response in seconds, absorbing the initial power shock.
    • Subsequently, the controller hands over power supply to the ESS, which provides long-term supply in minutes or hours. This prevents rapid battery discharge and ensures the stability of the overall power supply.
  • Coordination Scenario 2: Peak Shaving + Frequency Reg.
    • The two devices simultaneously perform different roles to stabilize the power grid.
    • The ESS is responsible for peak shaving, reducing large and sustained load peaks.
    • Simultaneously, the Supercapacitor handles fine-tuned frequency regulation, adjusting for small, rapid frequency fluctuations. This combination of “ESS + SC” addresses both needs.

3. Bottom Section: Key Benefits

The major advantages achieved through this hybrid coordination are:

  • Long Life: By having the Supercapacitor absorb initial power shocks, the stress on the battery is reduced, thereby extending its lifespan.
  • High Reliability: Leveraging the strengths of both devices allows for a stable and reliable response to various power grid changes.
  • Efficiency: Each device takes on the role it does best, resulting in higher overall energy management efficiency for the system.

Summary: This infographic compares ESS (Batteries), which excel at bulk storage but have slower response times, with Supercapacitors, which have smaller storage capacity but offer ultra-fast response times. It explains a coordinated operation method that combines these two devices using a hybrid control system to effectively address both instantaneous power peaks and sustained energy demands. This combined approach achieves the key benefits of long life, high reliability, and efficiency.

#ESS #Supercapacitor #EnergyStorageSystem #HybridEnergySystem #GridStabilization #PeakShaving #FrequencyRegulation #EnergyTech #Infographic #EcoTech

With Gemini

Peak Shaving with Data

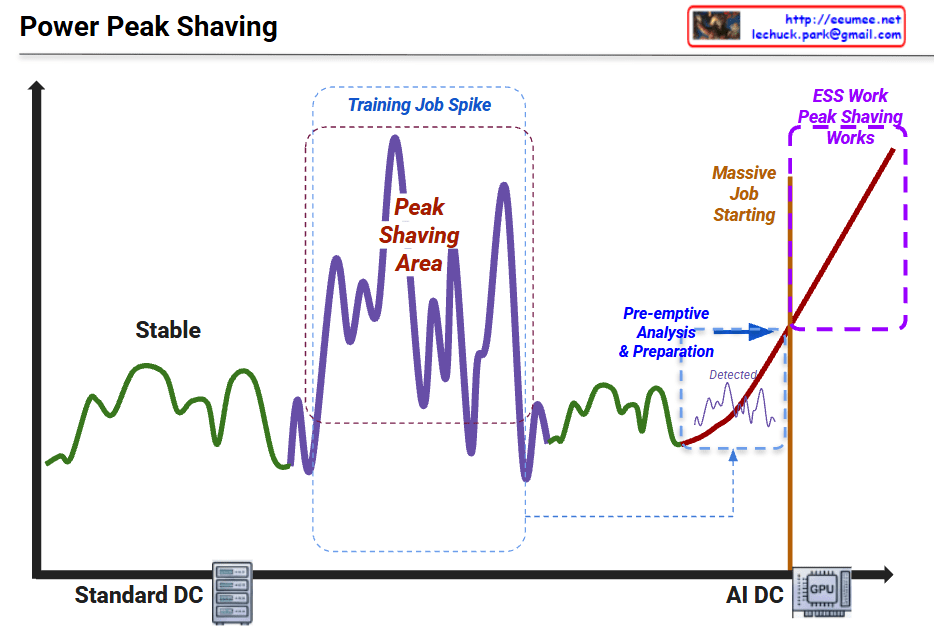
Graph Interpretation: Power Peak Shaving in AI Data Centers

This graph illustrates the shift in power consumption patterns from traditional data centers to AI-driven data centers and the necessity of “Peak Shaving” strategies.

1. Standard DC (Green Line – Left)

  • Characteristics: Shows “Stable” power consumption.
  • Interpretation: Traditional server workloads are relatively predictable with low volatility. The power demand stays within a consistent range.

2. Training Job Spike (Purple Line – Middle)

  • Characteristics: Significant fluctuations labeled “Peak Shaving Area.”
  • Interpretation: During AI model training, power demand becomes highly volatile. The spikes (peaks) and valleys represent the intensive GPU cycles required during training phases.

3. AI DC & Massive Job Starting (Red Line – Right)

  • Characteristics: A sharp, vertical-like surge in power usage.
  • Interpretation: As massive AI jobs (LLM training, etc.) start, the power load skyrockets. The graph shows a “Pre-emptive Analysis & Preparation” phase where the system detects the surge before it hits the maximum threshold.

4. ESS Work & Peak Shaving (Purple Dotted Box – Top Right)

  • The Strategy: To handle the “Massive Job Starting,” the system utilizes ESS (Energy Storage Systems).
  • Action: Instead of drawing all power from the main grid (which could cause instability or high costs), the ESS discharges stored energy to “shave” the peak, smoothing out the demand and ensuring the AI DC operates safely.

Summary

  1. Volatility Shift: AI workloads (GPU-intensive) create much more extreme and unpredictable power spikes compared to standard data center operations.
  2. Proactive Management: Modern AI Data Centers require pre-emptive detection and analysis to prepare for sudden surges in energy demand.
  3. ESS Integration: Energy Storage Systems (ESS) are critical for “Peak Shaving,” providing the necessary power buffer to maintain grid stability and cost efficiency.

#DataCenter #AI #PeakShaving #EnergyStorage #ESS #GPU #PowerManagement #SmartGrid #TechInfrastructure #AIDC #EnergyEfficiency

with Gemini

Peak Shaving


“Power – Peak Shaving” Strategy

The image illustrates a 5-step process for a ‘Peak Shaving’ strategy designed to maximize power efficiency in data centers. Peak shaving is a technique used to reduce electrical load during periods of maximum demand (peak times) to save on electricity costs and ensure grid stability.

1. IT Load & ESS SoC Monitoring

This is the data collection and monitoring phase to understand the current state of the system.

  • Grid Power: Monitoring the maximum power usage from the external power grid.
  • ESS SoC/SoH: Checking the State of Charge (SoC) and State of Health (SoH) of the Energy Storage System (ESS).
  • IT Load (PDU): Measuring the actual load through Power Distribution Units (PDUs) at the server rack level.
  • LLM/GPU Workload: Monitoring the real-time workload of AI models (LLM) and GPUs.

2. ML-based Peak Prediction

Predicting future power demand based on the collected data.

  • Integrated Monitoring: Consolidating data from across the entire infrastructure.
  • Machine Learning Optimization: Utilizing AI algorithms to accurately predict when power peaks will occur and preparing proactive responses.

3. Peak Shaving Via PCS (Power Conversion System)

Utilizing physical energy storage hardware to distribute the power load.

  • Pre-emptive Analysis & Preparation: Determining the “Time to Charge.” The system charges the batteries when electricity rates are low.
  • ESS DC Power: During peak times, the stored Direct Current (DC) in the ESS is converted to Alternating Current (AC) via the PCS to supplement the power supply, thereby reducing reliance on the external grid.

4. Job Relocation (K8s/Slurm)

Adjusting the scheduling of IT tasks based on power availability.

  • Scheduler Decision Engine: Activated when a peak time is detected or when ESS battery levels are low.
  • Job Control: Lower priority jobs are queued or paused, and compute speeds are throttled (power suppressed) to minimize consumption.

5. Parameter & Model Optimization

The most advanced stage, where the efficiency of the AI models themselves is optimized.

  • Real-time Batch Size Adjustment: Controlling throughput to prevent sudden power spikes.
  • Large Model -> sLLM (Lightweight): Transitioning to smaller, lightweight Large Language Models (sLLM) to reduce GPU power consumption without service downtime.

Summary

The core message of this diagram is that High-Quality/High-Resolution Data is the foundation for effective power management. By combining hardware solutions (ESS/PCS), software scheduling (K8s/Slurm), and AI model optimization (sLLM), a data center can significantly reduce operating expenses (OPEX) and ultimately increase profitability (Make money) through intelligent peak shaving.


#AI_DC #PowerControl #DataCenter #EnergyEfficiency #PeakShaving #GreenIT #MachineLearning #ESS #AIInfrastructure #GPUOptimization #Sustainability #TechInnovation