Power Capping in the Linux kernel

Power Capping in the Linux Kernel

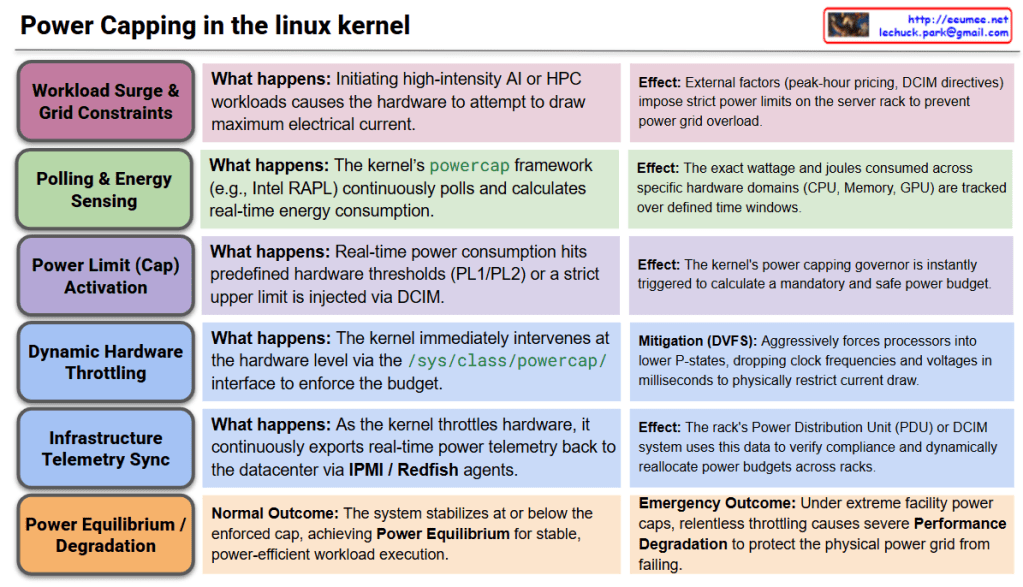
This architecture outlines the closed-loop logic flow of the Linux kernel’s powercap framework. It details how the kernel enforces strict energy limits on hardware to manage heavy AI workloads while coordinating with the datacenter’s external power grid and infrastructure.

  • Stage 1: Workload Surge & Power Grid ConstraintsWhen high-intensity AI or HPC workloads are dispatched, the hardware immediately attempts to draw maximum electrical current. Concurrently, external factors—such as peak-hour electricity pricing, facility power limits, or a Datacenter Infrastructure Management (DCIM) directive—may impose strict power constraints on the server rack.
  • Stage 2: Polling & Energy SensingTo monitor power draw, the kernel’s powercap framework utilizes hardware interfaces like Intel RAPL (Running Average Power Limit) or AMD Node Manager. It continuously polls and calculates real-time energy consumption, tracking the exact wattage and joules consumed across specific hardware domains (CPU, memory, GPU) over defined time windows.
  • Stage 3: Power Limit (Cap) ActivationIf the real-time power consumption hits predefined hardware thresholds (such as PL1 or PL2 limits), or if an external DCIM system injects a strict upper power limit via the /sys/class/powercap/ interface, the kernel’s power capping governor is instantly triggered into action.
  • Stage 4: Dynamic Hardware Throttling (Local Mitigation)To enforce the mandatory power budget, the kernel immediately intervenes at the hardware level. It aggressively utilizes DVFS (Dynamic Voltage and Frequency Scaling) to force the processors into lower P-states, dropping clock frequencies and voltages within milliseconds to physically restrict the electrical current draw.
  • Stage 5: Infrastructure Telemetry Sync (Global Mitigation)As the kernel throttles the hardware, it continuously exports real-time power telemetry back to the datacenter’s control plane via IPMI/Redfish agents. The rack’s Power Distribution Unit (PDU) or DCIM system uses this data to verify compliance with the power cap, allowing the facility to dynamically reallocate power budgets across different server racks.
  • Stage 6: Power Equilibrium / Performance Degradation
    • Normal Outcome: The system successfully stabilizes at or below the enforced power cap, achieving Power Equilibrium. The workload continues to execute stably, though at a dynamically calculated, power-efficient pace.
    • Emergency/Degraded Outcome: If the datacenter imposes an extreme power cap (e.g., during a facility power emergency), the kernel will relentlessly throttle the hardware. This causes severe Performance Degradation for the workload, but it successfully prevents catastrophic outcomes like tripping the datacenter’s power breakers.

Summary

  • The Linux kernel uses frameworks like RAPL to continuously monitor and calculate the exact energy consumption of server components during heavy workloads.
  • When hardware limits are reached or external datacenter power caps are applied, the kernel instantly throttles CPU/GPU frequencies and voltages to restrict electrical draw.
  • This system ensures the server stays strictly within its assigned power budget, sacrificing raw performance if necessary to protect the datacenter’s physical power grid from failing.

#LinuxKernel #PowerCapping #RAPL #PowerManagement #DataCenterInfrastructure #GreenComputing #HPC #DCIM #EnergyEfficiency

Power/Cooling in the linux kernel

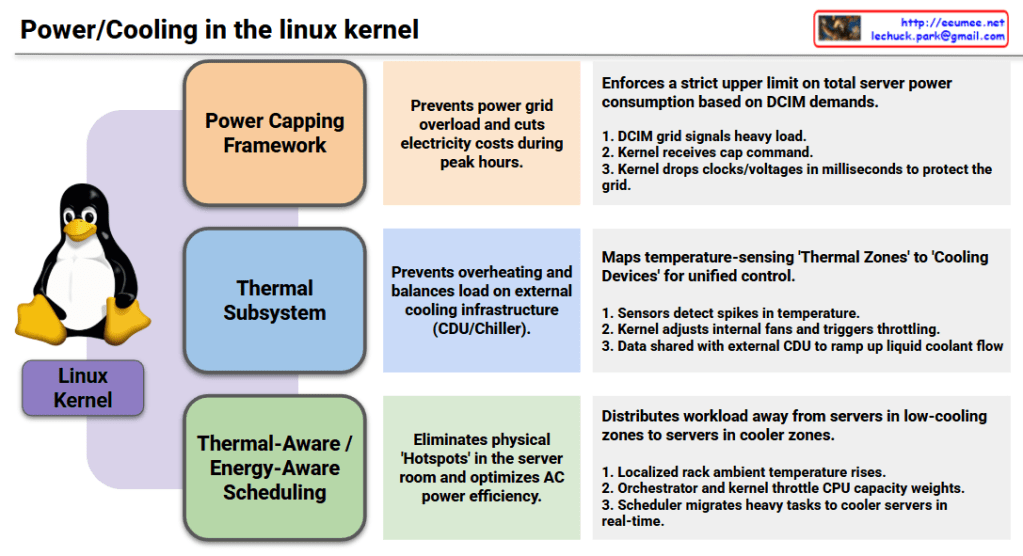
1. Power Capping Framework

  • Objective (Center): Prevents power grid overload and cuts electricity costs during peak hours.
  • Mechanism (Right): Enforces a strict upper limit on total server power consumption based on DCIM (Datacenter Infrastructure Management) demands.
    1. The DCIM grid signals a heavy load status.
    2. The Linux kernel receives the specific power capping command.
    3. The kernel immediately drops processor clocks and voltages in milliseconds to protect the local power grid.

2. Thermal Subsystem

  • Objective (Center): Prevents hardware overheating and balances the load on external cooling infrastructure, such as Coolant Distribution Units (CDUs) and chillers.
  • Mechanism (Right): Maps temperature-sensing ‘Thermal Zones’ directly to hardware ‘Cooling Devices’ for unified, holistic control.
    1. Hardware sensors detect sudden spikes in internal temperature.
    2. The kernel dynamically adjusts internal server fans and triggers safety throttling.
    3. Temperature telemetry data is actively shared with the external datacenter CDU to ramp up liquid coolant flow rates.

3. Thermal-Aware / Energy-Aware Scheduling

  • Objective (Center): Eliminates physical ‘Hotspots’ within the server room layout and optimizes overall air conditioning (AC) power efficiency.
  • Mechanism (Right): Distributes heavy workloads away from physical servers trapped in low-cooling zones to servers located in cooler zones.
    1. The localized ambient temperature around a specific server rack rises.
    2. The datacenter orchestrator and the kernel work together to throttle the target CPU’s capacity weights.
    3. The Linux scheduler automatically migrates heavy compute tasks to cooler servers across the room in real-time.

Modern Linux has evolved beyond managing isolated servers; it now acts as a holistic orchestrator that treats the datacenter’s power grid, liquid cooling loops, and air conditioning as a single, unified organism.

#LinuxKernel #PowerManagement #ThermalSubsystem #EnergyAwareScheduling #DatacenterInfrastructure #DCIM #LiquidCooling #GreenComputing #HPC #InfrastructureAutomation #CloudInfrastructure

With Gemini

Peak Shaving with Data

Graph Interpretation: Power Peak Shaving in AI Data Centers

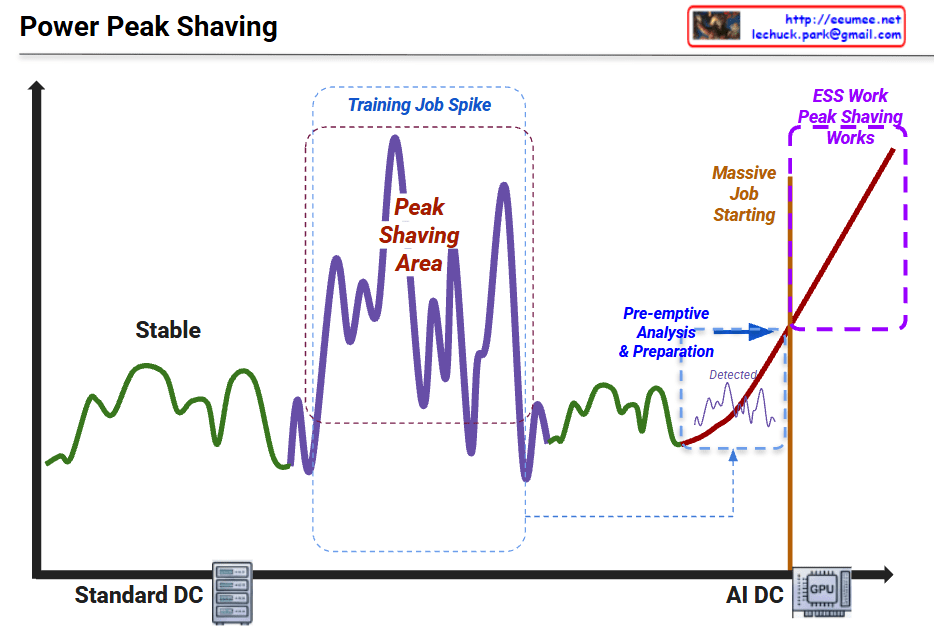
This graph illustrates the shift in power consumption patterns from traditional data centers to AI-driven data centers and the necessity of “Peak Shaving” strategies.

1. Standard DC (Green Line – Left)

  • Characteristics: Shows “Stable” power consumption.
  • Interpretation: Traditional server workloads are relatively predictable with low volatility. The power demand stays within a consistent range.

2. Training Job Spike (Purple Line – Middle)

  • Characteristics: Significant fluctuations labeled “Peak Shaving Area.”
  • Interpretation: During AI model training, power demand becomes highly volatile. The spikes (peaks) and valleys represent the intensive GPU cycles required during training phases.

3. AI DC & Massive Job Starting (Red Line – Right)

  • Characteristics: A sharp, vertical-like surge in power usage.
  • Interpretation: As massive AI jobs (LLM training, etc.) start, the power load skyrockets. The graph shows a “Pre-emptive Analysis & Preparation” phase where the system detects the surge before it hits the maximum threshold.

4. ESS Work & Peak Shaving (Purple Dotted Box – Top Right)

  • The Strategy: To handle the “Massive Job Starting,” the system utilizes ESS (Energy Storage Systems).
  • Action: Instead of drawing all power from the main grid (which could cause instability or high costs), the ESS discharges stored energy to “shave” the peak, smoothing out the demand and ensuring the AI DC operates safely.

Summary

  1. Volatility Shift: AI workloads (GPU-intensive) create much more extreme and unpredictable power spikes compared to standard data center operations.
  2. Proactive Management: Modern AI Data Centers require pre-emptive detection and analysis to prepare for sudden surges in energy demand.
  3. ESS Integration: Energy Storage Systems (ESS) are critical for “Peak Shaving,” providing the necessary power buffer to maintain grid stability and cost efficiency.

#DataCenter #AI #PeakShaving #EnergyStorage #ESS #GPU #PowerManagement #SmartGrid #TechInfrastructure #AIDC #EnergyEfficiency

with Gemini

GPU Throttling

GPU Throttling Architecture Analysis

This diagram illustrates the GPU’s power and thermal management system.

Key Components

1. Two Throttling Triggers

  • Power Throttling: Throttling triggered by power limits
  • Thermal Throttling: Throttling triggered by temperature limits

2. Different Control Approaches

  • Power Limit (Budget) Controller: Slow, Linear Step Down
  • Thermal Safety Controller: Fast, Hard Step Down
    • This aggressive response is necessary because overheating can cause immediate hardware damage

3. Priority Gate

Receives signals from both controllers and determines which limitation to apply.

4. PMU/SMU/DVFS Controller

The Common Control Unit that manages:

  • PMU: Power Management Unit
  • SMU: System Management Unit
  • DVFS: Dynamic Voltage and Frequency Scaling

5. Actual Adjustment Mechanisms

  • Clock Domain Controller: Reduces GPU Frequency
  • Voltage Regulator: Reduces GPU Voltage

6. Final Result

Lower Power/Temp (Throttled): Reduced power consumption and temperature in throttled state

Core Principle

When the GPU reaches power budget or temperature limits, it automatically reduces performance to protect the system. By lowering both frequency and voltage simultaneously, it effectively reduces power consumption (P ∝ V²f).


Summary

GPU throttling uses two controllers—power (slow, linear) and thermal (fast, aggressive)—that feed into a shared PMU/SMU/DVFS system to dynamically reduce clock frequency and voltage. Thermal throttling responds more aggressively than power throttling because overheating poses immediate hardware damage risks. The end result is lower power consumption and temperature, sacrificing performance to maintain system safety and longevity.


#GPUThrottling #ThermalManagement #PowerManagement #DVFS #GPUArchitecture #HardwareOptimization #ThermalSafety #PerformanceVsPower #ComputerHardware #GPUDesign #SystemManagement #ClockSpeed #VoltageRegulation #TechExplained #HardwareEngineering

With Claude

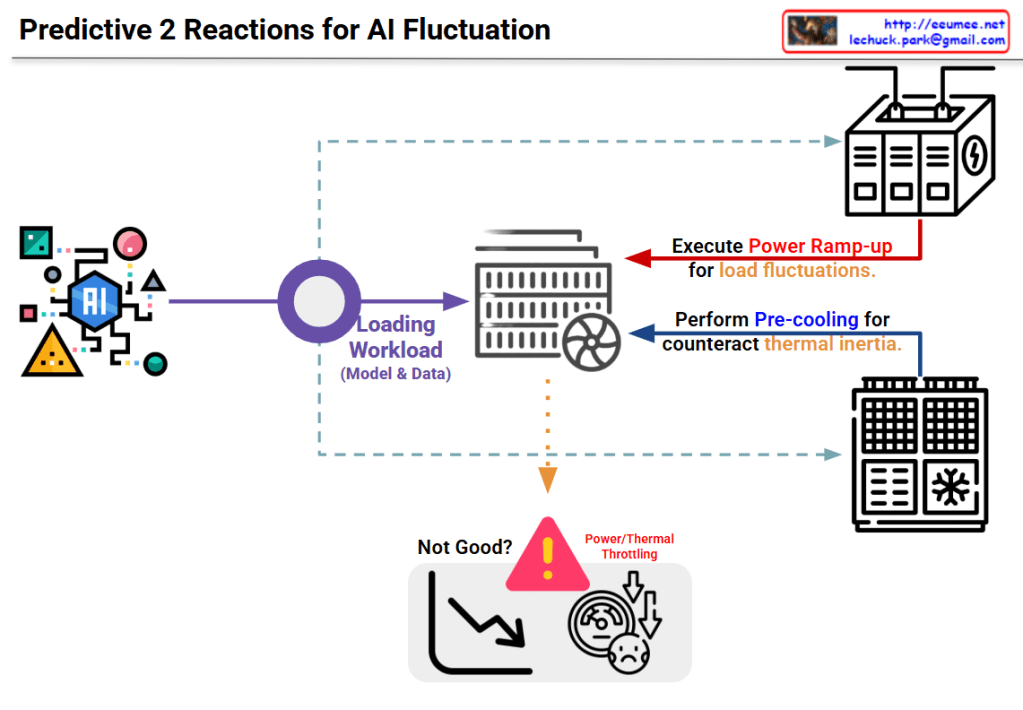
Predictive 2 Reactions for AI HIGH Fluctuation

Image Interpretation: Predictive 2-Stage Reactions for AI Fluctuation

This diagram illustrates a two-stage predictive strategy to address load fluctuation issues in AI systems.

System Architecture

Input Stage:

  • The AI model on the left generates various workloads (model and data)

Processing Stage:

  • Generated workloads are transferred to the central server/computing system

Two-Stage Predictive Reaction Mechanism

Stage 1: Power Ramp-up

  • Purpose: Prepare for load fluctuations
  • Method: The power supply system at the top proactively increases power in advance
  • Preventive measure to secure power before the load increases

Stage 2: Pre-cooling

  • Purpose: Counteract thermal inertia
  • Method: The cooling system at the bottom performs cooling in advance
  • Proactive response to lower system temperature before heat generation

Problem Scenario

The warning area at the bottom center shows problems that occur without these responses:

  • Power/Thermal Throttling
  • Performance degradation (downward curve in the graph)
  • System dissatisfaction state

Key Concept

This system proposes an intelligent infrastructure management approach that predicts rapid fluctuations in AI workloads and proactively adjusts power and cooling before actual loads occur, thereby preventing performance degradation.


Summary

This diagram presents a predictive two-stage reaction system for AI workload management that combines proactive power ramp-up and pre-cooling to prevent thermal throttling. By anticipating load fluctuations before they occur, the system maintains optimal performance without degradation. The approach represents a shift from reactive to predictive infrastructure management in AI computing environments.


#AIInfrastructure #PredictiveComputing #ThermalManagement #PowerManagement #AIWorkload #DataCenterOptimization #ProactiveScaling #AIPerformance #ThermalThrottling #SmartCooling #MLOps #AIEfficiency #ComputeOptimization #InfrastructureAsCode #AIOperations

With Claude

LLM goes with Computing-Power-Cooling

LLM’s Computing-Power-Cooling Relationship

This diagram illustrates the technical architecture and potential issues that can occur when operating LLMs (Large Language Models).

Normal Operation (Top Left)

  1. Computing Requires – LLM workload is delivered to the processor
  2. Power Requires – Power supplied via DVFS (Dynamic Voltage and Frequency Scaling)
  3. Heat Generated – Heat is produced during computing processes
  4. Cooling Requires – Temperature management through proper cooling systems

Problem Scenarios

Power Issue (Top Right)

  • Symptom: Insufficient power (kW & Quality)
  • Results:
    • Computing performance degradation
    • Power throttling or errors
    • LLM workload errors

Cooling Issue (Bottom Right)

  • Symptom: Insufficient cooling (Temperature & Density)
  • Results:
    • Abnormal heat generation
    • Thermal throttling or errors
    • Computing performance degradation
    • LLM workload errors

Key Message

For stable LLM operations, the three elements of Computing-Power-Cooling must be balanced. If any one element is insufficient, it leads to system-wide performance degradation or errors. This emphasizes that AI infrastructure design must consider not only computing power but also adequate power supply and cooling systems together.


Summary

  • LLM operation requires a critical balance between computing, power supply, and cooling infrastructure.
  • Insufficient power causes power throttling, while inadequate cooling leads to thermal throttling, both resulting in workload errors.
  • Successful AI infrastructure design must holistically address all three components rather than focusing solely on computational capacity.

#LLM #AIInfrastructure #DataCenter #ThermalManagement #PowerManagement #AIOperations #MachineLearning #HPC #DataCenterCooling #AIHardware #ComputeOptimization #MLOps #TechInfrastructure #AIatScale #GreenAI

WIth Claude

Power/Cooling impacts to AI Work

Power/Cooling Impacts on AI Work – Analysis

This slide summarizes research findings on how AI workloads impact power grids and cooling systems.

Key Findings:

📊 Reliability & Failure Studies

  • Large-Scale ML Cluster Reliability (Meta, 2024/25)
    • 1024-GPU job MTTF (Mean Time To Failure): 7.9 hours
    • 8-GPU job: 47.7 days
    • 16,384-GPU job: 1.8 hours
    • → Larger jobs = higher failure risk due to cooling/power faults amplifying errors

🔌 Silent Data Corruption (SDC)

  • SDC in LLM Training (2025)
    • Meta report: 6 SDC failures in 54-day pretraining run
    • Power droop, thermal stress → hardware faults → silent errors → training divergence

Inference Energy Efficiency

  • LLM Inference Energy Consumption (2025)
    • GPT-4o query benchmarks:
      • Short: 0.43 Wh
      • Medium: ~3.71 Wh
    • Batch 4→8: ~43% savings
    • Batch 8→16: ~43% savings per prompt
    • → PUE & infrastructure efficiency significantly impact inference cost, delay, and carbon footprint

🏭 Grid-Level Instability

  • AI-Induced Power Grid Disruptions (2024)
    • Model training causes power transients
    • Dropouts → hardware resets
    • Grid-level instability → node-level errors (SDC, restarts) → LLM job failures

🎯 Summary:

  1. Large-scale AI workloads face exponentially higher failure rates – bigger jobs are increasingly vulnerable to power/cooling system issues, with 16K-GPU jobs failing every 1.8 hours.
  2. Silent data corruption from thermal/power stress causes undetected training failures, while inference efficiency can be dramatically improved through batch optimization (43% energy reduction).
  3. AI training creates a vicious cycle of grid instability – power transients trigger hardware faults that cascade into training failures, requiring robust infrastructure design for power stability and fault tolerance.

#AIInfrastructure #MLOps #DataCenterEfficiency #PowerManagement #AIReliability #LLMTraining #SilentDataCorruption #EnergyEfficiency #GridStability #AIatScale #HPC #CoolingSystem #AIFailures #SustainableAI #InferenceOptimization

With Claude