Operation Evolutions

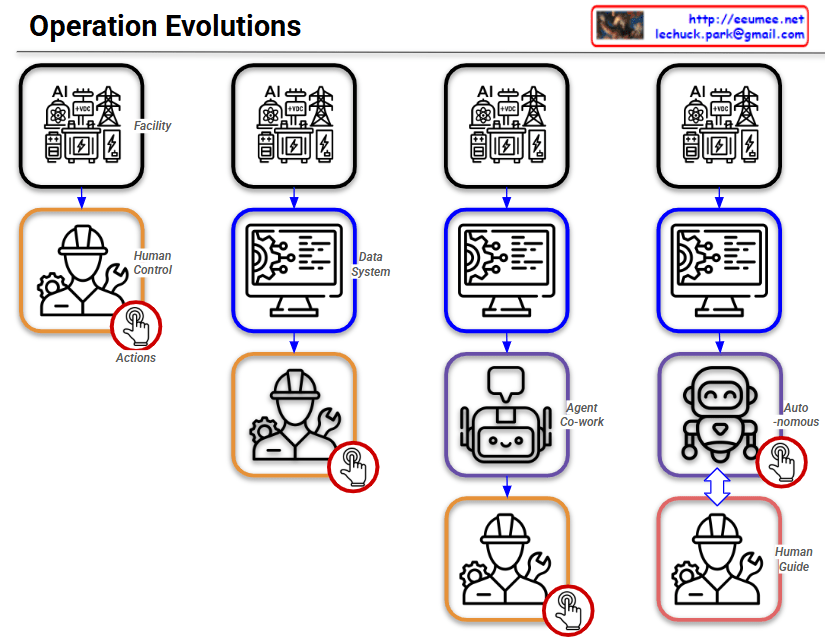
By following the red circle with the ‘Actions’ (clicking hand) icon, you can easily track how the control and operational authority shift throughout the four stages.

Stage 1: Human Control

  • Structure: Facility ➡️ Human Control
  • Description: This represents the most traditional, manual approach. Without a centralized data system, human operators directly monitor the facility’s status and manually execute all Actions based on their physical observations and judgment.

Stage 2: Data System

  • Structure: Facility ➡️ Data System ➡️ Human Control
  • Description: A monitoring or data system (like a dashboard) is introduced. Humans now rely on the data collected by the system to understand the facility’s condition. However, the final Actions are still manually performed by humans.

Stage 3: Agent Co-work

  • Structure: Facility ➡️ Data System ➡️ Agent Co-work ➡️ Human Control
  • Description: An AI Agent is introduced as an intermediary between the data system and the human operator. The AI analyzes the data and provides insights, recommendations, or assistance. Even with this support, the final decision-making and physical Actions remain entirely the human’s responsibility.

Stage 4: Autonomous (Auto-nomous)

  • Structure: Facility ➡️ Data System ➡️ Auto-nomous ↔️ Human Guide
  • Description: This is the ultimate stage of operational evolution. The authority to execute Actions has shifted from the human to the AI. The AI analyzes data, makes independent decisions, and autonomously controls the facility. The human’s role transitions from a direct controller to a ‘Human Guide’, supervising the AI and providing high-level directives. The two-way arrow indicates a continuous, interactive feedback loop where the human and AI collaborate to refine and optimize the system.

Summary:

This slide intuitively illustrates a paradigm shift in infrastructure operations: progressing from Direct Human Intervention ➡️ System-Assisted Cognition ➡️ AI-Assisted Operations (Co-work) ➡️ Fully Autonomous AI Control with Human Supervision.

#AIOps #AutonomousOperations #TechEvolution #DigitalTransformation #DataCenter #FacilityManagement #InfrastructureAutomation #SmartFacilities #AIAgents #FutureOfWork #HumanAndAI #Automation

with Gemini

The High Stakes of Ultra-High Density: Seconds to React, Massive Costs

This image visually compares the critical changes and risks that occur when a data center or IT infrastructure transitions to an “Ultra-high Density” environment across three key metrics.

1. Surge in Power Density (Top Row)

  • Past/Standard Environment (Blue): Racks typically operated at a power density of 4-10 kW per Rack.
  • Transition (Middle): The shift toward Ultra-high Density infrastructure (driven by AI, High-Performance Computing, etc.).
  • Current/Ultra-high Density (Red): Power density explodes to 100 kW per Rack, which is a 10-fold increase.

2. Drastic Drop in Response Time (Middle Row)

  • Past/Standard Environment: In the event of a cooling failure or system issue, operators had a comfortable golden window of 20-30 minutes to react before systems went down.
  • Transition: Focusing on the change in Response Time.
  • Current/Ultra-high Density: Due to the massive, instantaneous heat generation, the reaction window plummets to a mere 10-30 seconds. This makes manual human intervention practically impossible.

3. Explosion of Damage Costs (Bottom Row)

  • Past/Standard Environment: The financial loss caused by system downtime was around $10,000 (10K USD) per minute.
  • Transition: Focusing on the change in Damage costs.
  • Current/Ultra-high Density: Because of the high value of the equipment and the critical nature of the data being processed, the cost of downtime skyrockets to $100,000 (100K USD) per minute—a 10x increase.

💡 Overall Summary

The core message of this infographic is a strong warning: “In ultra-high density environments reaching 100kW per rack, the window for disaster response shrinks from minutes to mere seconds, while the financial loss per minute multiplies tenfold.” This perfectly illustrates why immediate, automated cooling and response systems (such as liquid cooling or AI-driven automation) are no longer optional, but mandatory for modern data centers.


#DataCenter #UltraHighDensity #HighDensityComputing #ITInfrastructure #Downtime #CostOfDowntime #RiskManagement

With Gemini

Legacy vs AI DC

Legacy DC vs. AI Factory

1. Legacy Data Center

  • Static Load: The flat line on the graph indicates that power and compute demands are stable, continuous, and highly predictable.
  • Air Cooling: Traditional fan-based air cooling systems are sufficient to manage the heat generated by standard, lower-density server racks.
  • Minutes Level Work: System responses, resource provisioning, and facility adjustments generally occur on a scale of minutes.
  • IT & OT Silo Ops: Information Technology (servers, networking) and Operational Technology (power, cooling facilities) are managed independently in isolated silos, with no real-time data exchange.

2. AI Factory (DC)

  • Dynamic/High-Density: The volatile, jagged graph illustrates how AI workloads create extreme, rapid power spikes and demand highly dense computing resources.
  • Liquid Cooling: The immense heat output from high-performance AI chips necessitates advanced liquid cooling solutions (represented by the water drop and circulation arrows) to maintain thermal efficiency.
  • Seconds Level Works: The physical infrastructure must be highly agile, detecting and responding to sudden dynamic workload changes and thermal shifts within seconds.
  • Workload Aware: The facility dynamically adapts its cooling and power based on real-time AI computing needs. Establishing this requires robust “IT/OT Data Convergence” and the utilization of “High-Fidelity Data” as key components of a broader “Digitalization” strategy.

Summary

  1. Legacy data centers are designed for predictable, static loads using traditional air cooling, with IT and facility operations (OT) isolated from one another.
  2. AI Factories must handle highly volatile, high-density workloads, making liquid cooling and instantaneous, seconds-level infrastructure responses mandatory.
  3. Transitioning to a true “Workload Aware” facility requires a strong “Digitalization” strategy centered around “IT/OT Data Convergence” and “High-Fidelity Data.”

#AIFactory #DataCenter #LiquidCooling #WorkloadAware #ITOTConvergence #HighFidelityData #Digitalization #AIInfrastructure

With Gemini

DC Changes

Image Analysis: The Evolution of Infrastructure

This diagram illustrates the evolutionary progression of infrastructure environments and operational methodologies over time. The upward-pointing arrow indicates the escalating complexity, density, and sophistication of these technologies.

  • Phase 1: Internet Era
    • Environment: Legacy Data Center
    • Core Technology: Internet
    • Operating Model: Human Operating
    • Characteristics: The foundational stage where human operators physically monitor and control the infrastructure, relying heavily on manual intervention and traditional toolsets.
  • Phase 2: Mobile & Cloud Era
    • Environment: Hyperscale Data Center
    • Core Technology: Mobile & Cloud
    • Operating Model: Digital Operating
    • Characteristics: A digital transformation phase designed to handle explosive data growth. This stage utilizes dashboards, analytics, and automated systems to significantly improve operational efficiency and scale.
  • Phase 3: Artificial Intelligence Era
    • Environment: AI Data Center
    • Core Technology: AI/LLM (Large Language Models)
    • Operating Model: AI Agent Operating
    • Characteristics: A highly advanced stage where an AI-driven agent takes over the integrated operations of the platform. It functions autonomously to manage and optimize the system, specifically to cope with the “Ultra-high density & Ultra-volatility” characteristic of modern AI workloads.

Summary

The diagram outlines a fundamental paradigm shift in infrastructure management. It traces the journey from early, manual-heavy environments to digitalized systems, ultimately culminating in an advanced era where an AI-driven agent autonomously manages operations for AI Data Centers, expertly handling environments defined by extreme density and volatility.

#DataCenter #AIAgent #LLM #Hyperscale #DigitalOperating #InfrastructureEvolution #UltraHighDensity #TechTrends


With Gemini

SCR(Short Circuit Ratio)

This image is an infographic that explains SCR (Short Circuit Ratio) and why it matters for AI/data center power stability. The main idea is: SCR compares grid strength at the connection point (PCC) against the data center’s load size—lower SCR means more voltage instability.


1) Top: SCR formula

  • SCR = Ssc / Pload
    • Ssc: Short-circuit MVA at the PCC
      → the grid’s strength / stiffness at the point where the data center connects
    • Pload: Rated MW of the data center load
      → the data center’s rated power demand

2) Middle: What high vs. low Ssc means (data center impact)

  • High Ssc (strong grid)
    → the grid can absorb sudden load changes, so voltage dips are smaller and operation is more stable.
  • Low Ssc (weak grid)
    → the same load change causes larger voltage swings, increasing the risk of trips, protection actions, or UPS transfers.

3) PCC definition (center-lower)

  • PCC (Point of Common Coupling)
    → the grid-to-data-center “handoff point” where voltage and power quality are assessed.

4) Bottom: Grid categories by SCR

  • Strong Grid: SCR > 3
    → strong voltage support; waveform remains stable even with load fluctuations.
  • Weak Grid: 2 ≤ SCR < 3 (shown as 3 > SCR ≥ 2 in the image)
    → voltage is sensitive; small load changes can cause noticeable voltage variation.
  • Very Weak Grid: SCR < 2
    → difficult to maintain stable operation; high risk of instability or (in extreme cases) grid collapse.

summary

  1. SCR = grid strength at PCC (Ssc) ÷ data center load (Pload).
  2. Higher SCR means smaller voltage dips and more stable operation.
  3. Lower SCR increases power-quality risk (voltage swings, trips, UPS transfers).

#SCR #ShortCircuitRatio #PCC #GridStrength #PowerQuality #DataCenter #AIDatacenter #VoltageStability #BESS #GridForming #SynchronousCondenser #IBR

With ChatGPT

Predictive/Proactive/Reactive

The infographic visualizes how AI technologies (Machine Learning and Large Language Models) are applied across Predictive, Proactive, and Reactive stages of facility management.


1. Predictive Stage

This is the most advanced stage, anticipating future issues before they occur.

  • Core Goal: “Predict failures and replace planned.”
  • Icon Interpretation: A magnifying glass is used to examine a future point on a rising graph, identifying potential risks (peaks and warnings) ahead of time.
  • Role of AI:
    • [ML] The Forecaster: Analyzes historical data to calculate precisely when a specific component is likely to fail in the future.
    • [LLM] The Interpreter: Translates complex forecast data and probabilities into plain language reports that are easy for human operators to understand.
  • Key Activity: Scheduling parts replacement and maintenance windows well before the predicted failure date.

2. Proactive Stage

This stage focuses on optimizing current conditions to prevent problems from developing.

  • Core Goal: “Optimize inefficiencies before they become problems.”
  • Icon Interpretation: On a stable graph, a wrench is shown gently fine-tuning the system for optimization, protected by a shield icon representing preventative measures.
  • Role of AI:
    • [ML] The Optimizer: Identifies inefficient operational patterns and determines the optimal configurations for current environmental conditions.
    • [LLM] The Advisor: Suggests specific, actionable strategies to improve efficiency (e.g., “Lower cooling now to save energy”).
  • Key Activity: Dynamically adjusting system settings in real-time to maintain peak efficiency.

3. Reactive Stage

This stage deals with responding rapidly and accurately to incidents that have already occurred.

  • Core Goal: “Identify root cause instantly and recover rapidly.”
  • Icon Interpretation: A sharp drop in the graph accompanied by emergency alarms, showing an urgent repair being performed on a broken server rack.
  • Role of AI:
    • [ML] The Filter: Cuts through the noise of massive alarm volumes to instantly isolate the true, critical issue.
    • [LLM] The Troubleshooter: Reads and analyzes complex error logs to determine the root cause and retrieves the correct Standard Operating Procedure (SOP) or manual.
  • Key Activity: Rapidly executing the guided repair steps provided by the system.

Summary

  • The image illustrates the evolution of data center operations from traditional Reactive responses to intelligent Proactive optimization and Predictive maintenance.
  • It clearly delineates the roles of AI, where Machine Learning (ML) handles data analysis and forecasting, while Large Language Models (LLMs) interpret these insights and provide actionable guidance.
  • Ultimately, this integrated AI approach aims to maximize uptime, enhance energy efficiency, and accelerate incident recovery in critical infrastructure.

#DataCenter #AIOps #PredictiveMaintenance #SmartInfrastructure #ArtificialIntelligence #MachineLearning #LLM #FacilityManagement #ITOps

with Gemini

Proactive Cooling

The provided image illustrates the fundamental shift in data center thermal management from traditional Reactive methods to AI-driven Proactive strategies.


1. Comparison of Control Strategies

The slide contrasts two distinct approaches to managing the cooling load in a high-density environment, such as an AI data center.

FeatureReactive (Traditional)Proactive (Advanced)
PhilosophyAct After: Responds to changes.Act Before: Anticipates changes.
MechanismPID Control: Proportional-Integral-Derivative.MPC: Model Predictive Control.
ScopeLocal Control: Focuses on individual units/sensors.Central ML Control: Data-driven, system-wide optimization.
LogicFeedback-based (error correction).Feedforward-based (predictive modeling).

2. Graph Analysis: The “Sensing & Delay” Factor

The graph on the right visualizes the efficiency gap between these two methods:

  • Power (Red Line): Represents the IT load or power consumption which generates heat.
  • Sensing & Delay: There is a temporal gap between when a server starts consuming power and when the cooling system’s sensors detect the temperature rise and physically ramp up the fans or chilled water flow.
  • Reactive Cooling (Dashed Blue Line): Because it “acts after,” the cooling response lags behind the power curve. This often results in thermal overshoot, where the hardware momentarily operates at higher temperatures than desired, potentially triggering throttling.
  • Proactive Cooling (Solid Blue Line): By using Model Predictive Control (MPC), the system predicts the impending power spike. It initiates cooling before the heat is fully sensed, aligning the cooling curve more closely with the power curve to maintain a steady temperature.

3. Technical Implications for AI Infrastructure

In modern data centers, especially those handling fluctuating AI workloads (like LLM training or high-concurrency inference), the “Sensing & Delay” in traditional PID systems can lead to significant energy waste and hardware stress. MPC leverages historical data and real-time telemetry to:

  1. Reduce PUE (Power Usage Effectiveness): By avoiding over-cooling and sudden spikes in fan power.
  2. Improve Reliability: By maintaining a constant thermal envelope, reducing mechanical stress on chips.
  3. Optimize Operational Costs: Through centralized, intelligent resource allocation.

Summary

  1. Proactive Cooling utilizes Model Predictive Control (MPC) and Machine Learning to anticipate heat loads before they occur.
  2. Unlike traditional PID systems that respond to temperature errors, MPC eliminates the Sensing & Delay lag by acting on predicted power spikes.
  3. This shift enables superior energy efficiency and thermal stability, which is critical for high-density AI data center operations.

#DataCenter #AICooling #ModelPredictiveControl #MPC #ThermalManagement #EnergyEfficiency #SmartInfrastructure #PUEOptimization #MachineLearning

With Gemini