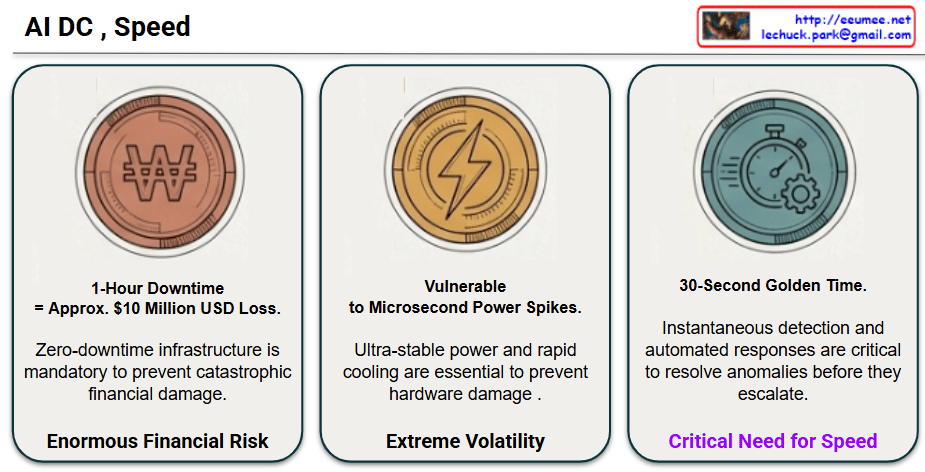
1. Enormous Financial Risk
The first section addresses the overwhelming costs associated with system failures. In an AI infrastructure environment handling intensive computing loads, just a single hour of downtime results in an astronomical financial loss of approximately $10 million USD. This indicates that system outages are not merely service delays but catastrophic blows to the business. Therefore, securing a zero-downtime infrastructure architecture is an absolute prerequisite under any circumstances.
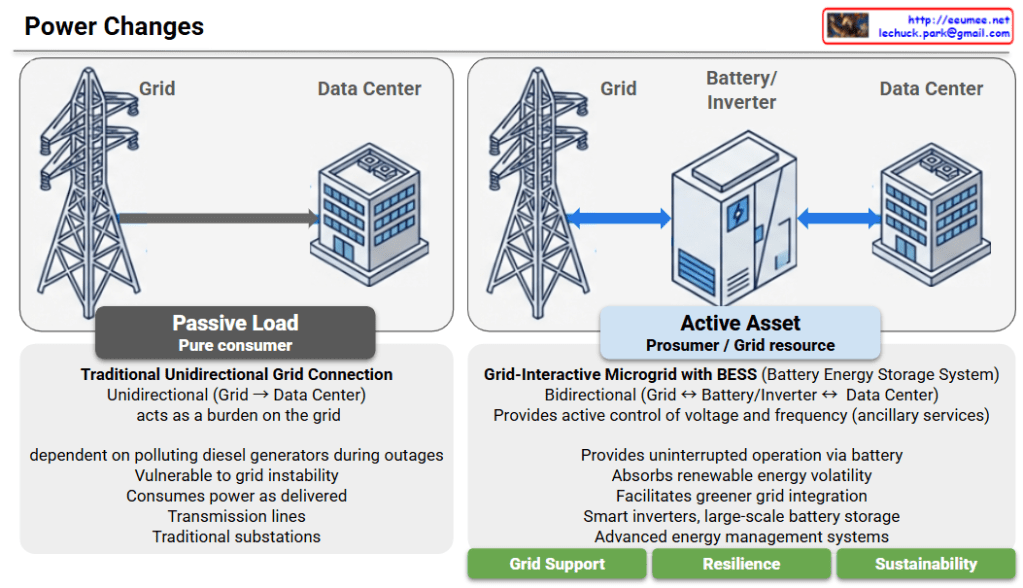
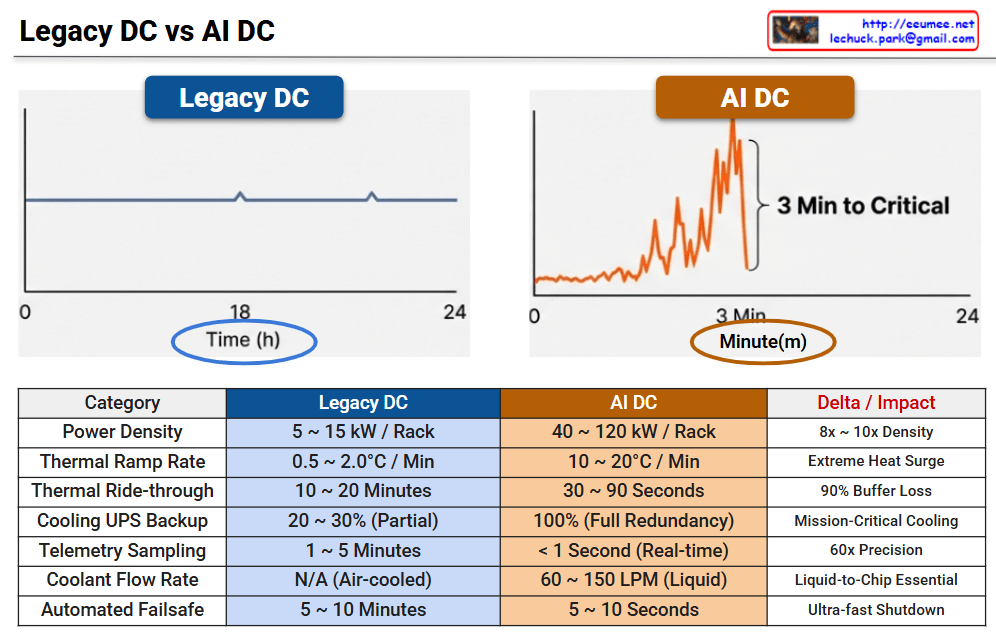
2. Extreme Volatility
The second section warns about the unique vulnerabilities and extreme volatility of AI system hardware. High-density power systems are so sensitive that even microsecond-level power spikes can cause permanent hardware damage. To safely protect these systems, the image highlights that ultra-stable power management, combined with rapid precision or direct liquid cooling infrastructure to immediately control surging heat, is absolutely necessary.
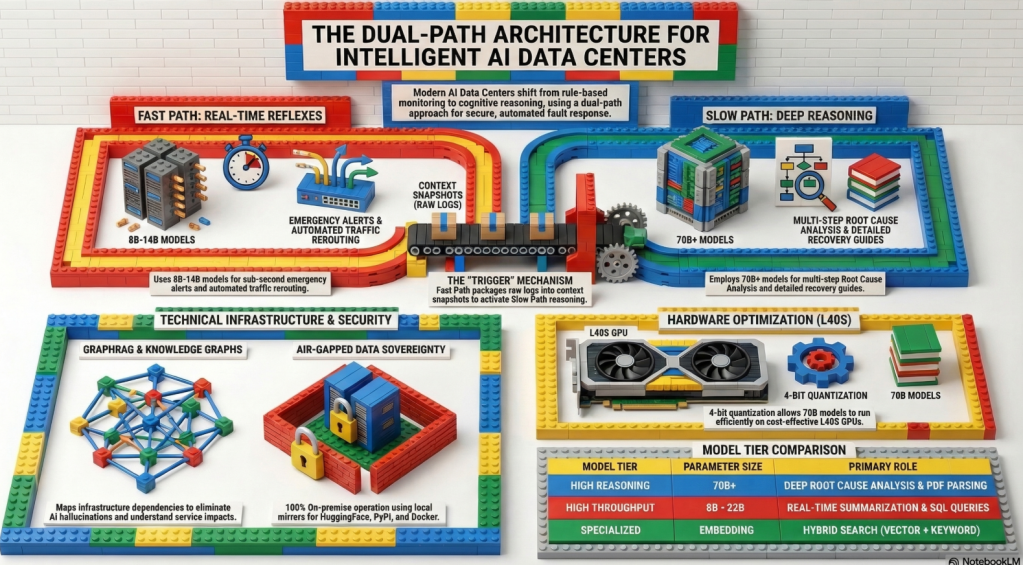
3. Critical Need for Speed
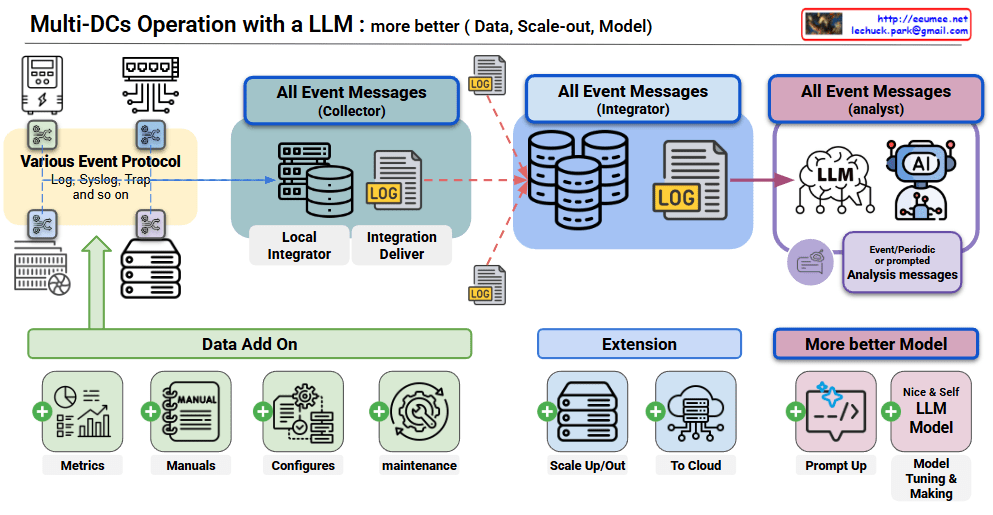
The final section emphasizes “Speed” as the ultimate solution to control the massive financial and physical risks mentioned above. When minor anomalies occur in the system, the “golden time” to prevent them from escalating into irreversible, large-scale failures is a mere 30 seconds. Because human intervention is impossible within this short timeframe, the conclusion is that an AI-driven, fully automated, and ultra-fast response system must be deeply integrated into the infrastructure to instantly detect and autonomously resolve issues.
💡 Executive Summary
“The only effective strategy to defend against astronomical downtime costs and microsecond-level hardware damage in AI Data Centers is to build an ultra-fast, automated operational system that instantly detects anomalies and autonomously resolves them within the 30-second golden time.“
#AIDC #ZeroDowntime #AI_Driven_Operations #AutomatedResponse #InfrastructureRisk #HighDensityPower #MTTR_Minimization