AI agent fro DC Operations

Data & Knowledge Driven AI Agent for Data Center Operations

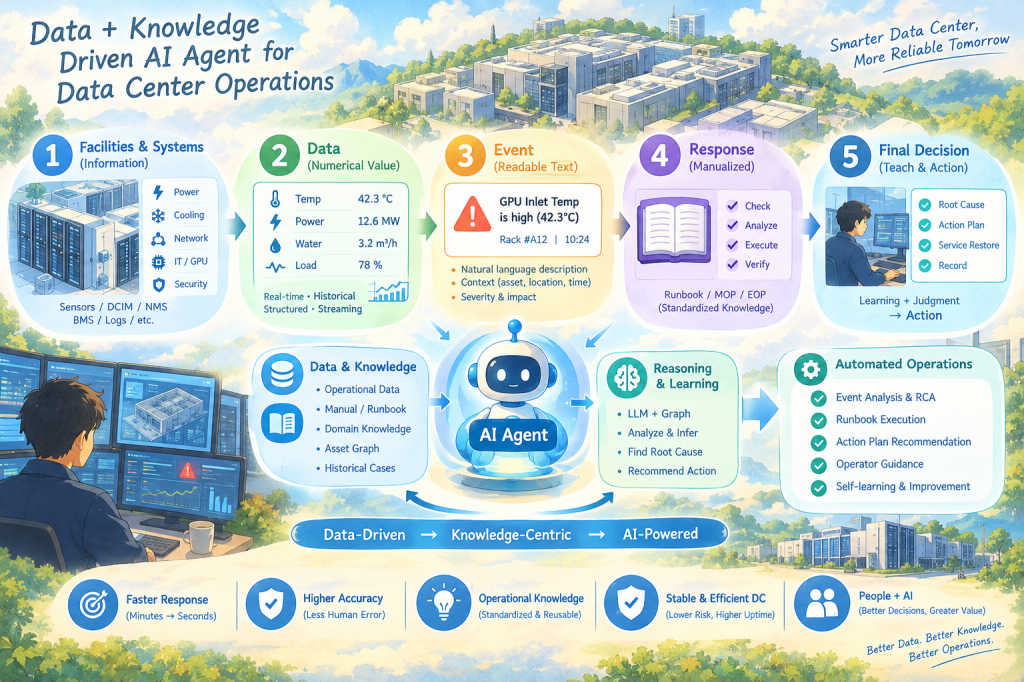
This illustration describes how data center operations can evolve from facility data → operational knowledge → AI Agent → automated operations.

The key message is not simply that AI controls data center equipment.

Rather, it shows how AI Agents can connect operational data with accumulated human knowledge, understand operational situations, reason about incidents, and support or automate operational actions.


1. Facilities & Systems

The process starts with the physical infrastructure and operational systems of the data center.

The illustration represents:

  • Power
  • Cooling
  • Network
  • IT / GPU
  • Security
  • Environment

Sensors and systems continuously generate operational information.

Systems such as DCIM, NMS, BMS, and log platforms collect this information.

In simple terms:

Facilities generate information, and systems collect it.


2. Data — From Information to Metrics

Facility information is transformed into measurable operational data.

For example:

  • Temperature → 42.3°C
  • Power Load → 12.6 MW
  • Water Flow → 3.2 m³/h
  • Utilization → 78%

The important point is that the AI Agent uses both:

Real-time Data + Historical Data

Real-time data tells the Agent what is happening now, while historical data provides the operational context and previous experience.


3. Event — Turning Numbers into Meaning

Raw numbers are not always meaningful to operators.

Therefore, data is transformed into understandable events.

For example:

GPU Inlet Temperature is high (42.3°C)

Now the numerical value has become a meaningful operational event.

The event also contains context such as:

What happened + Where + When + Severity + Impact

This is important because the AI Agent does not need to operate only on raw numbers. It can reason about meaningful operational situations.


4. Response — Operational Knowledge

When an event occurs, traditional operations rely on manuals and experienced operators.

The illustration represents this knowledge through:

  • Runbook
  • MOP
  • EOP
  • SOP
  • Best Practices

A typical response process can be:

Check → Analyze → Execute → Verify

This represents the transformation of human experience into reusable operational knowledge.

Human Experience → Documentation → Operational Knowledge

This knowledge becomes one of the most important assets for the AI Agent.


5. Final Decision — Judgment & Action

The final stage goes beyond detecting an event.

The operational process becomes:

Root Cause → Action Plan → Service Restore → Record

Traditionally, experienced operators perform much of this reasoning manually.

With an AI Agent, operational data and knowledge can be combined to support:

  • Root-cause analysis
  • Action recommendations
  • Runbook execution
  • Operator guidance
  • Controlled automation

In a real data center, however, autonomous action should be governed by policies, safety controls, and human approval where required.


The Center of the Illustration — AI Agent

The AI Agent sits at the center because it connects Data and Knowledge.

Data

  • Operational Data
  • Facility & Asset Data
  • Event & Incident Data
  • Historical Cases
  • Asset / Relationship Data

Knowledge

  • Manuals
  • Runbooks
  • SOP / MOP / EOP
  • Domain Knowledge
  • Best Practices
  • Past Cases & Lessons

The Agent combines these two layers to perform:

Learn → Reason → Act

A simple way to express the concept is:

Data tells the Agent what is happening.
Knowledge tells the Agent what it means and what to do.


The Core Message

The most important point of the illustration is that the AI Agent itself is not the foundation.

The real foundation is:

Data → Knowledge → AI Agent → Operations

Without accurate data, the Agent cannot reliably understand the current state.

Without structured operational knowledge, the Agent cannot reliably determine what the situation means or what response is appropriate.

Therefore, the real objective of AI-enabled data center operations is not simply:

“Deploy AI.”

It is:

“Make operational data and knowledge usable by AI.”


The Transformation of Data Center Operations

The bottom of the illustration shows:

Data-Driven → Knowledge-Centric → AI-Powered

This represents the evolution of operational models.

Traditional Operations

Human → Data → Manual Analysis → Manual Action

AI Agent-Based Operations

Data + Knowledge → AI Agent → Reasoning → Recommended / Controlled Action

The role of people does not disappear.

Instead, it changes.

AI handles repetitive monitoring, analysis, and operational assistance, while people focus more on judgment, decision-making, exception handling, and continuous improvement.

This is why the final concept is:

People + AI

rather than simply AI replaces People.


One-Sentence Summary

By connecting data generated from data center facilities with operational knowledge, an AI Agent can understand, reason, and support or automate operational actions—transforming human-centered operations into data- and knowledge-driven intelligent operations.

#AIDC #DataCenter #AIDataCenter #AIAgent #DataDriven #KnowledgeDriven #AIOps #DCIM #DataCenterOperations #OperationalAutomation #DigitalTransformation #DataAndKnowledge #IntelligentOperations #HumanAndAI

With ChatGPT

Data Center Cost

Traditional vs AI Data Center

This infographic provides a clear at-a-glance comparison of the changing cost structures between Traditional Data Centers and Artificial Intelligence (AI) Data Centers. It visualizes how the focus of costs for both building (CAPEX) and operating (OPEX) data centers is dramatically shifting in response to technological advancements and the explosion in AI demand.This infographic provides a clear at-a-glance comparison of the changing cost structures between Traditional Data Centers and Artificial Intelligence (AI) Data Centers. It visualizes how the focus of costs for both building (CAPEX) and operating (OPEX) data centers is dramatically shifting in response to technological advancements and the explosion in AI demand.

1. Overall Image Structure The image is split vertically down the middle, representing the ‘Traditional Data Center (Traditional DC)’ on the left and the ‘AI Data Center (AI DC)’ on the right. Each side is majorly categorized into ‘1. Build-out Costs (CAPEX)’, ‘2. Operating Costs (OPEX)’, and a bottom section dedicated to ‘Efficiency Focus’. Notably, the AI Data Center side features additional blocks for ‘Service & Damage Costs’ and ‘Risk Reduction’.

2. Detailed Breakdown

  • Comparison of Build-out Costs (CAPEX):
    • Traditional Data Center: Focuses on the general construction process of acquiring spacious Land (Terrain), building a standard structure (Building), and installing Power Infrastructure (Electrical Systems) and HVAC Systems (Cooling Systems).
    • AI Data Center: Shifts focus from simple construction to technology-intensive infrastructure. Instead of standard racks, High-Density Racks (HPC Racks) are densely packed, and to manage the immense heat, Direct Liquid Cooling (DLC) Systems are depicted as essential, replacing traditional air cooling. The visual density of the server cluster standing on the terrain is much higher.
  • Comparison of Operating Costs (OPEX):
    • Traditional Data Center: Shows a gradual and moderate increasing trend over time for all OPEX categories: Power (Energy Costs), Staff (Labor Costs), Maintenance (Facility Maintenance), and Water (Water Costs). There is a relative balance among the four categories.
    • AI Data Center: Completely breaks from the traditional trend. It shows an overwhelming and explosive increase in Power (Massive Energy Increase) costs, depicted as a gigantic orange-to-yellow bar chart. The text next to the chart explicitly states, “IT power is mandatory, hard to reduce.” Compared to the power costs, the costs for staff, maintenance, and water are displayed as relatively negligible. A flame shape is added next to the power icon, hinting at high heat generation.
  • AI Data Center Unique Elements: New Risks and Solutions
    • Service & Damage Costs: Visualizes how “GPU Server Damages” and “AI Service Interruptions”, which were not major OPEX categories in traditional data centers, have emerged as enormous damage costs in AI DCs. This is depicted through an exploding server rack and shattered block icons.
    • Risk Reduction: Presents “Staff Efficiency” as the critical key to reducing these fatal risks. It shows professional staff monitoring dashboards, with arrows connecting this efficient operation to solving problems like cooling inefficiency and ultimately preventing risks.
  • Efficiency Focus: The bottom section emphasizes ‘Cooling Energy Efficiency’ (smart sensors, airflow optimization) and ‘Operational Staff Efficiency’ (automation, expert tools) as common challenges for both types of data centers. On the AI DC side, this staff efficiency is re-emphasized as a critical driver for power management and risk reduction.

Summary

The core message of this infographic is the fundamental revolution in cost structures brought about by the transition to AI Data Centers. While Traditional Data Centers focused on the physical construction costs of land and buildings and a balance among various operational items, AI Data Centers see CAPEX concentrated in high-density and liquid cooling infrastructure, and at the operational stage, overwhelming power costs account for most of the OPEX. Furthermore, high-ticket damage costs like GPU server failures or service interruptions, which were negligible in traditional centers, have emerged as major new OPEX items, showing that predicting and preventing these fatal risks through expert operating staff has become the most important efficiency challenge, going beyond just saving electricity.The core message of this infographic is the fundamental revolution in cost structures brought about by the transition to AI Data Centers. While Traditional Data Centers focused on the physical construction costs of land and buildings and a balance among various operational items, AI Data Centers see CAPEX concentrated in high-density and liquid cooling infrastructure, and at the operational stage, overwhelming power costs account for most of the OPEX. Furthermore, high-ticket damage costs like GPU server failures or service interruptions, which were negligible in traditional centers, have emerged as major new OPEX items, showing that predicting and preventing these fatal risks through expert operating staff has become the most important efficiency challenge, going beyond just saving electricity.

#DataCenter #DataCenterCost #AIDataCenter #HighPerformanceComputing #HPC #CAPEX #OPEX #PowerCost #LiquidCooling #GPU #InfrastructureInvestment #DataCenterOperations #RiskManagement

With Gemini

Network Monitoring For Facilities

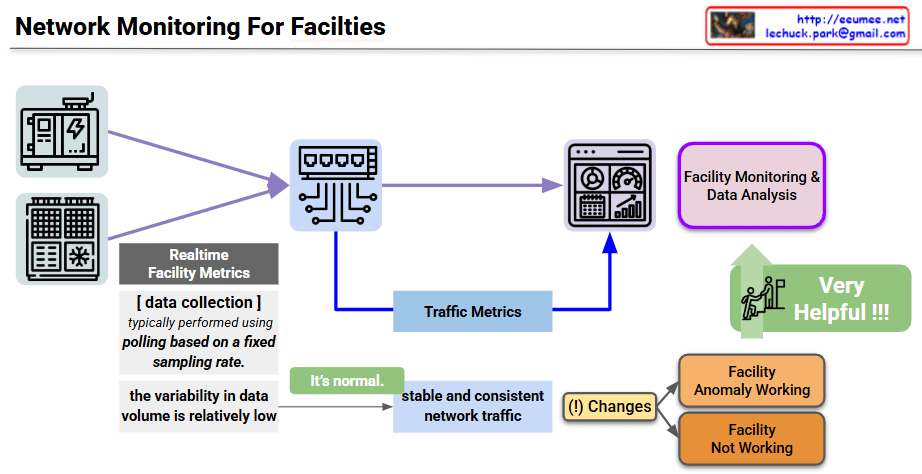
The provided image is a conceptual diagram illustrating how to monitor the status and detect anomalies in critical industrial facility infrastructure (such as power and cooling) through network traffic patterns. I also noticed the author’s information (Lechuck) in the top right corner! Let’s break down the main data flow and core ideas of your diagram step-by-step.

1. Realtime Facility Metrics

  • Target: Physical facility equipment such as generators (power infrastructure) and HVAC/cooling units.
  • Collection Method: A central monitoring server primarily uses a Polling method, requesting and receiving status data from the equipment based on a fixed sampling rate.
  • Characteristics: Because a specific amount of data is exchanged at designated times, the variability in data volume during normal operation is relatively low.

2. Traffic Metrics (Inferring Status via Traffic Characteristics)

This section contains the core insight of the diagram. Beyond just analyzing the payload of the collected sensor data, the pattern of the network traffic itself is utilized as an indicator of the facility’s health.

  • Normal State (It’s normal): When the equipment is operating normally, the network traffic occurs in a very stable and consistent manner in sync with the polling cycle.
  • Detecting Traffic Changes ((!) Changes): If a change occurs in this expected stable traffic pattern (e.g., traffic spikes, response delays, or disconnections), it is flagged as an anomaly in the facility.
  • Status Classification: Based on these abnormal traffic patterns, the system can infer whether the equipment is operating abnormally (Facility Anomaly Working) or has completely stopped functioning (Facility Not Working).

3. Facility Monitoring & Data Analysis

  • This architecture combines standard dashboard monitoring with Traffic Metrics extracted from network switches, feeding them into the data analysis system.
  • This cross-validation approach is highly effective for distinguishing between actual sensor data errors and network segment failures. As highlighted in the diagram, this ultimately improves the overall reliability of the facility monitoring system (Very Helpful !!!).

💡 Summary

This architecture presents a highly intuitive and efficient approach to data center and facility operations. By leveraging the network engineering characteristic that facility equipment communicates in regular patterns, it demonstrates an excellent monitoring logic. It allows operators to perform initial fault detection almost immediately simply by observing “changes in the consistency of network traffic,” even before conducting complex sensor data analysis.

#NetworkMonitoring #DataCenterOperations #FacilityManagement #TrafficAnalysis #AnomalyDetection #NetworkEngineering #ITInfrastructure #AIOps #SmartFacilities

With Gemini