Peak Shaving with Data

Graph Interpretation: Power Peak Shaving in AI Data Centers

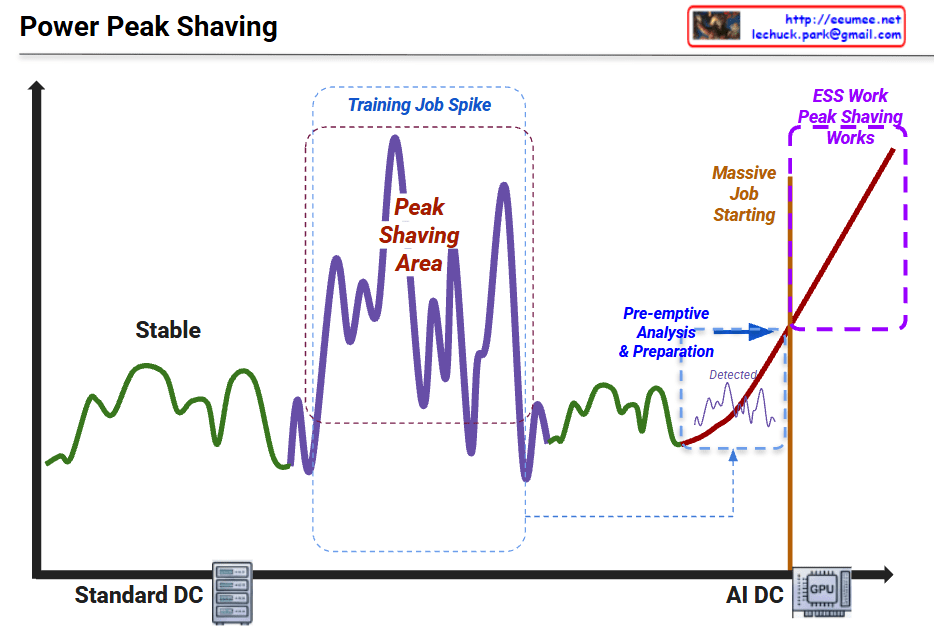
This graph illustrates the shift in power consumption patterns from traditional data centers to AI-driven data centers and the necessity of “Peak Shaving” strategies.

1. Standard DC (Green Line – Left)

  • Characteristics: Shows “Stable” power consumption.
  • Interpretation: Traditional server workloads are relatively predictable with low volatility. The power demand stays within a consistent range.

2. Training Job Spike (Purple Line – Middle)

  • Characteristics: Significant fluctuations labeled “Peak Shaving Area.”
  • Interpretation: During AI model training, power demand becomes highly volatile. The spikes (peaks) and valleys represent the intensive GPU cycles required during training phases.

3. AI DC & Massive Job Starting (Red Line – Right)

  • Characteristics: A sharp, vertical-like surge in power usage.
  • Interpretation: As massive AI jobs (LLM training, etc.) start, the power load skyrockets. The graph shows a “Pre-emptive Analysis & Preparation” phase where the system detects the surge before it hits the maximum threshold.

4. ESS Work & Peak Shaving (Purple Dotted Box – Top Right)

  • The Strategy: To handle the “Massive Job Starting,” the system utilizes ESS (Energy Storage Systems).
  • Action: Instead of drawing all power from the main grid (which could cause instability or high costs), the ESS discharges stored energy to “shave” the peak, smoothing out the demand and ensuring the AI DC operates safely.

Summary

  1. Volatility Shift: AI workloads (GPU-intensive) create much more extreme and unpredictable power spikes compared to standard data center operations.
  2. Proactive Management: Modern AI Data Centers require pre-emptive detection and analysis to prepare for sudden surges in energy demand.
  3. ESS Integration: Energy Storage Systems (ESS) are critical for “Peak Shaving,” providing the necessary power buffer to maintain grid stability and cost efficiency.

#DataCenter #AI #PeakShaving #EnergyStorage #ESS #GPU #PowerManagement #SmartGrid #TechInfrastructure #AIDC #EnergyEfficiency

with Gemini

Peak Shaving


“Power – Peak Shaving” Strategy

The image illustrates a 5-step process for a ‘Peak Shaving’ strategy designed to maximize power efficiency in data centers. Peak shaving is a technique used to reduce electrical load during periods of maximum demand (peak times) to save on electricity costs and ensure grid stability.

1. IT Load & ESS SoC Monitoring

This is the data collection and monitoring phase to understand the current state of the system.

  • Grid Power: Monitoring the maximum power usage from the external power grid.
  • ESS SoC/SoH: Checking the State of Charge (SoC) and State of Health (SoH) of the Energy Storage System (ESS).
  • IT Load (PDU): Measuring the actual load through Power Distribution Units (PDUs) at the server rack level.
  • LLM/GPU Workload: Monitoring the real-time workload of AI models (LLM) and GPUs.

2. ML-based Peak Prediction

Predicting future power demand based on the collected data.

  • Integrated Monitoring: Consolidating data from across the entire infrastructure.
  • Machine Learning Optimization: Utilizing AI algorithms to accurately predict when power peaks will occur and preparing proactive responses.

3. Peak Shaving Via PCS (Power Conversion System)

Utilizing physical energy storage hardware to distribute the power load.

  • Pre-emptive Analysis & Preparation: Determining the “Time to Charge.” The system charges the batteries when electricity rates are low.
  • ESS DC Power: During peak times, the stored Direct Current (DC) in the ESS is converted to Alternating Current (AC) via the PCS to supplement the power supply, thereby reducing reliance on the external grid.

4. Job Relocation (K8s/Slurm)

Adjusting the scheduling of IT tasks based on power availability.

  • Scheduler Decision Engine: Activated when a peak time is detected or when ESS battery levels are low.
  • Job Control: Lower priority jobs are queued or paused, and compute speeds are throttled (power suppressed) to minimize consumption.

5. Parameter & Model Optimization

The most advanced stage, where the efficiency of the AI models themselves is optimized.

  • Real-time Batch Size Adjustment: Controlling throughput to prevent sudden power spikes.
  • Large Model -> sLLM (Lightweight): Transitioning to smaller, lightweight Large Language Models (sLLM) to reduce GPU power consumption without service downtime.

Summary

The core message of this diagram is that High-Quality/High-Resolution Data is the foundation for effective power management. By combining hardware solutions (ESS/PCS), software scheduling (K8s/Slurm), and AI model optimization (sLLM), a data center can significantly reduce operating expenses (OPEX) and ultimately increase profitability (Make money) through intelligent peak shaving.


#AI_DC #PowerControl #DataCenter #EnergyEfficiency #PeakShaving #GreenIT #MachineLearning #ESS #AIInfrastructure #GPUOptimization #Sustainability #TechInnovation

Next AI Computing


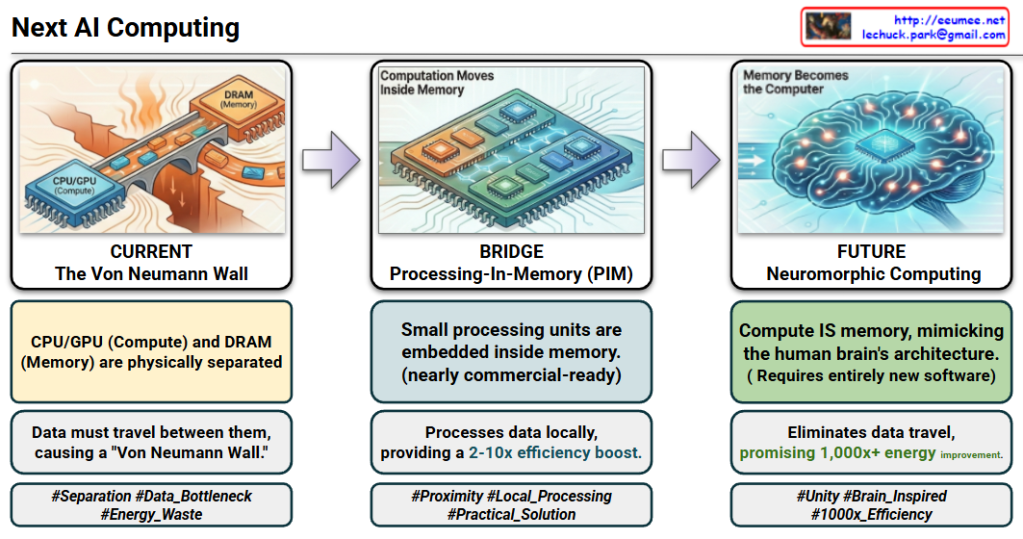
The Evolution of AI Computing

The provided images illustrate the architectural shift in AI computing from the traditional “Separation” model to a “Unified” brain-inspired model, focusing on overcoming energy inefficiency and data bottlenecks.

1. CURRENT: The Von Neumann Wall (Separation)

  • Status: The industry standard today.
  • Structure: Computation (CPU/GPU) and Memory (DRAM) are physically separate.
  • Problem: Constant data movement between components creates a “Von Neumann Wall” (bottleneck).
  • Efficiency: Extremely wasteful; 60-80% of energy is consumed just moving data, not processing it.

2. BRIDGE: Processing-In-Memory (PIM) (Proximity)

  • Status: Practical, near-term solution; nearly commercial-ready.
  • Structure: Small processing units are embedded inside the memory.
  • Benefit: Processes data locally to provide a 2-10x efficiency boost.
  • Primary Use: Ideal for accelerating Large Language Models (LLMs).

3. FUTURE: Neuromorphic Computing (Unity)

  • Status: Future-oriented paradigm shift.
  • Structure: Compute IS memory, mimicking the human brain’s architecture where memory elements perform calculations.
  • Benefit: Eliminates data travel entirely, promising a massive 1,000x+ energy improvement.
  • Requirement: Requires a complete overhaul of current software stacks.
  • Primary Use: Ultra-low power Edge devices and Robotics.

#AIComputing #NextGenAI #VonNeumannWall #PIM #ProcessingInMemory #NeuromorphicComputing #EnergyEfficiency #LLM #EdgeAI #Semiconductor #FutureTech #ComputerArchitecture

With Gemini

Redfish for AI DC

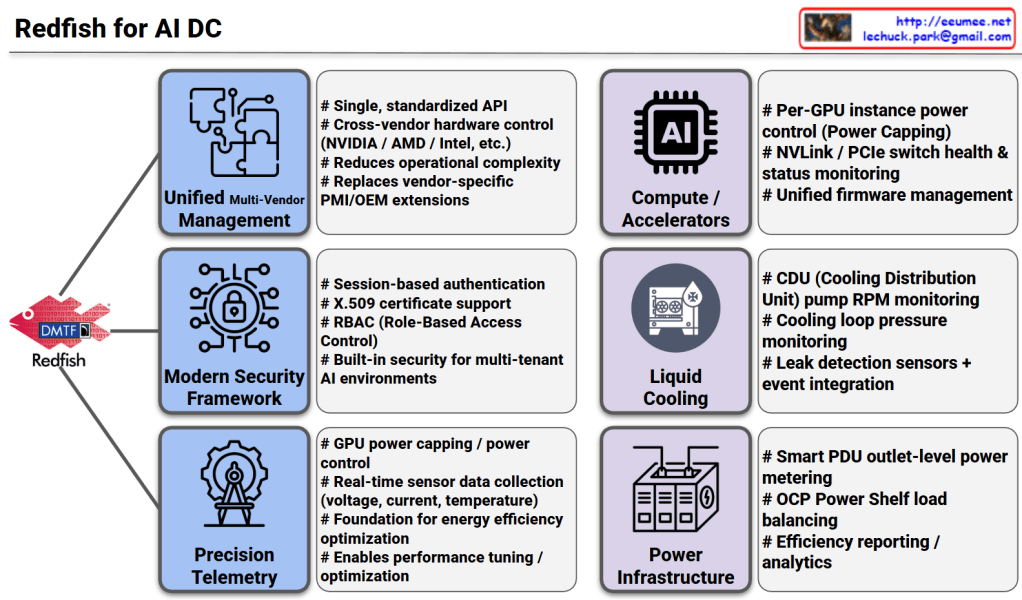
This image illustrates the pivotal role of the Redfish API (developed by DMTF) as the standardized management backbone for modern AI Data Centers (AI DC). As AI workloads demand unprecedented levels of power and cooling, Redfish moves beyond traditional server management to provide a unified framework for the entire infrastructure stack.


1. Management & Security Framework (Left Column)

  • Unified Multi-Vendor Management:
    • Acts as a single, standardized API to manage diverse hardware from different vendors (NVIDIA, AMD, Intel, etc.).
    • It reduces operational complexity by replacing fragmented, vendor-specific IPMI or OEM extensions with a consistent interface.
  • Modern Security Framework:
    • Designed for multi-tenant AI environments where security is paramount.
    • Supports robust protocols like session-based authentication, X.509 certificates, and RBAC (Role-Based Access Control) to ensure only authorized entities can modify critical infrastructure.
  • Precision Telemetry:
    • Provides high-granularity, real-time data collection for voltage, current, and temperature.
    • This serves as the foundation for energy efficiency optimization and fine-tuning performance based on real-time hardware health.

2. Infrastructure & Hardware Control (Right Column)

  • Compute / Accelerators:
    • Enables per-GPU instance power capping, allowing operators to limit power consumption at a granular level.
    • Monitors the health of high-speed interconnects like NVLink and PCIe switches, and simplifies firmware lifecycle management across the cluster.
  • Liquid Cooling:
    • As AI chips run hotter, Redfish integrates with CDU (Cooling Distribution Unit) systems to monitor pump RPM and loop pressure.
    • It includes critical safety features like leak detection sensors and integrated event handling to prevent hardware damage.
  • Power Infrastructure:
    • Extends management to the rack level, including Smart PDU outlet metering and OCP (Open Compute Project) Power Shelf load balancing.
    • Facilitates advanced efficiency analytics to drive down PUE (Power Usage Effectiveness).

Summary

For an AI DC Optimization Architect, Redfish is the essential “language” that enables Software-Defined Infrastructure. By moving away from manual, siloed hardware management and toward this API-driven approach, data centers can achieve the extreme automation required to shift OPEX structures predominantly toward electricity costs rather than labor.

#AIDataCenter #RedfishAPI #DMTF #DataCenterInfrastructure #GPUComputing #LiquidCooling #SustainableIT #SmartPDU #OCP #InfrastructureAutomation #TechArchitecture #EnergyEfficiency


With Gemini

“End-to-End AI Factory Optimization: From Infrastructure to SLA


End-to-End AI Factory Optimization: Bridging Infrastructure and Business Value

This diagram outlines a comprehensive framework for optimizing an “AI Factory”—a modern data center dedicated to AI workloads. The core message is that optimizing AI performance and cost requires a holistic view that connects physical infrastructure realities directly to high-level business Service Level Agreements (SLAs).

Here is a breakdown of the three main pillars of this framework:

1. The AI Factory (Infrastructure Foundation)

On the far left, we see the AI Factory itself. This represents the converged physical infrastructure required to run massive AI models (indicated by the neural network icons).

It emphasizes that the critical hardware components—GPUs (Compute), Networking, Power, and Cooling—cannot be managed in silos. They are marked as “ULTRA CONNECTED,” meaning the behavior of one directly impacts the others (e.g., intense GPU activity spikes power demand and generates immediate heat, requiring instant cooling response).

2. Ultra Data Quality (The Intelligence Layer)

In the center, the diagram highlights the necessity of Ultra Data Quality. To optimize such a complex, interconnected system, standard logging isn’t enough. The telemetry data collected from the infrastructure must meet three critical criteria:

  • Ultra Precision & Resolution: Capturing minute details of operations.
  • Ultra Time-Sync: The ability to perfectly synchronize timestamps across different hardware types (e.g., nanosecond-level GPU events vs. millisecond-level cooling events) to understand cause-and-effect relationships accurately.

3. Cost & SLA vs. Usage+Performance (The Value Realization)

The right section is the most critical, showing the direct mapping between physical operational metrics (Usage+Performance) and business outcomes (Cost & SLA). It argues that physical stability directly dictates business success:

  • TOKEN (Output/Revenue) ↔ Clock Consistency: To maintain a steady stream of AI output (tokens), the GPU clock speeds must remain consistent and stable without fluctuating.
  • FLOPS (Peak Compute Power) ↔ Zero Throttling Events: Achieving maximum floating-point operations per second requires eliminating “throttling”—performance downgrades caused by overheating or power constraints.
  • Watt (Operational Cost) ↔ Power Draw vs TDP: Managing operational expenses (electricity bills) requires optimizing the actual power draw relative to the hardware’s Thermal Design Power (TDP) limits.
  • PUE (Data Center Efficiency) ↔ Thermal Headroom: The overall Power Usage Effectiveness of the facility depends on optimizing “thermal headroom”—managing how close the cooling systems run to their limits without wasting energy.

This diagram illustrates that optimizing an AI business isn’t just about better code or faster chips; it requires an end-to-end approach where the physical realities of power, cooling, and hardware are tightly integrated with data analytics to ensure performance promises (SLAs) are met cost-effectively.


#AIFactory #DataCenterOptimization #AIInfrastructure #GPUComputing #SLAmanagement #EnergyEfficiency #PUE #Operations #TechInnovation #ArtificialIntelligence

Flight LLM ( by FPGA )

Flight LLM (FPGA) Analysis

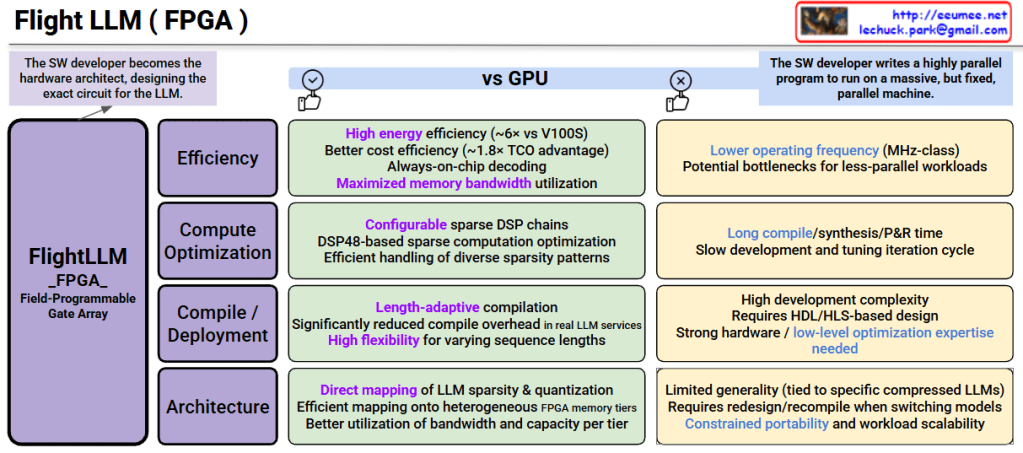
This image is a technical document comparing “FlightLLM,” an FPGA-based LLM (Large Language Model) accelerator, with GPUs.

FlightLLM_FPGA Characteristics

Core Concept: An LLM inference accelerator utilizing Field-Programmable Gate Array, where SW developers become hardware architects, designing the exact circuit for the LLM.

Advantages vs Disadvantages Compared to GPU

✓ FPGA Advantages (Green Boxes)

1. Efficiency

  • High energy efficiency (~6x vs V100S)
  • Better cost efficiency (~1.8x TCO advantage)
  • Always-on-chip decoding
  • Maximized memory bandwidth utilization

2. Compute Optimization

  • Configurable sparse DSP(Digital Signal Processor) chains
  • DSP48-based sparse computation optimization
  • Efficient handling of diverse sparsity patterns

3. Compile/Deployment

  • Length-adaptive compilation
  • Significantly reduced compile overhead in real LLM services
  • High flexibility for varying sequence lengths

4. Architecture

  • Direct mapping of LLM sparsity & quantization
  • Efficient mapping onto heterogeneous FPGA memory tiers
  • Better utilization of bandwidth and capacity per tier

✗ FPGA Disadvantages (Orange Boxes)

1. Operating Frequency

  • Lower operating frequency (MHz-class)
  • Potential bottlenecks for less-parallel workloads

2. Development Time

  • Long compile/synthesis/P&R time
  • Slow development and iteration cycle

3. Development Complexity

  • High development complexity
  • Requires HDL/HLS-based design
  • Strong hardware/low-level optimization expertise needed

4. Portability Constraints

  • Limited generality (tied to specific compressed LLMs)
  • Requires redesign/recompile when switching models
  • Constrained portability and workload scalability

Key Trade-offs Summary

FPGAs offer superior energy and cost efficiency for specific LLM workloads but require significantly higher development expertise and have lower flexibility compared to GPUs. They excel in massive, fixed parallel workloads but struggle with rapid model iteration and portability.


FlightLLM leverages FPGAs to achieve 6x energy efficiency and 1.8x cost advantage over GPUs through direct hardware mapping of LLM operations. However, this comes at the cost of high development complexity, requiring HDL/HLS expertise and long compilation times. FPGAs are ideal for production deployments of specific LLM models where efficiency outweighs the need for flexibility and rapid iteration.

#FPGA #LLM #AIAccelerator #FlightLLM #HardwareOptimization #EnergyEfficiency #MLInference #CustomHardware #AIChips #DeepLearningHardware

With Claude

Big Changes with AI

This image illustrates the dramatic growth in computing performance and data throughput from the Internet era to the AI/LLM era.

Key Development Stages

1. Internet Era

  • 10 TWh (terawatt-hours) power consumption
  • 2 PB/day (petabytes/day) data processing
  • 1K DC (1,000 data centers)
  • PUE 3.0 (Power Usage Effectiveness)

2. Mobile & Cloud Era

  • 200 TWh (20x increase)
  • 20,000 PB/day (10,000x increase)
  • 4K DC (4x increase)
  • PUE 1.8 (improved efficiency)

3. AI/LLM (Transformer) Era – “Now Here?” point

  • 400+ TWh (40x additional increase)
  • 1,000,000,000 PB/day = 1 billion PB/day (500,000x increase)
  • 12K DC (12x increase)
  • PUE 1.4 (further improved efficiency)

Summary

The chart demonstrates unprecedented exponential growth in data processing and power consumption driven by AI and Large Language Models. While data center efficiency (PUE) has improved significantly, the sheer scale of computational demands has skyrocketed. This visualization emphasizes the massive infrastructure requirements that modern AI systems necessitate.

#AI #LLM #DataCenter #CloudComputing #MachineLearning #ArtificialIntelligence #BigData #Transformer #DeepLearning #AIInfrastructure #TechTrends #DigitalTransformation #ComputingPower #DataProcessing #EnergyEfficiency