AI optimization

AI Optimization Diagram Interpretation

The provided diagram, titled “AI Optimization,” illustrates the process of AI learning and inference in relation to data flow, along with the physical hardware infrastructure optimization (power and thermal management) required to sustain it. It goes beyond simple software algorithms to provide architectural insights into AI infrastructure and system design.

1. Data Acquisition and Preprocessing (Left Section)

  • Infinite World Data (Green Arrow): Represents the vast, unstructured, and infinite source data existing in the real world.
  • For All World Data & RAM: Shows the process of loading this infinite real-world data into RAM (a finite computing resource) so that the AI can process it. This represents the beginning of the data pipeline, where massive amounts of data are ingested, compressed, and refined for the system.

2. AI Computation & Infrastructure Optimization (Center Section)

This is the core of the diagram, showing how software-driven data optimization and hardware-driven power/cooling optimization intersect around the central AI processor (such as a GPU or NPU).

  • Algorithm & Model Optimization (Horizontal Flow):
    • Learning: The process where the AI trains on and optimizes data based on human-built statistical frameworks (Human Statistics).
    • Inference: The process of executing the trained model to run computations on new inputs and derive actionable results.
  • Physical Infrastructure Optimization (Vertical Flow): Represents the data center-level physical management required to sustain high-performance AI workloads.
    • Fit Optimization For Computing (Top): The lightning bolt icon signifies the optimization of high-density power supply systems and computing efficiency necessary for heavy AI workloads.
    • Fit Optimization For Heat (Bottom): The snowflake and circulation icon represents thermal management and cooling system optimization (such as liquid immersion cooling or advanced HVAC) to control the massive heat generated by the chips during intense computation.

3. Generation of Meaningful Information (Right Section)

  • For All Human Data & RAM: Shows the final output derived from the AI’s inference process being loaded back into the memory (RAM).
  • Unlike the large, single bar of raw source data on the left, the data on the right is fragmented into multiple smaller blocks. This symbolizes that massive, unrefined data has been successfully processed by the AI into structured, meaningful, and digestible information that humans can immediately consume and utilize for specific purposes.

Summary

This diagram emphasizes that AI value creation is not merely a software algorithm that takes data in and spits results out. It conveys a system engineering philosophy: true AI Optimization can only be achieved when software models are perfectly synchronized with the physical architecture—specifically high-density power delivery (Computing) and efficient thermal management (Heat)—that supports the hardware at its core.

#AIOptimization #AIInfrastructure #SystemArchitecture #MachineLearning #DeepLearning #DataPipeline #DataCenter #ThermalManagement #ComputingPower #ArtificialIntelligence #TechInference #BigData

Big Changes with AI

This image illustrates the dramatic growth in computing performance and data throughput from the Internet era to the AI/LLM era.

Key Development Stages

1. Internet Era

  • 10 TWh (terawatt-hours) power consumption
  • 2 PB/day (petabytes/day) data processing
  • 1K DC (1,000 data centers)
  • PUE 3.0 (Power Usage Effectiveness)

2. Mobile & Cloud Era

  • 200 TWh (20x increase)
  • 20,000 PB/day (10,000x increase)
  • 4K DC (4x increase)
  • PUE 1.8 (improved efficiency)

3. AI/LLM (Transformer) Era – “Now Here?” point

  • 400+ TWh (40x additional increase)
  • 1,000,000,000 PB/day = 1 billion PB/day (500,000x increase)
  • 12K DC (12x increase)
  • PUE 1.4 (further improved efficiency)

Summary

The chart demonstrates unprecedented exponential growth in data processing and power consumption driven by AI and Large Language Models. While data center efficiency (PUE) has improved significantly, the sheer scale of computational demands has skyrocketed. This visualization emphasizes the massive infrastructure requirements that modern AI systems necessitate.

#AI #LLM #DataCenter #CloudComputing #MachineLearning #ArtificialIntelligence #BigData #Transformer #DeepLearning #AIInfrastructure #TechTrends #DigitalTransformation #ComputingPower #DataProcessing #EnergyEfficiency

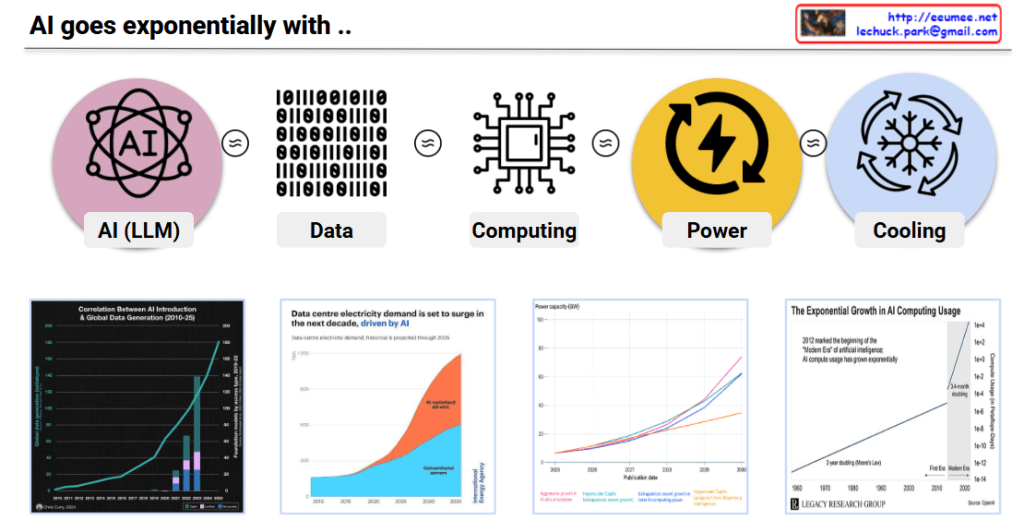
AI goes exponentially with ..

This infographic illustrates how AI’s exponential growth triggers a cascading exponential expansion across all interconnected domains.

Core Concept: Exponential Chain Reaction

Top Process Chain: AI’s exponential growth creates proportionally exponential demands at each stage:

  • AI (LLM)DataComputingPowerCooling

The “≈” symbol indicates that each element grows exponentially in proportion to the others. When AI doubles, the required data, computing, power, and cooling all scale proportionally.

Evidence of Exponential Growth Across Domains

1. AI Networking & Global Data Generation (Top Left)

  • Exponential increase beginning in the 2010s
  • Vertical surge post-2020

2. Data Center Electricity Demand (Center Left)

  • Sharp increase projected between 2026-2030
  • Orange (AI workloads) overwhelms blue (traditional workloads)
  • AI is the primary driver of total power demand growth

3. Power Production Capacity (Center Right)

  • 2005-2030 trends across various energy sources
  • Power generation must scale alongside AI demand

4. AI Computing Usage (Right)

  • Most dramatic exponential growth
  • Modern AI era begins in 2012
  • Doubling every 6 months (extremely rapid exponential growth)
  • Over 300,000x increase since 2012
  • Three exponential growth phases shown (1e+0, 1e+2, 1e+4, 1e+6)

Key Message

This infographic demonstrates that AI development is not an isolated phenomenon but triggers exponential evolution across the entire ecosystem:

  • As AI models advance → Data requirements grow exponentially
  • As data increases → Computing power needs scale exponentially
  • As computing expands → Power consumption rises exponentially
  • As power consumption grows → Cooling systems must expand exponentially

All elements are tightly interconnected, creating a ‘cascading exponential effect’ where exponential growth in one domain simultaneously triggers exponential development and demand across all other domains.


#ArtificialIntelligence #ExponentialGrowth #AIInfrastructure #DataCenters #ComputingPower #EnergyDemand #TechScaling #AIRevolution #DigitalTransformation #Sustainability #TechInfrastructure #MachineLearning #LLM #DataScience #FutureOfAI #TechTrends #TechnologyEvolution

With Claude