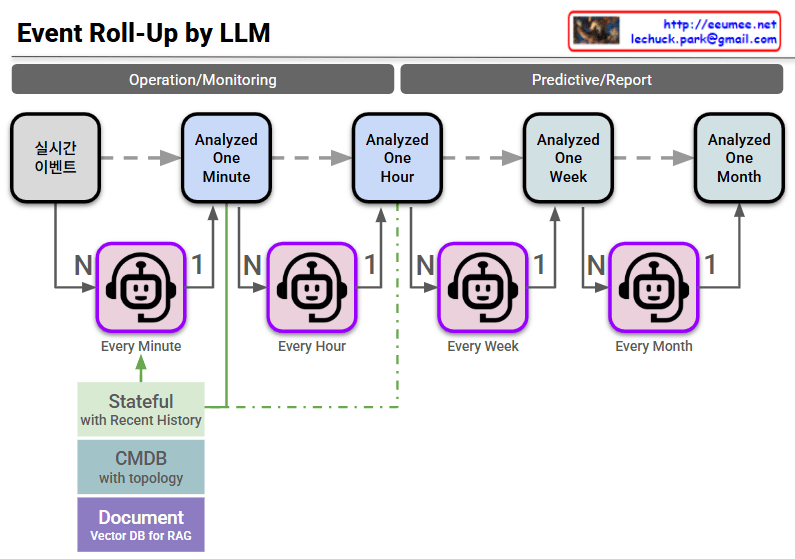
The provided image illustrates an AIOps-based event pipeline architecture. It demonstrates how Large Language Models (LLMs) hierarchically roll up and analyze the flood of real-time events occurring within a data center or large-scale IT infrastructure over time.
The core objective here is to compress countless simple alarms into meaningful insights, drastically reducing alert fatigue and minimizing Mean Time To Repair (MTTR). The architecture can be broken down into three main areas:
1. Separation by Purpose (Top Banner)
- Operation/Monitoring: Encompasses the 1-minute and 1-hour analysis cycles. This zone is dedicated to immediate anomaly detection and real-time incident response.
- Predictive/Report: Encompasses the 1-week and 1-month analysis cycles. By leveraging accumulated data, this zone focuses on identifying long-term failure trends, assisting with infrastructure capacity planning, and automatically generating weekly or monthly operational reports.
2. N:1 Hierarchical Roll-Up Mechanism (Center Pipeline)
The robot icons (LLM Agents) deployed at each time interval act as summarization engines, merging data from the lower tier and passing it up the chain.
- Every Minute: The agent collects numerous real-time events (N) and compresses them into a summarized, 1-minute contextual block (1).
- Every Hour / Week / Month: The agents aggregate multiple analytical outputs (N) from the preceding stage into a single, comprehensive analysis for the larger time window (1).
- Through this mechanism, granular noise is progressively filtered out over time, leaving only the macroscopic health status and the most critical issues of the entire infrastructure.
3. Context & Knowledge Injection (Bottom Left)
For an LLM to go beyond simple text summarization and accurately assess the actual state of the infrastructure, it requires grounding. These elements provide that crucial context and are heavily injected during the initial (1-minute) analysis phase.
- Stateful (with Recent History): Instead of treating events as isolated incidents, the system remembers recent context to track the continuity and transitions of system states.
- CMDB (with topology): By integrating with the Configuration Management Database, the system understands the physical and logical relationships (e.g., power dependencies, network paths) between the alerting equipment and the rest of the infrastructure.
- Document (Vector DB for RAG): This is a vectorized repository of operational manuals, past incident resolutions, and Standard Operating Procedures (SOPs). Utilizing Retrieval-Augmented Generation (RAG), it feeds specific domain knowledge to the LLM, enabling it to diagnose root causes and recommend highly accurate remediation steps.
In Summary:
This architecture represents a significant leap from traditional rule-based monitoring. It is a highly systematic blueprint designed to intelligently interpret real-time events by powering LLM agents with RAG and CMDB topology context. Ultimately, it paves the way for reducing manual operator intervention and achieving truly autonomous and proactive infrastructure management.
#AIOps #LLM #AgenticAI #RAG #EventRollUp #ITInfrastructure #AutonomousOperations #MTTR #Observability #TechArchitecture

