Data for DC

1. The Three Core Data Types (Top Section)

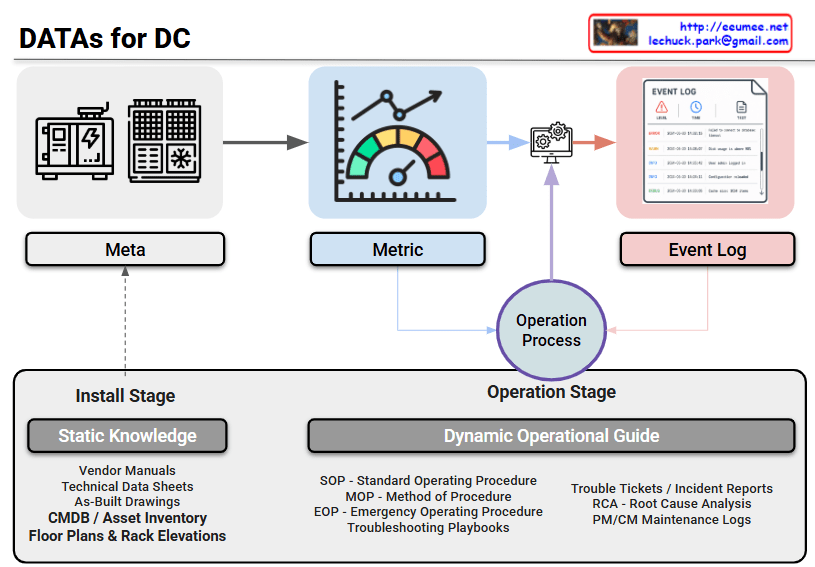
At the top, the diagram maps out the primary real-time and structural data inputs flowing from the infrastructure:

  • Meta: This represents the foundational metadata of the facility—the physical and logical configuration of equipment like generators, server racks, and liquid cooling units. It acts as the anchor point for the entire monitoring ecosystem.
  • Metric: Illustrated by the gauge, this is the continuous, time-series telemetry data. It includes critical real-time performance indicators, such as power loads, latency, or the return temperature from cooling units.
  • Event Log: The document icon on the right captures asynchronous system logs, alerts, and warnings (e.g., error thresholds being breached or state changes).

2. The Knowledge Base / RAG Corpus (Bottom Section)

The bottom half categorizes the facility’s documentation across its lifecycle. This perfectly outlines the corpus structure required to feed an AI’s Retrieval-Augmented Generation (RAG) system:

  • Install Stage (Static Knowledge): This is the baseline documentation established during construction and deployment. It includes Vendor Manuals, Technical Data Sheets, As-Built Drawings, CMDB, and Rack Elevations. Notice the dotted arrow showing how this static knowledge directly informs and establishes the “Meta” data above.
  • Operation Stage (Dynamic Operational Guide): This represents the evolving, lived intelligence of the facility. It captures structured response frameworks (SOP, MOP, EOP) alongside historical operational data like Trouble Tickets, RCA (Root Cause Analysis), and Maintenance Logs.

3. The Operation Process (Center)

The purple “Operation Process” node acts as the cognitive center or the execution engine. Real-time anomalies detected via Metrics and Event Logs flow into this process. The system then queries the Dynamic Operational Guide to find the correct standard operating procedures or historical RCA to resolve the issue. The resulting action or insight is then fed back into the central monitoring and management system.


Summary

This diagram elegantly maps out the data architecture of a modern facility. It visualizes how static foundational knowledge and dynamic operational history combine to inform real-time monitoring and incident response. By categorizing data into Meta, Metric, Event Logs, and structural lifecycle knowledge, it provides a clear, actionable framework for implementing data-driven operations, high-resolution observability, and AI-assisted automation platforms.

#DataCenterArchitecture #AIOps #RAG #InfrastructureObservability #SystemTelemetry #RootCauseAnalysis #TechInfographic

With Gemini

Harness Engineering


The Evolution of LLM Utilization: Toward Autonomous Agents

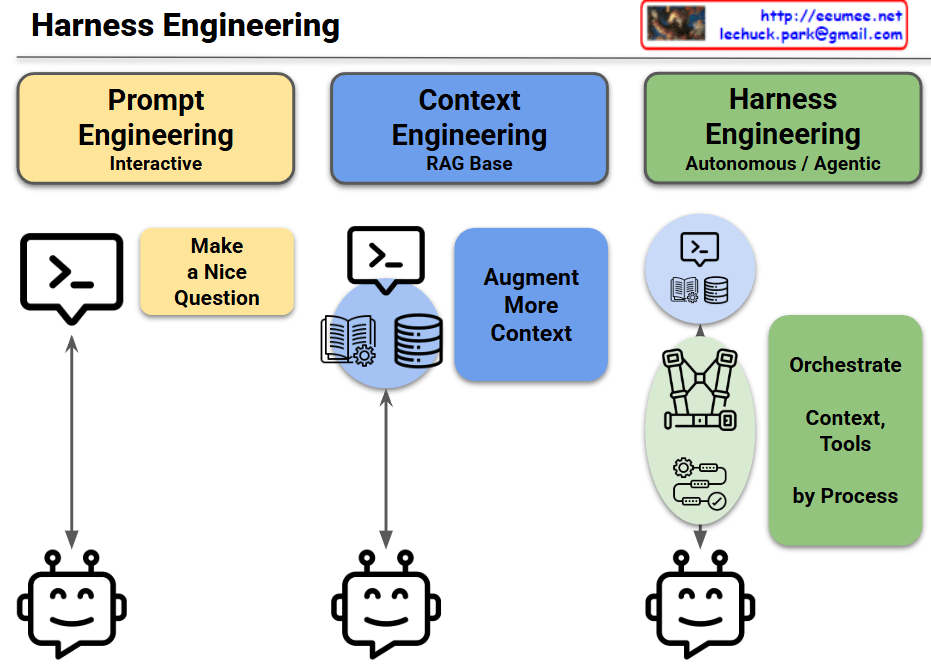
This slide illustrates the evolutionary roadmap of adopting Large Language Models (LLMs) within enterprise operations, transitioning from basic user inputs to fully automated, agentic workflows. The architecture is broken down into three distinct phases:

  • Phase 1: Prompt Engineering (Interactive)This represents the foundational stage of LLM interaction. At this level, the quality of the output depends entirely on human input—the ability to “Make a Nice Question.” It is a strictly interactive, 1:1 process that relies solely on the model’s pre-trained knowledge, which limits its capability to resolve complex, real-time operational issues.
  • Phase 2: Context Engineering (RAG Base)The second stage addresses the limitations of a standalone LLM by injecting trusted external data. Utilizing a Retrieval-Augmented Generation (RAG) base, the system actively retrieves specific domain knowledge—represented by the manual and database icons—to “Augment More Context.” This grounds the AI in reality, significantly reducing hallucinations and providing highly accurate, domain-specific insights.
  • Phase 3: Harness Engineering (Autonomous / Agentic)This is the ultimate target state. Moving beyond simply generating text, the AI evolves into a proactive agent. The “harness” icon symbolizes a secure, controlled framework where the AI can independently “Orchestrate Context, Tools by Process.” In this autonomous phase, the system not only understands the problem but also safely executes predefined workflows and controls physical or software tools to resolve issues with minimal human intervention.

#LLM #AIArchitecture #AIOps #AutonomousAgents #RAG #ContextEngineering #HarnessEngineering #AgenticAI #ITOperations #TechLeadership

With Gemini

Autonomous Facility Operation Optimization Pipeline


Autonomous Facility Operation Optimization Pipeline

This pipeline represents a sophisticated 5-stage workflow designed to transition facility management from manual oversight to full AI-driven autonomy, ensuring reliability through hybrid modeling.

1. Integrated Data Ingestion & Preprocessing

  • Role: Consolidates diverse data streams into a synchronized, high-fidelity format by eliminating noise.
  • Key Components: Sensor time-series data, DCIM integration, Event log parsing, Outlier filtering, and TSDB (Time Series Database).

2. Hybrid Analysis Engine

  • Role: Eliminates analytical blind spots by running physical laws, machine learning predictions, and expert knowledge in parallel.
  • Key Components: Physics-Informed Machine Learning (PIML), Anomaly Detection, RUL (Remaining Useful Life) Prediction, and RAG-enhanced Ground Truth analysis.

3. Decision Fusion & Prescription

  • Role: Synthesizes multi-track analysis to move beyond simple alerts, generating specific, actionable “prescriptions.”
  • Key Components: Decision Fusion, Prescriptive Action, LLM-based Prescription, and Priority Scoring to rank urgency.

4. Operation Application & Feedback Loop

  • Role: Establishes a closed-loop system that measures success rates post-execution to continuously refine models.
  • Key Components: Success Rate Tracking, RCA (Root Cause Analysis), Model Retraining, and Physics/Rule updates based on real-world performance.

5. Phased Control Automation

  • Role: A risk-mitigated transition of control authority from humans to AI based on accumulated performance data.
  • Automation Levels:
    • L1. Assistant Mode: System provides guides only; 100% human execution.
    • L2. Semi-Autonomous: System prepares optimized values; human provides final approval.
    • L3. Fully Autonomous: System operates without human intervention (triggered when success rate >90%).

Strategic Insight

The hallmark of this architecture is the integration of Physics-Informed ML and LLM-based reasoning. By combining the rigid reliability of physical laws with the adaptive reasoning of Large Language Models, the pipeline solves the “black box” problem of traditional AI, making it suitable for mission-critical infrastructures like AI Data Centers.

#DataCenter #AIOps #AutonomousInfrastructure #PhysicsInformedML #DigitalTwin #LLM #PredictiveMaintenance #DataCenterOptimization #TechVisualization #SmartFacility #EngineeringExcellence

Event Roll-Up by LLM

The provided image illustrates an AIOps-based event pipeline architecture. It demonstrates how Large Language Models (LLMs) hierarchically roll up and analyze the flood of real-time events occurring within a data center or large-scale IT infrastructure over time.

The core objective here is to compress countless simple alarms into meaningful insights, drastically reducing alert fatigue and minimizing Mean Time To Repair (MTTR). The architecture can be broken down into three main areas:

1. Separation by Purpose (Top Banner)

  • Operation/Monitoring: Encompasses the 1-minute and 1-hour analysis cycles. This zone is dedicated to immediate anomaly detection and real-time incident response.
  • Predictive/Report: Encompasses the 1-week and 1-month analysis cycles. By leveraging accumulated data, this zone focuses on identifying long-term failure trends, assisting with infrastructure capacity planning, and automatically generating weekly or monthly operational reports.

2. N:1 Hierarchical Roll-Up Mechanism (Center Pipeline)

The robot icons (LLM Agents) deployed at each time interval act as summarization engines, merging data from the lower tier and passing it up the chain.

  • Every Minute: The agent collects numerous real-time events (N) and compresses them into a summarized, 1-minute contextual block (1).
  • Every Hour / Week / Month: The agents aggregate multiple analytical outputs (N) from the preceding stage into a single, comprehensive analysis for the larger time window (1).
  • Through this mechanism, granular noise is progressively filtered out over time, leaving only the macroscopic health status and the most critical issues of the entire infrastructure.

3. Context & Knowledge Injection (Bottom Left)

For an LLM to go beyond simple text summarization and accurately assess the actual state of the infrastructure, it requires grounding. These elements provide that crucial context and are heavily injected during the initial (1-minute) analysis phase.

  • Stateful (with Recent History): Instead of treating events as isolated incidents, the system remembers recent context to track the continuity and transitions of system states.
  • CMDB (with topology): By integrating with the Configuration Management Database, the system understands the physical and logical relationships (e.g., power dependencies, network paths) between the alerting equipment and the rest of the infrastructure.
  • Document (Vector DB for RAG): This is a vectorized repository of operational manuals, past incident resolutions, and Standard Operating Procedures (SOPs). Utilizing Retrieval-Augmented Generation (RAG), it feeds specific domain knowledge to the LLM, enabling it to diagnose root causes and recommend highly accurate remediation steps.

In Summary:

This architecture represents a significant leap from traditional rule-based monitoring. It is a highly systematic blueprint designed to intelligently interpret real-time events by powering LLM agents with RAG and CMDB topology context. Ultimately, it paves the way for reducing manual operator intervention and achieving truly autonomous and proactive infrastructure management.


#AIOps #LLM #AgenticAI #RAG #EventRollUp #ITInfrastructure #AutonomousOperations #MTTR #Observability #TechArchitecture

Hybrid Analysis for Autonomous Operation (2)

Framework Overview

The image illustrates a “Hybrid Analysis” framework designed to achieve true Autonomous Operation. It outlines five core pillars required to build a reliable, self-driving system for high-stakes environments like AI data centers or power plants. The architecture combines three analytical foundations (purple) with two execution and safety layers (teal).


1. The Analytical Foundation (The Hybrid Triad)

This section forms the “brain” of the autonomous system, blending human expertise, artificial intelligence, and absolute scientific laws.

  • Domain Knowledge (Human Experience):
    • Core: Systematized heuristics, decades of operator know-how, and maintenance manuals.
    • Role: Provides qualitative analysis, establishes preventive maintenance baselines, and handles unstructured exceptions that algorithms might miss.
  • Data-driven ML (Artificial Intelligence):
    • Core: Pattern recognition, anomaly detection, and Predictive Maintenance (PdM).
    • Role: Analyzes massive volumes of multi-dimensional sensor and operational data to find hidden correlations and risks that are imperceptible to human operators.
  • Physics Rule (Engineering Guardrails):
    • Core: Thermodynamic constraints, equations of state, fluid dynamics, and absolute power limits.
    • Role: Acts as the ultimate boundary. It ensures that the operational commands generated by ML models are physically possible and safe, preventing the AI from violating unchanging engineering laws.

2. Execution and Safety Nets

This section translates the insights from the analytical triad into real-world, physical changes while guaranteeing system stability.

  • Control & Actuation (The Hands):
    • Core: IT/OT (Information Technology / Operational Technology) convergence and real-time bi-directional communication.
    • Role: The domain of injecting the optimized setpoints and guidelines directly into the facility’s PLC (Programmable Logic Controller) or DCS (Distributed Control System) to drive physical actuators.
  • Reliability & Governance (The Shield):
    • Core: Data/Model monitoring, Disaster Recovery (DR), and Cyber-Physical Security (CPS).
    • Role: The overarching safety net and pipeline management required to ensure the autonomous operating system runs securely and continuously, 24/7, without interruption.

💡 Key Takeaway

As emphasized by the red text at the bottom, this multi-layered approach is highly critical in environments like data centers or power plants. Relying solely on data-driven ML is too risky for high-density infrastructure; true autonomous stability is only achieved when AI is anchored by human domain expertise and strict physical laws.

#AutonomousOperations #AIOps #HybridAnalysis #PredictiveMaintenance #ITOTConvergence #CyberPhysicalSystems #MissionCritical #TechVisualization #EngineeringInfographic

With Gemini

Network Monitoring For Facilities

The provided image is a conceptual diagram illustrating how to monitor the status and detect anomalies in critical industrial facility infrastructure (such as power and cooling) through network traffic patterns. I also noticed the author’s information (Lechuck) in the top right corner! Let’s break down the main data flow and core ideas of your diagram step-by-step.

1. Realtime Facility Metrics

  • Target: Physical facility equipment such as generators (power infrastructure) and HVAC/cooling units.
  • Collection Method: A central monitoring server primarily uses a Polling method, requesting and receiving status data from the equipment based on a fixed sampling rate.
  • Characteristics: Because a specific amount of data is exchanged at designated times, the variability in data volume during normal operation is relatively low.

2. Traffic Metrics (Inferring Status via Traffic Characteristics)

This section contains the core insight of the diagram. Beyond just analyzing the payload of the collected sensor data, the pattern of the network traffic itself is utilized as an indicator of the facility’s health.

  • Normal State (It’s normal): When the equipment is operating normally, the network traffic occurs in a very stable and consistent manner in sync with the polling cycle.
  • Detecting Traffic Changes ((!) Changes): If a change occurs in this expected stable traffic pattern (e.g., traffic spikes, response delays, or disconnections), it is flagged as an anomaly in the facility.
  • Status Classification: Based on these abnormal traffic patterns, the system can infer whether the equipment is operating abnormally (Facility Anomaly Working) or has completely stopped functioning (Facility Not Working).

3. Facility Monitoring & Data Analysis

  • This architecture combines standard dashboard monitoring with Traffic Metrics extracted from network switches, feeding them into the data analysis system.
  • This cross-validation approach is highly effective for distinguishing between actual sensor data errors and network segment failures. As highlighted in the diagram, this ultimately improves the overall reliability of the facility monitoring system (Very Helpful !!!).

💡 Summary

This architecture presents a highly intuitive and efficient approach to data center and facility operations. By leveraging the network engineering characteristic that facility equipment communicates in regular patterns, it demonstrates an excellent monitoring logic. It allows operators to perform initial fault detection almost immediately simply by observing “changes in the consistency of network traffic,” even before conducting complex sensor data analysis.

#NetworkMonitoring #DataCenterOperations #FacilityManagement #TrafficAnalysis #AnomalyDetection #NetworkEngineering #ITInfrastructure #AIOps #SmartFacilities

With Gemini

The Architecture for AI-Driven Autonomous

This slide effectively illustrates a complete, four-tier architecture required to build a fully autonomous AI system. Let’s walk through the framework from the foundation (data collection) to the top (autonomous execution):

  • L1. Ultra-Precision Sensor Layer (The “Sensory Organ”)This foundational layer is all about high-resolution data capture. Acting as the system’s highly sensitive sensory organs, it meticulously monitors minute physical changes—such as heat, flow, and pressure—right down to the individual chipset level.
  • L2. AI-Ready Data Lake (The “Central Library”)Once the data is captured, it flows into this layer to be consolidated. It breaks down data silos by collecting scattered facility data into one centralized library. It then automatically catalogs this information so that the AI can instantly access, read, and learn from it.
  • L3. Pluggable AI Analysis Layer (The “Brain”)This is where the cognitive processing happens. Acting as the brain of the system, it analyzes the organized data to find optimal solutions. Its “pluggable” nature means you can dynamically swap in the best AI algorithms—like Deep Learning or Reinforcement Learning—just like snapping Lego blocks together to fit the specific situation.
  • L4. Autonomous Control Loop (The “Executive Branch”)Finally, the insights from the brain are turned into action here. This layer operates in real-time (down to the millisecond) to send control signals back to the system. It executes decisions entirely on its own, achieving true autonomous operation with zero human intervention.

Summary

This architecture demonstrates a seamless, end-to-end operational flow: it starts by sensing microscopic hardware changes (L1), structures that raw data for immediate AI consumption (L2), applies dynamic and flexible algorithms to make smart decisions (L3), and ultimately executes those decisions autonomously in real-time (L4). It is a perfect blueprint for achieving a fully uncrewed, intelligent infrastructure.

#AIArchitecture #AutonomousSystems #EdgeComputing #DataLake #AIOps #SmartInfrastructure #MachineLearning #Automation

With Gemini