Tightly Coupled AI Works

📊A Tightly Coupled AI Architecture

1. The 5 Pillars & Potential Bottlenecks (Top Section)

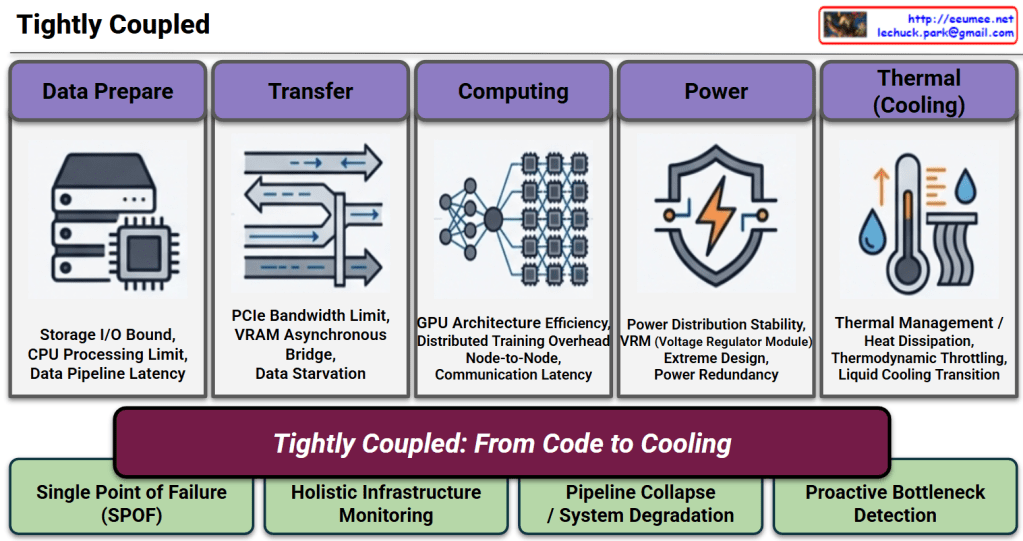
  • The Flow: The diagram visualizes the critical path of an AI workload, moving sequentially through Data PrepareTransferComputingPowerThermal (Cooling).
  • The Risks: Below each pillar, specific technical bottlenecks are listed (e.g., Storage I/O Bound, PCIe Bandwidth Limit, Thermodynamic Throttling). This highlights that each stage is highly sensitive; a delay or failure in any single component can starve the GPU or cause system-wide degradation.

2. The Core Message (Center Section)

  • The Banner: The central phrase, “Tightly Coupled: From Code to Cooling”, acts as the heart of the presentation. It boldly declares that AI infrastructure is no longer divided into “IT” and “Facilities.” Instead, it is a single, inextricably linked ecosystem where the execution of a single line of code directly translates to immediate physical power and cooling demands.

3. Strategic Implications & Solutions (Bottom Section)

  • The Reality (Left): Because the system is so interdependent, any Single Point of Failure (SPOF) will lead to a complete Pipeline Collapse / System Degradation.
  • The Operational Shift (Right): To prevent this, traditional siloed management must be replaced. The slide strongly argues for Holistic Infrastructure Monitoring and Proactive Bottleneck Detection. It visually proves that reacting to issues after they happen is too late; operations must be predictive and unified across the entire stack.

💡Summary

  • Interdependence: AI data centers operate as a single, highly sensitive organism where one isolated bottleneck can collapse the entire computational pipeline.
  • Paradigm Shift: The tight coupling of software workloads and physical facilities (“From Code to Cooling”) makes legacy, reactive monitoring obsolete.
  • Strategic Imperative: To ensure stability and efficiency, operations must transition to holistic, proactive detection driven by intelligent, autonomous management solutions.

#AIDataCenter #TightlyCoupled #InfrastructureMonitoring #ProactiveOperations #DataCenterArchitecture #AIInfrastructure #Power #Computing #Cooling #Data #IO #Memory


With Gemini

Legacy vs AI DC

Legacy DC vs. AI Factory

1. Legacy Data Center

  • Static Load: The flat line on the graph indicates that power and compute demands are stable, continuous, and highly predictable.
  • Air Cooling: Traditional fan-based air cooling systems are sufficient to manage the heat generated by standard, lower-density server racks.
  • Minutes Level Work: System responses, resource provisioning, and facility adjustments generally occur on a scale of minutes.
  • IT & OT Silo Ops: Information Technology (servers, networking) and Operational Technology (power, cooling facilities) are managed independently in isolated silos, with no real-time data exchange.

2. AI Factory (DC)

  • Dynamic/High-Density: The volatile, jagged graph illustrates how AI workloads create extreme, rapid power spikes and demand highly dense computing resources.
  • Liquid Cooling: The immense heat output from high-performance AI chips necessitates advanced liquid cooling solutions (represented by the water drop and circulation arrows) to maintain thermal efficiency.
  • Seconds Level Works: The physical infrastructure must be highly agile, detecting and responding to sudden dynamic workload changes and thermal shifts within seconds.
  • Workload Aware: The facility dynamically adapts its cooling and power based on real-time AI computing needs. Establishing this requires robust “IT/OT Data Convergence” and the utilization of “High-Fidelity Data” as key components of a broader “Digitalization” strategy.

Summary

  1. Legacy data centers are designed for predictable, static loads using traditional air cooling, with IT and facility operations (OT) isolated from one another.
  2. AI Factories must handle highly volatile, high-density workloads, making liquid cooling and instantaneous, seconds-level infrastructure responses mandatory.
  3. Transitioning to a true “Workload Aware” facility requires a strong “Digitalization” strategy centered around “IT/OT Data Convergence” and “High-Fidelity Data.”

#AIFactory #DataCenter #LiquidCooling #WorkloadAware #ITOTConvergence #HighFidelityData #Digitalization #AIInfrastructure

With Gemini

Prefill & Decode

This image illustrates the dual nature of Large Language Model (LLM) inference, breaking it down into two fundamental stages: Prefill and Decode.


1. Prefill Stage: Input Processing

The Prefill stage is responsible for processing the initial input prompt provided by the user.

  • Operation: It utilizes Parallel Computing to process the entire input data stream simultaneously.
  • Constraint: This stage is Compute-bound.
  • Performance Drivers:
    • Performance scales linearly with the GPU core frequency (clock speed).
    • It triggers sudden power spikes and high heat generation due to intensive processing over a short duration.
    • The primary goal is to understand the context of the entire input at once.

2. Decode Stage: Response Generation

The Decode stage handles the actual generation of the response, producing one token at a time.

  • Operation: it utilizes Sequential Computing, where each new token depends on the previous ones.
  • Constraint: This stage is Memory-bound (specifically, memory bandwidth-bound).
  • Performance Drivers:
    • The main bottleneck is the speed of fetching the KV Cache from memory (HBM).
    • Increasing the GPU clock speed provides minimal performance gains and often results in wasted power.
    • Overall performance is determined by the data transfer speed between the memory and the GPU.

Summary

  1. Prefill is the “understanding” phase that processes prompts in parallel and is limited by GPU raw computing power (Compute-bound).
  2. Decode is the “writing” phase that generates tokens one by one and is limited by how fast data moves from memory (Memory-bound).
  3. Optimizing LLMs requires balancing high GPU clock speeds for input processing with high memory bandwidth for fast output generation.

#LLM #Inference #GPU #PrefillVsDecode #AIInfrastructure #DeepLearning #ComputeBound #MemoryBandwidth

With Gemini

AI DC Power Risk


Technical Analysis: AI Load & Weak Grid Interaction

The integration of massive AI workloads into a Weak Grid (SCR:Short Circuit Ratio < 3) creates a high-risk environment where electrical Transients can escalate into systemic failures.

1. Voltage Dip (Transient Voltage Sag)

  • Mechanism: AI workloads are characterized by Step Power Changes and Pulse-type Profiles. When these massive loads activate simultaneously, they cause an immediate Transient Voltage Sag in a weak grid due to high impedance.
  • Impact: This compromises Power Quality, leading to potential malfunctions in voltage-sensitive AI hardware.

2. Load Drop (Transient Load Rejection)

  • Mechanism: If the voltage sag exceeds safety thresholds, protection systems trigger Load Rejection, causing the power consumption to plummet to zero (P -> 0).
  • Impact: This results in Service Downtime and creates a massive power imbalance in the grid, often referred to as Load Shedding.

3. Snap-back (Transient Recovery & Inrush)

  • Mechanism: As the grid attempts to recover or the load is re-engaged, it creates a Transient Recovery Voltage (TRV).
  • Impact: This phase often sees Overvoltage (Overshoot) and a massive Surge Inflow (Inrush Current), which places extreme electrical stress on power components and can damage sensitive circuitry.

4. Instability (Dynamic & Harmonic Oscillation)

  • Mechanism: The repetition of sags and surges leads to Dynamic Oscillation. The control systems of power converters may lose synchronization with the grid frequency.
  • Impact: The result is severe Waveform Distortion, Loss of Control, and eventually a total Grid Collapse (Blackout).

Key Insight (NERC 2025 Warning)

The North American Electric Reliability Corporation (NERC) warns that the reduction of voltage-sensitive loads and the rise of periodic, pulse-like AI workloads are primary drivers of modern grid instability.


Summary

  1. AI Load Dynamics: Rapid step-load changes in AI data centers act as a “shock” to weak grids, triggering a self-reinforcing cycle of electrical failure.
  2. Transient Progression: The cycle moves from a Voltage Sag to a Load Trip, followed by a damaging Power Surge, eventually leading to non-damped Oscillations.
  3. Strategic Necessity: To break this cycle, data centers must implement advanced solutions like Grid-forming Inverters or Fast-acting BESS to provide synthetic inertia and voltage support.

#PowerTransients #WeakGrid #AIDataCenter #GridStability #NERC2025 #VoltageSag #LoadShedding #ElectricalEngineering #AIInfrastructure #SmartGrid #PowerQuality

With Gemini

Peak Shaving


“Power – Peak Shaving” Strategy

The image illustrates a 5-step process for a ‘Peak Shaving’ strategy designed to maximize power efficiency in data centers. Peak shaving is a technique used to reduce electrical load during periods of maximum demand (peak times) to save on electricity costs and ensure grid stability.

1. IT Load & ESS SoC Monitoring

This is the data collection and monitoring phase to understand the current state of the system.

  • Grid Power: Monitoring the maximum power usage from the external power grid.
  • ESS SoC/SoH: Checking the State of Charge (SoC) and State of Health (SoH) of the Energy Storage System (ESS).
  • IT Load (PDU): Measuring the actual load through Power Distribution Units (PDUs) at the server rack level.
  • LLM/GPU Workload: Monitoring the real-time workload of AI models (LLM) and GPUs.

2. ML-based Peak Prediction

Predicting future power demand based on the collected data.

  • Integrated Monitoring: Consolidating data from across the entire infrastructure.
  • Machine Learning Optimization: Utilizing AI algorithms to accurately predict when power peaks will occur and preparing proactive responses.

3. Peak Shaving Via PCS (Power Conversion System)

Utilizing physical energy storage hardware to distribute the power load.

  • Pre-emptive Analysis & Preparation: Determining the “Time to Charge.” The system charges the batteries when electricity rates are low.
  • ESS DC Power: During peak times, the stored Direct Current (DC) in the ESS is converted to Alternating Current (AC) via the PCS to supplement the power supply, thereby reducing reliance on the external grid.

4. Job Relocation (K8s/Slurm)

Adjusting the scheduling of IT tasks based on power availability.

  • Scheduler Decision Engine: Activated when a peak time is detected or when ESS battery levels are low.
  • Job Control: Lower priority jobs are queued or paused, and compute speeds are throttled (power suppressed) to minimize consumption.

5. Parameter & Model Optimization

The most advanced stage, where the efficiency of the AI models themselves is optimized.

  • Real-time Batch Size Adjustment: Controlling throughput to prevent sudden power spikes.
  • Large Model -> sLLM (Lightweight): Transitioning to smaller, lightweight Large Language Models (sLLM) to reduce GPU power consumption without service downtime.

Summary

The core message of this diagram is that High-Quality/High-Resolution Data is the foundation for effective power management. By combining hardware solutions (ESS/PCS), software scheduling (K8s/Slurm), and AI model optimization (sLLM), a data center can significantly reduce operating expenses (OPEX) and ultimately increase profitability (Make money) through intelligent peak shaving.


#AI_DC #PowerControl #DataCenter #EnergyEfficiency #PeakShaving #GreenIT #MachineLearning #ESS #AIInfrastructure #GPUOptimization #Sustainability #TechInnovation

AI Cost


Strategic Analysis of the AI Cost Chart

1. Hardware (IT Assets): “The Investment Core”

  • Icon: A chip embedded in a complex network web.
  • Key Message: The absolute dominant force, consuming ~70% of the total budget.
  • Details:
    • Compute (The Lead): Features GPU clusters (H100/B200, NVL72). These are not just servers; they represent “High Value Density.”
    • Network (The Hidden Lead): No longer just cabling. The cost of Interconnects (InfiniBand/RoCEv2) and Optics (800G/1.6T) has surged to 15~20%, acting as the critical nervous system of the cluster.

2. Power (Energy): “The Capacity War”

  • Icon: An electric grid secured by a heavy lock (representing capacity security).
  • Key Message: A “Ratio Illusion.” While the percentage (~20%) seems stable due to the skyrocketing hardware costs, the absolute electricity bill has exploded.
  • Details:
    • Load Characteristic: The IT Load (Chip power) dwarfs the cooling load.
    • Strategy: The battle is not just about Efficiency (PUE), but about Availability (Grid Capacity) and Tariff Negotiation.

3. Facility & Cooling: “The Insurance Policy”

  • Icon: A vault holding gold bars (Asset Protection).
  • Key Message: Accounting for ~10% of CapEx, this is not an area for cost-cutting, but for “Premium Insurance.”
  • Details:
    • Paradigm Shift: The facility exists to protect the multi-million dollar “Silicon Assets.”
    • Technology: Zero-Failure is the goal. High-density technologies like DLC (Direct Liquid Cooling) and Immersion Cooling are mandatory to prevent thermal throttling.

4. Fault Cost (Operational Efficiency): “The Invisible Loss”

  • Icon: A broken pipe leaking coins (burning money).
  • Key Message: A “Hidden Cost” that determines the actual success or failure of the business.
  • Details:
    • Metric: The core KPI is MFU (Model Flop Utilization).
    • Impact: Any bottleneck (network stall, storage wait) results in “Stranded Capacity.” If utilization drops to 50%, you are effectively engaging in a “Silent Burn” of 50% of your massive CapEx investment.

💡 Architect’s Note

This chart perfectly illustrates “Why we need an AI DC Operating System.”

“Pillars 1, 2, and 3 (Hardware, Power, Facility) represent the massive capital burned during CONSTRUCTION.

Pillar 4 (Fault Cost) is the battleground for OPERATION.”

Your Operating System is the solution designed to plug the leak in Pillar 4, ensuring that the astronomical investments in Pillars 1, 2, and 3 translate into actual computational value.


Summary

The AI Data Center is a “High-Value Density Asset” where Hardware dominates CapEx (~70%), Power dominates OpEx dynamics, and Facility acts as Insurance. However, the Operational System (OS) is the critical differentiator that prevents Fault Cost—the silent killer of ROI—by maximizing MFU.

#AIDataCenter #AIInfrastructure #GPUUnitEconomics #MFU #FaultCost #DataCenterOS #LiquidCooling #CapExStrategy #TechArchitecture

AI Triangle


📐 The AI Triangle: Core Pillars of Evolution

1. Data: The Fuel for AI

Data serves as the essential raw material that determines the intelligence and accuracy of AI models.

  • Large-scale Datasets: Massive volumes of information required for foundational training.
  • High-quality/High-fidelity: The emphasis on clean, accurate, and reliable data to ensure superior model performance.
  • Data-centric AI: A paradigm shift focusing on enhancing data quality rather than just iterating on model code.

2. Algorithms: The Brain of AI

Algorithms provide the logical framework and mathematical structures that allow machines to learn from data.

  • Deep Learning (Neural Networks): Multi-layered architectures inspired by the human brain to process complex information.
  • Pattern Recognition: The ability to identify hidden correlations and make predictions from raw inputs.
  • Model Optimization: Techniques to improve efficiency, reduce latency, and minimize computational costs.

3. Infrastructure: The Backbone of AI

The physical and digital foundation that enables massive computations and ensures system stability.

  • Computing Resources (IT Infra):
    • HPC & Accelerators: High-performance clusters utilizing GPUs, NPUs, and HBM/PIM for parallel processing.
  • Physical Infrastructure (Facilities):
    • Power Delivery: Reliable, high-density power systems including UPS, PDU, and smart energy management.
    • Thermal Management: Advanced cooling solutions like Liquid Cooling and Immersion Cooling to handle extreme heat from AI chips.
    • Scalability & PUE: Focus on sustainable growth and maximizing energy efficiency (Power Usage Effectiveness).

📝 Summary

  1. The AI Triangle represents the vital synergy between high-quality Data, sophisticated Algorithms, and robust Infrastructure.
  2. While data fuels the model and algorithms provide the logic, infrastructure acts as the essential backbone that supports massive scaling and operational reliability.
  3. Modern AI evolution increasingly relies on advanced facility management, specifically optimized power delivery and high-efficiency cooling, to sustain next-generation workloads.

#AITriangle #AIInfrastructure #DataCenter #DeepLearning #GPU #LiquidCooling #DataCentric #Sustainability #PUE #TechArchitecture

With Gemini