AI DC : CAPEX to OPEX

Thinking of an AI Data Center (DC) through the lens of a Rube Goldberg Machine is a brilliant way to visualize the “cascading complexity” of modern infrastructure. In this setup, every high-tech component acts as a trigger for the next, often leading to unpredictable and costly outcomes.


The AI DC Rube Goldberg Chain: From CAPEX to OPEX

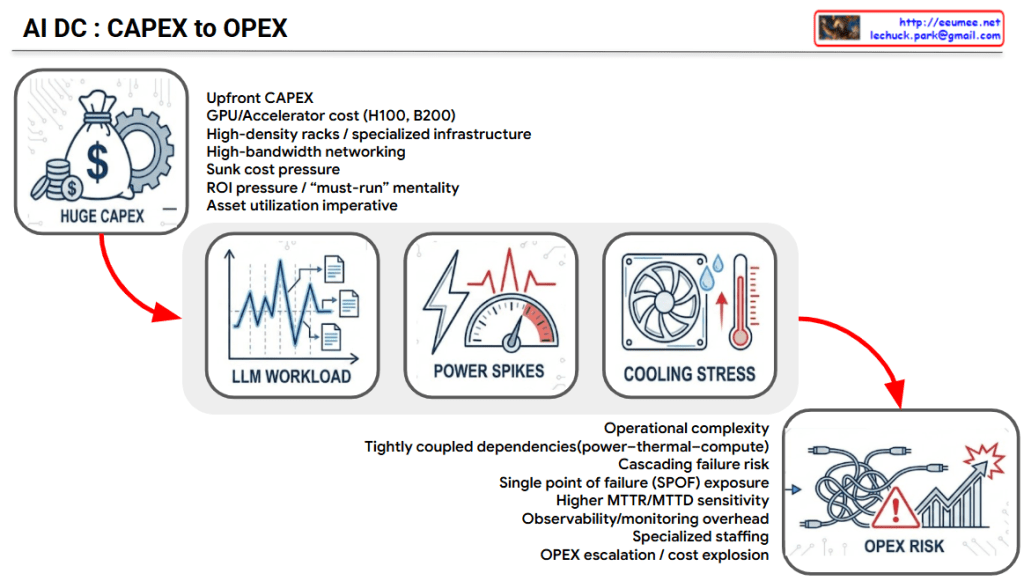
1. The Heavy Trigger: Massive CAPEX

The machine starts with a massive “weighted ball”—the Upfront CAPEX.

  • The Action: Billions are poured into H100/B200 GPUs and specialized high-density racks.
  • The Consequence: This creates immense “Sunk Cost Pressure.” Because the investment is so high, there is a “must-run” mentality to ensure maximum asset utilization. You cannot afford to let these expensive chips sit idle.

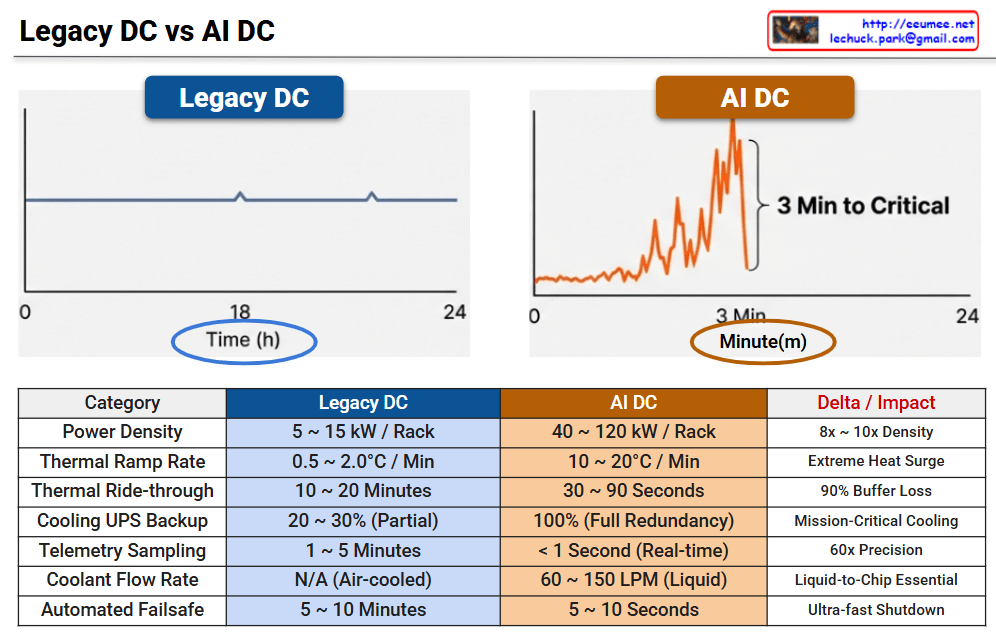
2. The Erratic Spinner: LLM Workload Volatility

As the ball rolls, it hits an unpredictable spinner: the Workload.

  • The Action: Unlike traditional steady-state cloud tasks, LLM workloads (training vs. inference) are highly “bursty”.
  • The Consequence: The demand for compute fluctuates wildly and unpredictably, making it impossible to establish a smooth operational rhythm.

3. The Power Lever: Energy Spikes

The erratic workload flips a lever that controls the Power Grid.

  • The Action: When the LLM workload spikes, the power draw follows instantly. This creates Power Spikes ($\Delta P$) that strain the electrical infrastructure.
  • The Consequence: These spikes threaten grid stability and increase the sensitivity of Power Distribution Units (PDUs) and UPS systems.

4. The Thermal Valve: Cooling Stress

The surge in power generates intense heat, triggering the Cooling System.

  • The Action: Heat is the literal byproduct of energy consumption. As power spikes, the temperature rises sharply, forcing cooling fans and liquid cooling loops into overdrive.
  • The Consequence: This creates Cooling Stress. If the cooling cannot react as fast as the power spike, the system faces “Thermal Throttling,” which slows down the compute and ruins efficiency.

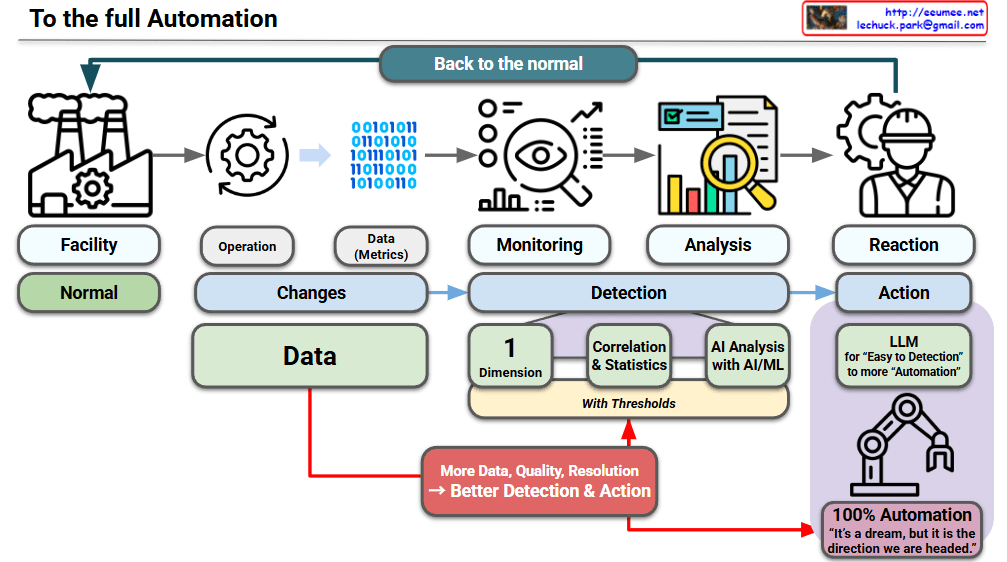
5. The Tangled Finish: Escalating OPEX Risk

Finally, all these moving parts lead to a messy, high-risk conclusion: Operational Complexity.

  • The Action: Because power, thermal, and compute are “Tightly Coupled,” a failure in one area causes a Cascading Failure across the others.
  • The Consequence: You now face a “Single Point of Failure” (SPOF) risk. Managing this requires specialized staffing and expensive observability tools, leading to an OPEX Explosion.

Summary

  1. Massive CAPEX creates a “must-run” pressure that forces GPUs to operate at high intensity to justify the investment.
  2. The interconnected volatility of workloads, power, and cooling creates a fragile “Rube Goldberg” chain where a single spike can cause a system-wide failure.
  3. This complexity shifts the financial burden from initial hardware costs to unpredictable OPEX, requiring expensive specialized management to prevent a total crash.

#AIDC #CAPEXtoOPEX #LLMWorkload #DataCenterManagement #OperationalRisk #InfrastructureComplexity #GPUComputing


With Gemini

Legacy DC vs AI DC

This infographic illustrates the radical shift in operational paradigms between Legacy Data Centers and AI Data Centers, highlighting the transition from “Human-Speed” steady-state management to “Machine-Speed” real-time automation.


📊 Legacy DC vs. AI DC: Operational Metrics Comparison

CategoryLegacy DCAI DCDelta / Impact
Power Density5 ~ 15 kW / Rack40 ~ 120 kW / Rack8x ~ 10x Density
Thermal Ramp Rate0.5 ~ 2.0°C / Min10 ~ 20°C / MinExtreme Heat Surge
Thermal Ride-through10 ~ 20 Minutes30 ~ 90 Seconds90% Buffer Loss
Cooling UPS Backup20 ~ 30% (Partial)100% (Full Redundancy)Mission-Critical Cooling
Telemetry Sampling1 ~ 5 Minutes< 1 Second (Real-time)60x Precision
Coolant Flow RateN/A (Air-cooled)60 ~ 150 LPM (Liquid)Liquid-to-Chip Essential
Automated Failsafe5 ~ 10 Minutes5 ~ 10 SecondsUltra-fast Shutdown

🔍 Graphical Analysis

1. The Volatility Gap

  • Legacy DC: Shows a stable, predictable power load across a 24-hour cycle. Operations are steady-state and managed on an hourly basis.
  • AI DC: Features extreme load fluctuations that can reach critical levels within just 3 minutes. This requires monitoring and response to be measured in minutes and seconds rather than hours.

2. The Cooling Imperative

With rack densities reaching 120 kW, air cooling is no longer viable. The shift to Liquid-to-Chip cooling with flow rates up to 150 LPM is mandatory to manage the 10–20°C per minute thermal ramp rates.

3. The End of Manual Intervention

In a Legacy DC, operators have a 20-minute “Golden Hour” to respond to cooling failures. In an AI DC, this buffer collapses to seconds, making sub-second telemetry and automated failsafe protocols the only way to prevent hardware damage.


💡 Summary

  1. Density & Cooling Leap: AI DC demands up to 10x higher power density, necessitating a fundamental shift from traditional air cooling to Direct-to-Chip liquid cooling.
  2. Vanishing Buffer Time: Thermal ride-through time has shrunk from 20 minutes to less than 90 seconds, leaving zero room for manual human intervention during failures.
  3. Real-Time Autonomy: The operational paradigm has shifted to “Machine-Speed” automated control, requiring sub-second telemetry to handle extreme load volatility and ultra-fast failsafe needs.

#AIDataCenter #AIOps #LiquidCooling #InfrastructureOptimization #DataCenterDesign #HighDensityComputing #ThermalManagement #DigitalTransformation

With Gemini

DynamoLLM

The provided infographic illustrates DynamoLLM, an intelligent power-saving framework specifically designed for operating Large Language Models (LLMs). Its primary mission is to minimize energy consumption across the entire infrastructure—from the global cluster down to individual GPU nodes—while strictly maintaining Service Level Objectives (SLO).


## 3-Step Intelligent Power Saving

1. Cluster Manager (Infrastructure Level)

This stage ensures that the overall server resources match the actual demand to prevent idle waste.

  • Monitoring: Tracks the total cluster workload and the number of currently active servers.
  • Analysis: Evaluates if the current server group is too large or if resources are excessive.
  • Action: Executes Dynamic Scaling by turning off unnecessary servers to save power at the fleet level.

2. Queue Manager (Workload Level)

This stage organizes incoming requests to maximize the efficiency of the processing phase.

  • Monitoring: Identifies request types (input/output token lengths) and their similarities.
  • Analysis: Groups similar requests into efficient “task pools” to streamline computation.
  • Action: Implements Smart Batching to improve processing efficiency and reduce operational overhead.

3. Instance Manager (GPU Level)

As the core technology, this stage manages real-time power at the hardware level.

  • Monitoring: Observes real-time GPU load and Slack Time (the extra time available before a deadline).
  • Analysis: Calculates the minimum processing speed required to meet the service goals (SLO) without over-performing.
  • Action: Utilizes DVFS (Dynamic Voltage and Frequency Scaling) to lower GPU frequency and minimize power draw.

# Summary

  1. DynamoLLM is an intelligent framework that minimizes LLM energy use across three layers: Cluster, Queue, and Instance.
  2. It maintains strict service quality (SLO) by calculating the exact performance needed to meet deadlines without wasting power.
  3. The system uses advanced techniques like Dynamic Scaling and DVFS to ensure GPUs only consume as much energy as a task truly requires.

#DynamoLLM #GreenAI #LLMOps #EnergyEfficiency #GPUOptimization #SustainableAI #CloudComputing

With Gemini

To the full Automation

This visual emphasizes the critical role of high-quality data as the engine driving the transition from human-led reactions to fully autonomous operations. This roadmap illustrates how increasing data resolution directly enhances detection and automated actions.


Comprehensive Analysis of the Updated Roadmap

1. The Standard Operational Loop

The top flow describes the current state of industrial maintenance:

  • Facility (Normal): The baseline state where everything functions correctly.
  • Operation (Changes) & Data: Any deviation in operation produces data metrics.
  • Monitoring & Analysis: The system observes these metrics to identify anomalies.
  • Reaction: Currently, a human operator (the worker icon) must intervene to bring the system “Back to the normal”.

2. The Data Engine

The most significant addition is the emphasized Data block and its impact on the automation cycle:

  • Quality and Resolution: The diagram highlights that “More Data, Quality, Resolution” are the foundation.
  • Optimization Path: This high-quality data feeds directly into the “Detection” layer and the final “100% Automation” goal, stating that better data leads to “Better Detection & Action”.

3. Evolution of Detection Layers

Detection matures through three distinct levels, all governed by specific thresholds:

  • 1 Dimension: Basic monitoring of single variables.
  • Correlation & Statistics: Analyzing relationships between different data points.
  • AI Analysis with AI/ML: Utilizing advanced machine learning for complex pattern recognition.

4. The Goal: 100% Automation

The final stage replaces human “Reaction” with autonomous “Action”:

  • LLM Integration: Large Language Models are utilized to bridge the gap from “Easy Detection” to complex “Automation”.
  • The Vision: The process culminates in 100% Automation, where a robotic system handles the recovery loop independently.
  • The Philosophy: It concludes with the defining quote: “It’s a dream, but it is the direction we are headed”.

Summary

  • The roadmap evolves from human intervention (Reaction) to autonomous execution (Action) powered by AI and LLMs.
  • High-resolution data quality is identified as the core driver that enables more accurate detection and reliable automated outcomes.
  • The ultimate objective is a self-correcting system that returns to a “Normal” state without manual effort.

#HyperAutomation #DataQuality #IndustrialAI #SmartManufacturing #LLM #DigitalTwin #AutonomousOperations #AIOp

With Gemini

Predictive/Proactive/Reactive

The infographic visualizes how AI technologies (Machine Learning and Large Language Models) are applied across Predictive, Proactive, and Reactive stages of facility management.


1. Predictive Stage

This is the most advanced stage, anticipating future issues before they occur.

  • Core Goal: “Predict failures and replace planned.”
  • Icon Interpretation: A magnifying glass is used to examine a future point on a rising graph, identifying potential risks (peaks and warnings) ahead of time.
  • Role of AI:
    • [ML] The Forecaster: Analyzes historical data to calculate precisely when a specific component is likely to fail in the future.
    • [LLM] The Interpreter: Translates complex forecast data and probabilities into plain language reports that are easy for human operators to understand.
  • Key Activity: Scheduling parts replacement and maintenance windows well before the predicted failure date.

2. Proactive Stage

This stage focuses on optimizing current conditions to prevent problems from developing.

  • Core Goal: “Optimize inefficiencies before they become problems.”
  • Icon Interpretation: On a stable graph, a wrench is shown gently fine-tuning the system for optimization, protected by a shield icon representing preventative measures.
  • Role of AI:
    • [ML] The Optimizer: Identifies inefficient operational patterns and determines the optimal configurations for current environmental conditions.
    • [LLM] The Advisor: Suggests specific, actionable strategies to improve efficiency (e.g., “Lower cooling now to save energy”).
  • Key Activity: Dynamically adjusting system settings in real-time to maintain peak efficiency.

3. Reactive Stage

This stage deals with responding rapidly and accurately to incidents that have already occurred.

  • Core Goal: “Identify root cause instantly and recover rapidly.”
  • Icon Interpretation: A sharp drop in the graph accompanied by emergency alarms, showing an urgent repair being performed on a broken server rack.
  • Role of AI:
    • [ML] The Filter: Cuts through the noise of massive alarm volumes to instantly isolate the true, critical issue.
    • [LLM] The Troubleshooter: Reads and analyzes complex error logs to determine the root cause and retrieves the correct Standard Operating Procedure (SOP) or manual.
  • Key Activity: Rapidly executing the guided repair steps provided by the system.

Summary

  • The image illustrates the evolution of data center operations from traditional Reactive responses to intelligent Proactive optimization and Predictive maintenance.
  • It clearly delineates the roles of AI, where Machine Learning (ML) handles data analysis and forecasting, while Large Language Models (LLMs) interpret these insights and provide actionable guidance.
  • Ultimately, this integrated AI approach aims to maximize uptime, enhance energy efficiency, and accelerate incident recovery in critical infrastructure.

#DataCenter #AIOps #PredictiveMaintenance #SmartInfrastructure #ArtificialIntelligence #MachineLearning #LLM #FacilityManagement #ITOps

with Gemini

Power-Driven Predictive Cooling Control (Without Server Telemetry)

For a Co-location (Colo) service provider, the challenge is managing high-density AI workloads without having direct access to the customer’s proprietary server data or software stacks. This second image provides a specialized architecture designed to overcome this “data blindness” by using infrastructure-level metrics.


1. The Strategy: Managing the “Black Box”

In a co-location environment, the server internal data—such as LLM Job Schedules, GPU/HBM telemetry, and Internal Temperatures—is often restricted for security and privacy reasons. This creates a “Black Box” for the provider. The architecture shown here shifts the focus from the Server Inside to the Server Outside, where the provider has full control and visibility.

2. Power as the Primary Lead Indicator

Because the provider cannot see when an AI model starts training, they must rely on Power Supply telemetry as a proxy.

  • The Power-Heat Correlation: As indicated by the red arrow, there is a near-instantaneous correlation between GPU activity and power draw ($kW$).
  • Zero-Inference Monitoring: By monitoring Power Usage & Trends at the PDU (Power Distribution Unit) level, the provider can detect a workload spike the moment it happens, often several minutes before the heat actually migrates to the rack-level sensors.

3. Bridging the Gap with ML Analysis

Since the provider is missing the “More Proactive” software-level data, the Analysis with ML component becomes even more critical.

  • Predictive Modeling: The ML engine analyzes power trends to forecast the thermal discharge. It learns the specific “power signature” of AI workloads, allowing it to initiate a Cooling Response (adjusting Flow Rate in LPM and $\Delta T$) before the ambient temperature rises.
  • Optimization without Intrusion: This allows the provider to maintain a strict SLA (Service Level Agreement) and optimize PUE (Power Usage Effectiveness) without requiring the tenant to install agents or share sensitive job telemetry.

Comparison for Co-location Providers

FeatureIdeal Model (Image 1)Practical Colo Model (Image 2)
VisibilityFull-stack (Software to Hardware)Infrastructure-only (Power & Air/Liquid)
Primary MetricLLM Job Queue / GPU TempPower Trend ($kW$) / Rack Density
Tenant PrivacyLow (Requires data sharing)High (Non-intrusive)
Control PrecisionExtremely HighHigh (Dependent on Power Sampling Rate)

Summary

  1. For Co-location providers, this architecture solves the lack of server-side visibility by using Power Usage ($kW$) as a real-time proxy for heat generation.
  2. By monitoring Power Trends at the infrastructure level, the system can predict thermal loads and trigger Cooling Responses before temperature sensors even react.
  3. This ML-driven approach enables high-efficiency cooling and PUE optimization while respecting the strict data privacy and security boundaries of multi-tenant AI data centers.

Hashtags

#Colocation #DataCenterManagement #PredictiveCooling #AICooling #InfrastructureOptimization #PUE #LiquidCooling #MultiTenantSecurity

With Gemini

Peak Shaving


“Power – Peak Shaving” Strategy

The image illustrates a 5-step process for a ‘Peak Shaving’ strategy designed to maximize power efficiency in data centers. Peak shaving is a technique used to reduce electrical load during periods of maximum demand (peak times) to save on electricity costs and ensure grid stability.

1. IT Load & ESS SoC Monitoring

This is the data collection and monitoring phase to understand the current state of the system.

  • Grid Power: Monitoring the maximum power usage from the external power grid.
  • ESS SoC/SoH: Checking the State of Charge (SoC) and State of Health (SoH) of the Energy Storage System (ESS).
  • IT Load (PDU): Measuring the actual load through Power Distribution Units (PDUs) at the server rack level.
  • LLM/GPU Workload: Monitoring the real-time workload of AI models (LLM) and GPUs.

2. ML-based Peak Prediction

Predicting future power demand based on the collected data.

  • Integrated Monitoring: Consolidating data from across the entire infrastructure.
  • Machine Learning Optimization: Utilizing AI algorithms to accurately predict when power peaks will occur and preparing proactive responses.

3. Peak Shaving Via PCS (Power Conversion System)

Utilizing physical energy storage hardware to distribute the power load.

  • Pre-emptive Analysis & Preparation: Determining the “Time to Charge.” The system charges the batteries when electricity rates are low.
  • ESS DC Power: During peak times, the stored Direct Current (DC) in the ESS is converted to Alternating Current (AC) via the PCS to supplement the power supply, thereby reducing reliance on the external grid.

4. Job Relocation (K8s/Slurm)

Adjusting the scheduling of IT tasks based on power availability.

  • Scheduler Decision Engine: Activated when a peak time is detected or when ESS battery levels are low.
  • Job Control: Lower priority jobs are queued or paused, and compute speeds are throttled (power suppressed) to minimize consumption.

5. Parameter & Model Optimization

The most advanced stage, where the efficiency of the AI models themselves is optimized.

  • Real-time Batch Size Adjustment: Controlling throughput to prevent sudden power spikes.
  • Large Model -> sLLM (Lightweight): Transitioning to smaller, lightweight Large Language Models (sLLM) to reduce GPU power consumption without service downtime.

Summary

The core message of this diagram is that High-Quality/High-Resolution Data is the foundation for effective power management. By combining hardware solutions (ESS/PCS), software scheduling (K8s/Slurm), and AI model optimization (sLLM), a data center can significantly reduce operating expenses (OPEX) and ultimately increase profitability (Make money) through intelligent peak shaving.


#AI_DC #PowerControl #DataCenter #EnergyEfficiency #PeakShaving #GreenIT #MachineLearning #ESS #AIInfrastructure #GPUOptimization #Sustainability #TechInnovation