Fault Detection and Recovery: Data Pipeline


Fault Detection and Recovery: Data Pipeline

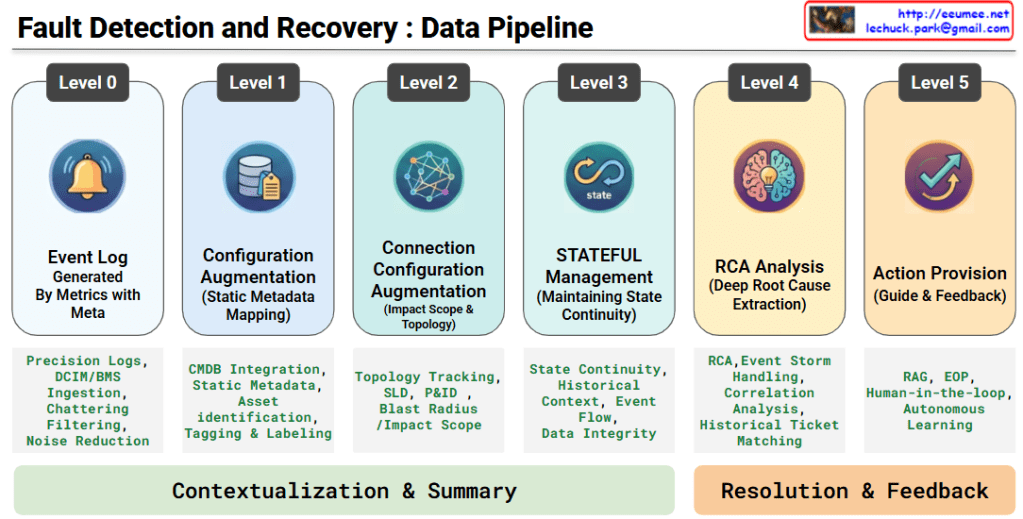
This architecture illustrates an advanced, six-stage, end-to-end data pipeline designed for an AI-driven infrastructure agent. It demonstrates how raw telemetry is systematically transformed into actionable, automated remediation through two primary phases.

Phase 1: Contextualization & Summary

This phase is dedicated to building a high-resolution, stateful understanding of the infrastructure. It takes raw alerts and layers them with critical physical and logical context.

  • Level 0: Event Log (Generated By Metrics with Meta)The foundation of the pipeline. High-precision logs and telemetry are ingested from DCIM/BMS systems. Crucially, this stage performs chattering filtering and noise reduction to isolate genuine anomalies from meaningless alerts.
  • Level 1: Configuration Augmentation (Static Metadata Mapping)Raw events are enriched by integrating with the CMDB. By mapping static metadata to the alerts, the system performs precise asset identification, tagging, and labeling to know exactly which component is affected.
  • Level 2: Connection Configuration Augmentation (Impact Scope & Topology)The pipeline maps the isolated asset against physical and logical topologies (such as Single Line Diagrams and P&IDs). This enables the system to track dependencies and accurately calculate the blast radius or impact scope of a fault.
  • Level 3: STATEFUL Management (Maintaining State Continuity)Moving beyond isolated, point-in-time alerts, this level links current events with historical context and event flows. It ensures data integrity and maintains a continuous, stateful tracking of the system’s health.

Phase 2: Resolution & Feedback

With a fully contextualized baseline established, the pipeline shifts from situational awareness to intelligent diagnosis and automated remediation.

  • Level 4: RCA Analysis (Deep Root Cause Extraction)During an event storm, the system performs advanced correlation analysis and historical trouble-ticket matching. It sifts through the cascading symptoms to pinpoint the deep root cause (RCA) of the failure.
  • Level 5: Action Provision (Guide & Feedback)In the final stage, the platform leverages RAG (Retrieval-Augmented Generation) to instantly surface the most relevant Emergency Operating Procedures (EOP). By incorporating a Human-in-the-loop (HITL) feedback mechanism, expert operators validate the actions, allowing the AI model to continuously undergo autonomous learning and refine its future responses.

Summary

This data pipeline elegantly maps the journey from raw infrastructure noise to intelligent, automated resolution. By progressively layering static configuration data, topology mapping, and stateful tracking over high-precision logs, the architecture effectively neutralizes event storms. Ultimately, it empowers AI-driven agents to deliver highly accurate root cause analyses and RAG-assisted operational guides, creating a resilient system that continuously learns and improves through expert human feedback.

#AIOps #DataCenterArchitecture #RootCauseAnalysis #SystemObservability #RAG #FaultDetection #Telemetry #HumanInTheLoop #InfrastructureAutomation #TechInfographic

With Gemini
Data for DC

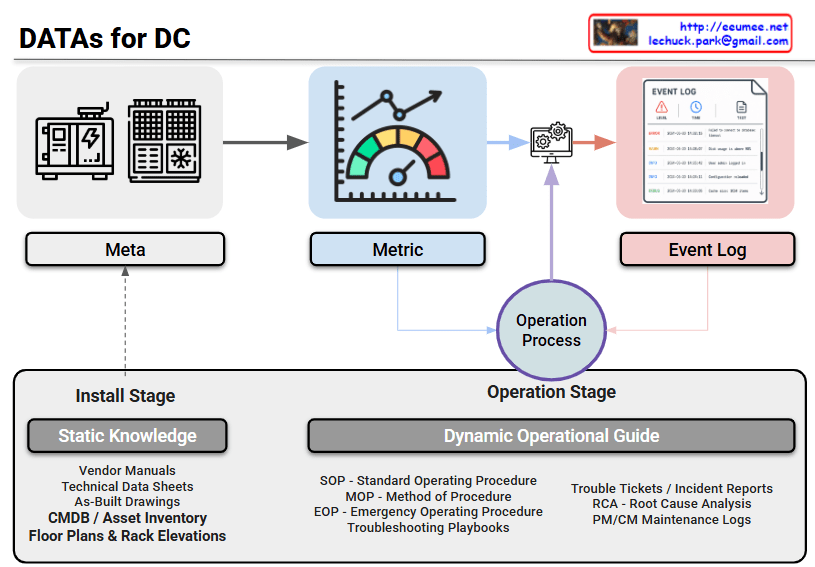
1. The Three Core Data Types (Top Section)

At the top, the diagram maps out the primary real-time and structural data inputs flowing from the infrastructure:

  • Meta: This represents the foundational metadata of the facility—the physical and logical configuration of equipment like generators, server racks, and liquid cooling units. It acts as the anchor point for the entire monitoring ecosystem.
  • Metric: Illustrated by the gauge, this is the continuous, time-series telemetry data. It includes critical real-time performance indicators, such as power loads, latency, or the return temperature from cooling units.
  • Event Log: The document icon on the right captures asynchronous system logs, alerts, and warnings (e.g., error thresholds being breached or state changes).

2. The Knowledge Base / RAG Corpus (Bottom Section)

The bottom half categorizes the facility’s documentation across its lifecycle. This perfectly outlines the corpus structure required to feed an AI’s Retrieval-Augmented Generation (RAG) system:

  • Install Stage (Static Knowledge): This is the baseline documentation established during construction and deployment. It includes Vendor Manuals, Technical Data Sheets, As-Built Drawings, CMDB, and Rack Elevations. Notice the dotted arrow showing how this static knowledge directly informs and establishes the “Meta” data above.
  • Operation Stage (Dynamic Operational Guide): This represents the evolving, lived intelligence of the facility. It captures structured response frameworks (SOP, MOP, EOP) alongside historical operational data like Trouble Tickets, RCA (Root Cause Analysis), and Maintenance Logs.

3. The Operation Process (Center)

The purple “Operation Process” node acts as the cognitive center or the execution engine. Real-time anomalies detected via Metrics and Event Logs flow into this process. The system then queries the Dynamic Operational Guide to find the correct standard operating procedures or historical RCA to resolve the issue. The resulting action or insight is then fed back into the central monitoring and management system.


Summary

This diagram elegantly maps out the data architecture of a modern facility. It visualizes how static foundational knowledge and dynamic operational history combine to inform real-time monitoring and incident response. By categorizing data into Meta, Metric, Event Logs, and structural lifecycle knowledge, it provides a clear, actionable framework for implementing data-driven operations, high-resolution observability, and AI-assisted automation platforms.

#DataCenterArchitecture #AIOps #RAG #InfrastructureObservability #SystemTelemetry #RootCauseAnalysis #TechInfographic

With Gemini

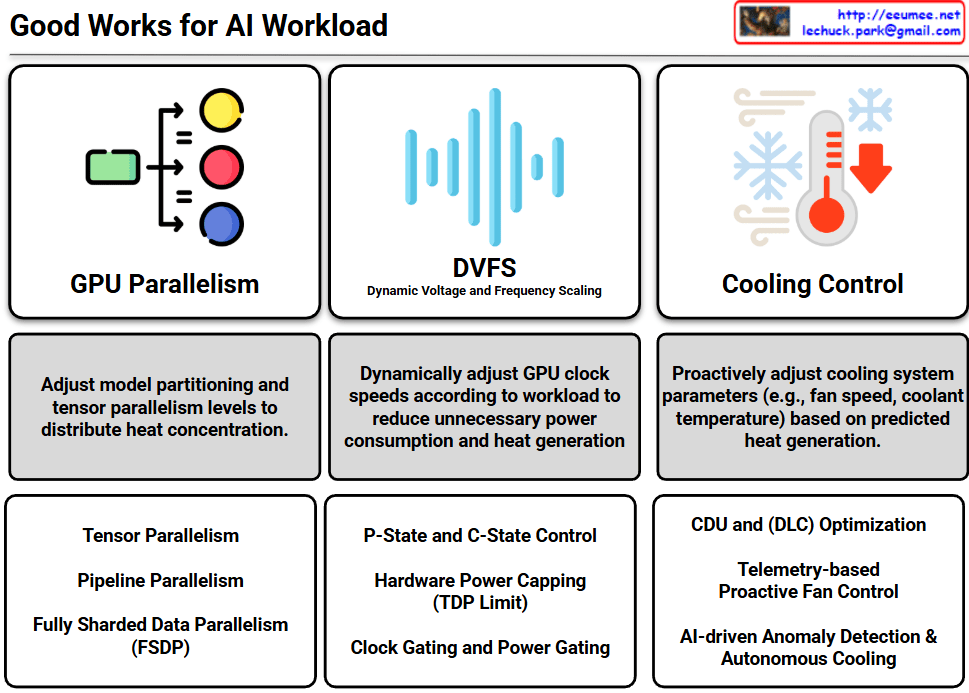
Good Works for AI workloads

The infographic outlines a comprehensive strategy for optimizing AI workloads by balancing computational performance with power efficiency and thermal management.


1. GPU Parallelism

This section focuses on distributing the computational load to prevent “hot spots” (heat concentration) within the hardware.

  • Core Strategy: Adjusting model partitioning and tensor parallelism levels to balance the thermal load across multiple GPUs.
  • Key Techniques: * Tensor Parallelism: Splitting individual tensors across devices.
    • Pipeline Parallelism: Distributing different layers of a model across various GPUs.
    • FSDP (Fully Sharded Data Parallelism): Sharding model states to minimize memory overhead while maintaining high throughput.

2. DVFS (Dynamic Voltage and Frequency Scaling)

This represents the hardware-level power management used to reduce energy waste.

  • Core Strategy: Dynamically adjusting GPU clock speeds and voltages based on the real-time workload to minimize unnecessary heat generation.
  • Key Techniques:
    • P-State and C-State Control: Managing active performance and idle power states.
    • Hardware Power Capping (TDP Limit): Setting strict thermal design power limits to prevent overheating.
    • Clock/Power Gating: Shutting down power to inactive portions of the chip.

3. Cooling Control

This shifts the focus from reactive cooling to proactive and autonomous thermal infrastructure management.

  • Core Strategy: Pre-emptively adjusting cooling parameters (fan speeds, coolant temperatures) based on predicted heat generation from incoming workloads.
  • Key Techniques:
    • CDU and DLC Optimization: Maximizing the efficiency of Coolant Distribution Units and Direct Liquid Cooling systems.
    • Telemetry-based Proactive Control: Using real-time data to adjust infrastructure before temperatures spike.
    • AI-driven Autonomous Cooling: Utilizing AI for anomaly detection and self-regulating thermal environments.

#AIDataCenter #GPUOptimization #LiquidCooling #AIOps #EnergyEfficiency #ParallelComputing #SustainableAI #ThermalManagement #HPC #DeepLearningInfrastructure

With Gemini

Autonomous Facility Operation Optimization Pipeline


Autonomous Facility Operation Optimization Pipeline

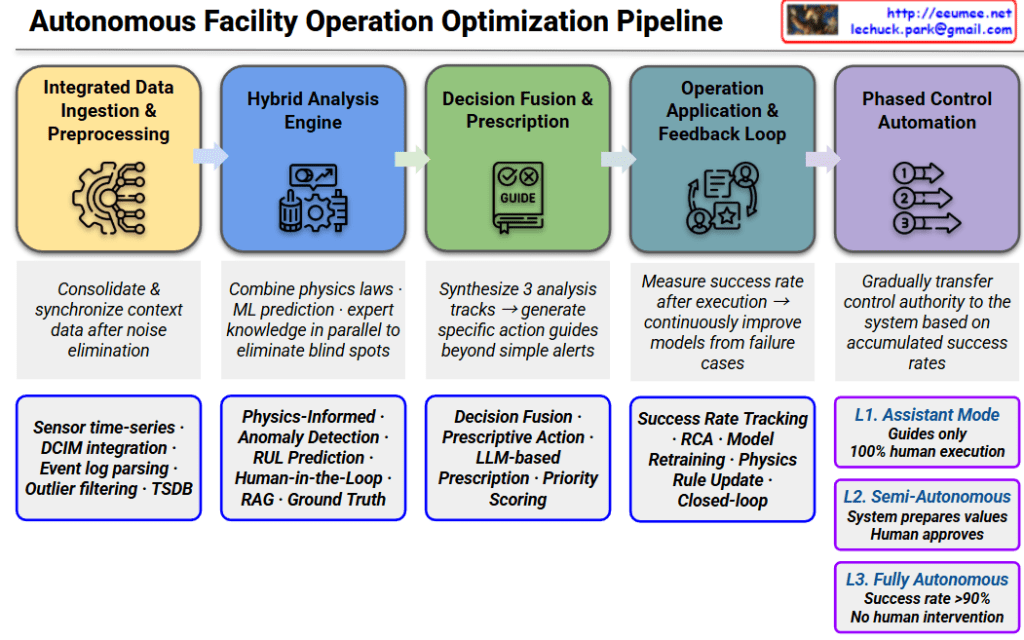
This pipeline represents a sophisticated 5-stage workflow designed to transition facility management from manual oversight to full AI-driven autonomy, ensuring reliability through hybrid modeling.

1. Integrated Data Ingestion & Preprocessing

  • Role: Consolidates diverse data streams into a synchronized, high-fidelity format by eliminating noise.
  • Key Components: Sensor time-series data, DCIM integration, Event log parsing, Outlier filtering, and TSDB (Time Series Database).

2. Hybrid Analysis Engine

  • Role: Eliminates analytical blind spots by running physical laws, machine learning predictions, and expert knowledge in parallel.
  • Key Components: Physics-Informed Machine Learning (PIML), Anomaly Detection, RUL (Remaining Useful Life) Prediction, and RAG-enhanced Ground Truth analysis.

3. Decision Fusion & Prescription

  • Role: Synthesizes multi-track analysis to move beyond simple alerts, generating specific, actionable “prescriptions.”
  • Key Components: Decision Fusion, Prescriptive Action, LLM-based Prescription, and Priority Scoring to rank urgency.

4. Operation Application & Feedback Loop

  • Role: Establishes a closed-loop system that measures success rates post-execution to continuously refine models.
  • Key Components: Success Rate Tracking, RCA (Root Cause Analysis), Model Retraining, and Physics/Rule updates based on real-world performance.

5. Phased Control Automation

  • Role: A risk-mitigated transition of control authority from humans to AI based on accumulated performance data.
  • Automation Levels:
    • L1. Assistant Mode: System provides guides only; 100% human execution.
    • L2. Semi-Autonomous: System prepares optimized values; human provides final approval.
    • L3. Fully Autonomous: System operates without human intervention (triggered when success rate >90%).

Strategic Insight

The hallmark of this architecture is the integration of Physics-Informed ML and LLM-based reasoning. By combining the rigid reliability of physical laws with the adaptive reasoning of Large Language Models, the pipeline solves the “black box” problem of traditional AI, making it suitable for mission-critical infrastructures like AI Data Centers.

#DataCenter #AIOps #AutonomousInfrastructure #PhysicsInformedML #DigitalTwin #LLM #PredictiveMaintenance #DataCenterOptimization #TechVisualization #SmartFacility #EngineeringExcellence

Hybrid Analysis for Autonomous Operation (1)


Hybrid Analysis for Autonomous Operation (1)

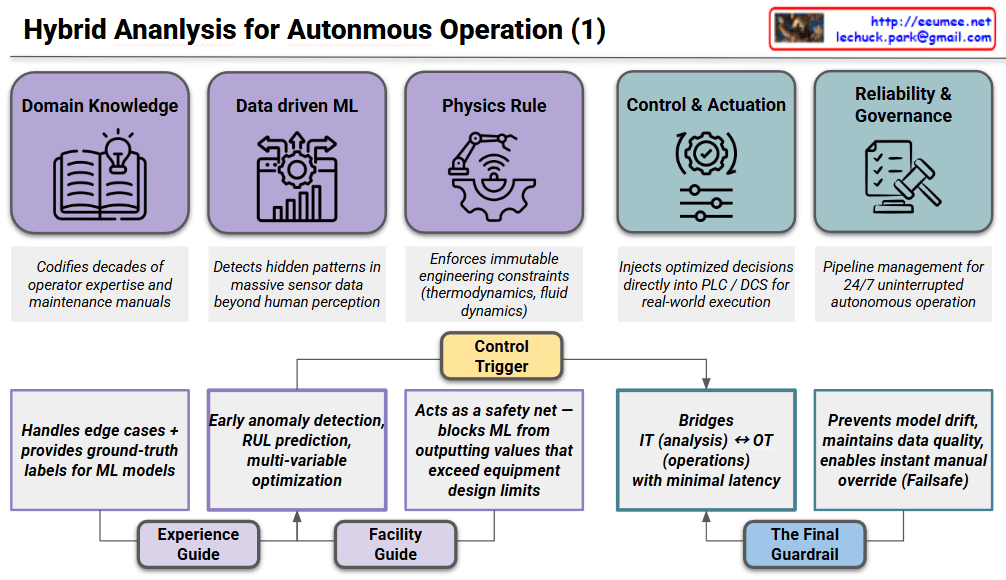
This framework illustrates a holistic approach to autonomous systems, integrating human expertise, physical laws, and AI to ensure safe and efficient real-world execution.

1. Five Core Modules (Top Layer)

  • Domain Knowledge: Codifies decades of operator expertise and maintenance manuals into digital logic.
  • Data-driven ML: Detects hidden patterns in massive sensor data that go beyond human perception.
  • Physics Rule: Enforces immutable engineering constraints (such as thermodynamics or fluid dynamics) to ground the AI in reality.
  • Control & Actuation: Injects optimized decisions directly into PLC / DCS (Distributed Control Systems) for real-world execution.
  • Reliability & Governance: Manages the entire pipeline to ensure 24/7 uninterrupted autonomous operation.

2. Integrated Value Drivers (Bottom Layer)

These modules work in synergy to create three essential “Guides” for the system:

  • Experience Guide: Combines domain expertise with ML to handle edge cases and provide high-quality ground-truth labels for model training.
  • Facility Guide: Acts as a safety net by combining ML predictions with physical rules. It predicts Remaining Useful Life (RUL) while blocking outputs that exceed equipment design limits.
  • The Final Guardrail: Bridges the gap between IT (Analysis) and OT (Operations). It prevents model drift and ensures an instant manual override (Failsafe) is always available.

3. Key Takeaways

The architecture centers on a “Control Trigger” that converts digital insights into physical action. By anchoring machine learning with physical laws and human experience, the system achieves a level of reliability required for mission-critical environments like data centers or industrial plants.

#AutonomousOperations #IndustrialAI #MachineLearning #SmartFactory #DataCenterManagement #PredictiveMaintenance #ControlSystems #OTSecurity #AIOps #HybridAI

With Gemini

Network Monitoring For Facilities

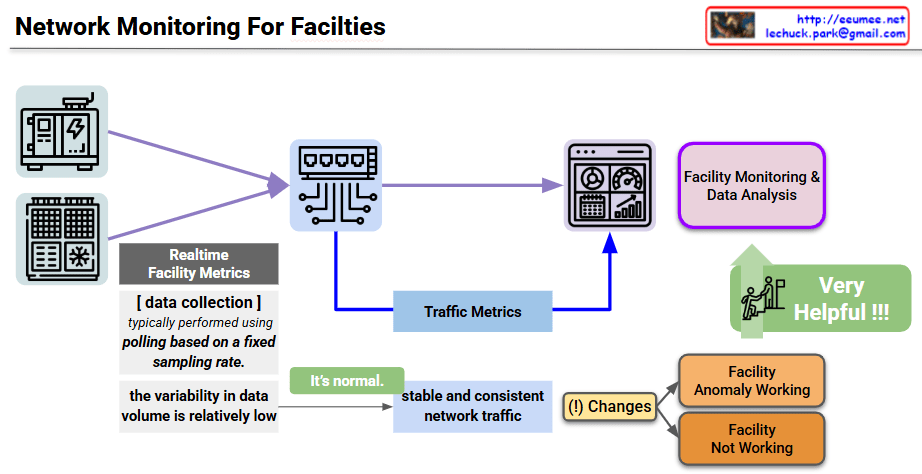
The provided image is a conceptual diagram illustrating how to monitor the status and detect anomalies in critical industrial facility infrastructure (such as power and cooling) through network traffic patterns. I also noticed the author’s information (Lechuck) in the top right corner! Let’s break down the main data flow and core ideas of your diagram step-by-step.

1. Realtime Facility Metrics

  • Target: Physical facility equipment such as generators (power infrastructure) and HVAC/cooling units.
  • Collection Method: A central monitoring server primarily uses a Polling method, requesting and receiving status data from the equipment based on a fixed sampling rate.
  • Characteristics: Because a specific amount of data is exchanged at designated times, the variability in data volume during normal operation is relatively low.

2. Traffic Metrics (Inferring Status via Traffic Characteristics)

This section contains the core insight of the diagram. Beyond just analyzing the payload of the collected sensor data, the pattern of the network traffic itself is utilized as an indicator of the facility’s health.

  • Normal State (It’s normal): When the equipment is operating normally, the network traffic occurs in a very stable and consistent manner in sync with the polling cycle.
  • Detecting Traffic Changes ((!) Changes): If a change occurs in this expected stable traffic pattern (e.g., traffic spikes, response delays, or disconnections), it is flagged as an anomaly in the facility.
  • Status Classification: Based on these abnormal traffic patterns, the system can infer whether the equipment is operating abnormally (Facility Anomaly Working) or has completely stopped functioning (Facility Not Working).

3. Facility Monitoring & Data Analysis

  • This architecture combines standard dashboard monitoring with Traffic Metrics extracted from network switches, feeding them into the data analysis system.
  • This cross-validation approach is highly effective for distinguishing between actual sensor data errors and network segment failures. As highlighted in the diagram, this ultimately improves the overall reliability of the facility monitoring system (Very Helpful !!!).

💡 Summary

This architecture presents a highly intuitive and efficient approach to data center and facility operations. By leveraging the network engineering characteristic that facility equipment communicates in regular patterns, it demonstrates an excellent monitoring logic. It allows operators to perform initial fault detection almost immediately simply by observing “changes in the consistency of network traffic,” even before conducting complex sensor data analysis.

#NetworkMonitoring #DataCenterOperations #FacilityManagement #TrafficAnalysis #AnomalyDetection #NetworkEngineering #ITInfrastructure #AIOps #SmartFacilities

With Gemini

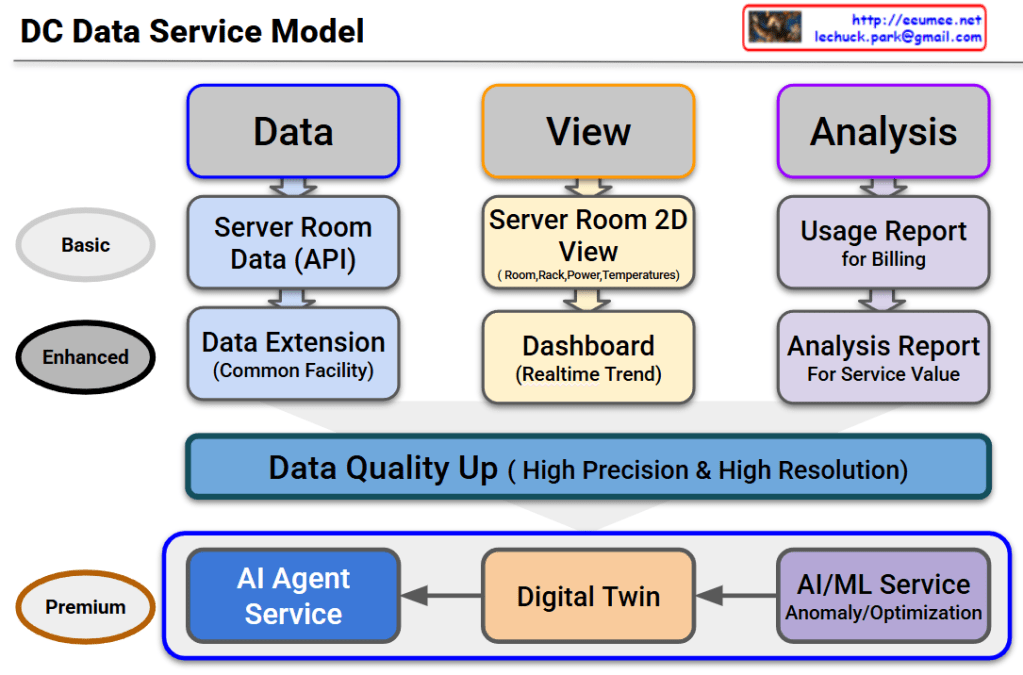
DC Data Service Model


DC Data Service Model Overview

This diagram outlines the evolutionary roadmap of a Data Center (DC) Data Service Model. It illustrates how data center operations advance from basic monitoring to a highly autonomous, AI-driven environment. The model is structured across three functional pillars—Data, View, and Analysis—and progresses through three key service tiers.

Here is a breakdown of the evolving stages:

1. Basic Tier (The Foundation)

This is the foundational level, focusing on essential monitoring and billing.

  • Data: It begins with collecting Server Room Data via APIs.
  • View: Operators use a Server Room 2D View to track basic statuses like room layouts, rack placement, power consumption, and temperatures.
  • Analysis: The collected data is used to generate a basic Usage Report, primarily for customer billing.

2. Enhanced Tier (Real-time & Expanded Scope)

This tier broadens the monitoring scope and provides deeper operational insights.

  • Data: Data collection is expanded beyond the server room to include the Common Facility (Data Extension).
  • View: The user interface upgrades to a dynamic Dashboard that displays real-time operational trends.
  • Analysis: Reporting evolves into an Analysis Report, designed to extract deeper insights and improve overall service value.

3. The Bridge: Data Quality Up

Before transitioning to the ultimate AI-driven tier, there is a critical prerequisite layer. To effectively utilize AI, the system must secure data of High Precision & High Resolution. High-quality data is the fuel for the advanced services that follow.

4. Premium Tier (AI Agent as the Ultimate Orchestrator)

This is the ultimate goal of the model. The updated diagram highlights a clear, sequential flow where each advanced technology builds upon the last, culminating in a comprehensive AI Agent Service:

  • AI/ML Service: The high-quality data is first processed here to automatically detect anomalies and calculate optimizations (e.g., maximizing cooling and power efficiency).
  • Digital Twin: The analytical insights from the AI/ML layer are then integrated into a Digital Twin—a virtual, highly accurate replica of the physical data center used for real-time simulation and spatial monitoring.
  • AI Agent Service: This is the final and most critical layer. The AI Agent does not just sit alongside the other tools; it acts as the central brain. Through this final Agent Service, the capabilities of all preceding services are expanded and put into action. By leveraging the predictive power of the AI/ML models and the comprehensive visibility of the Digital Twin, the AI Agent can autonomously manage, resolve issues, and optimize the data center, maximizing the ultimate value of the entire data pipeline.

#DataCenter #DCIM #AIAgent #DigitalTwin #MachineLearning #ITOperations #TechInfrastructure #FutureOfTech #SmartDataCenter