DC Digitalizations with ISA-95


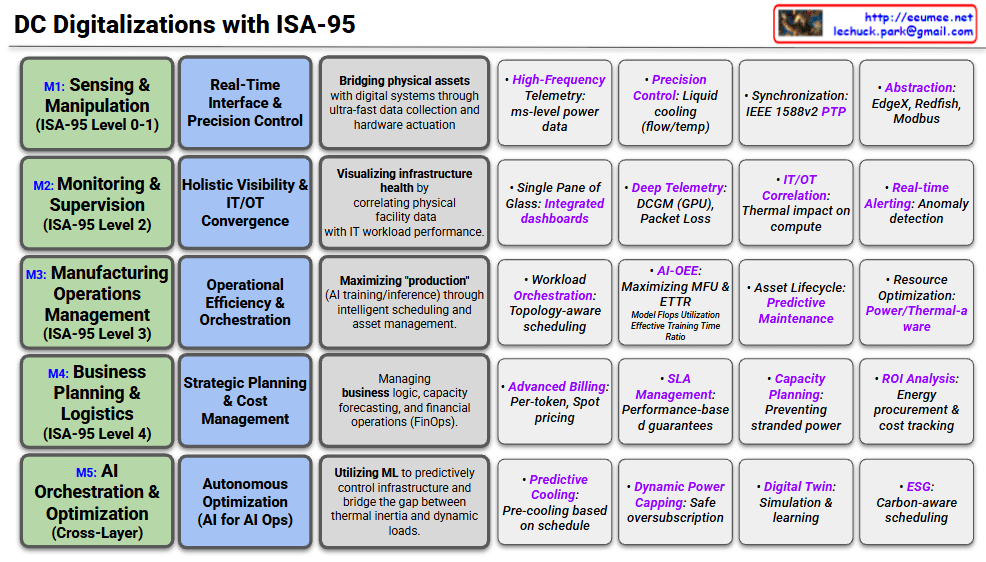
5-Layer Breakdown of DC Digitalization

M1: Sensing & Manipulation (ISA-95 Level 0-1)

  • Focus: Bridging physical assets with digital systems.
  • Key Activities: Ultra-fast data collection and hardware actuation.
  • Examples: High-frequency power telemetry (ms-level), precision liquid cooling control, and PTP (Precision Time Protocol) for synchronization.

M2: Monitoring & Supervision (ISA-95 Level 2)

  • Focus: Holistic visibility and IT/OT Convergence.
  • Key Activities: Correlating physical facility health (cooling/power) with IT workload performance.
  • Examples: Integrated dashboards (“Single Pane of Glass”), GPU telemetry via DCGM, and real-time anomaly detection.

M3: Manufacturing Operations Management (ISA-95 Level 3)

  • Focus: Operational efficiency and workload orchestration.
  • Key Activities: Maximizing “production” (AI output) through intelligent scheduling.
  • Examples: Topology-aware scheduling, AI-OEE (maximizing Model Flops Utilization), and predictive maintenance for assets.

M4: Business Planning & Logistics (ISA-95 Level 4)

  • Focus: Strategic planning, FinOps, and cost management.
  • Key Activities: Managing business logic, forecasting capacity, and financial tracking.
  • Examples: Per-token billing, SLA management with performance guarantees, and ROI analysis on energy procurement.

M5: AI Orchestration & Optimization (Cross-Layer)

  • Focus: Autonomous optimization (AI for AI Ops).
  • Key Activities: Using ML to predictively control infrastructure and bridge the gap between thermal inertia and dynamic loads.
  • Examples: Predictive cooling (cooling down before a heavy job starts), Digital Twins, and Carbon-aware scheduling (ESG).

Summary of Core Concepts

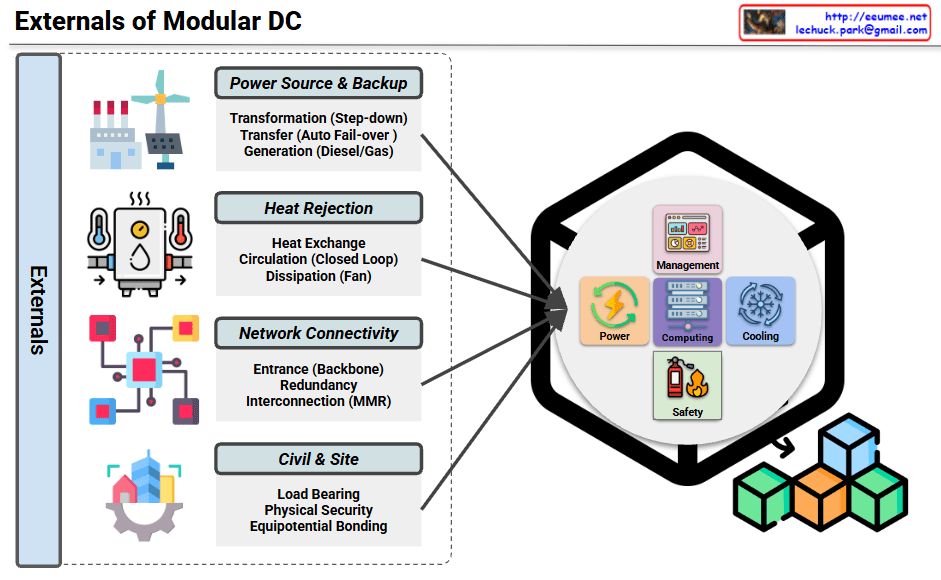
  • IT/OT Convergence: Integrating Information Technology (servers/software) with Operational Technology (power/cooling).
  • AI-OEE: Adapting the “Overall Equipment Effectiveness” metric from manufacturing to measure how efficiently a DC produces AI models.
  • Predictive Control: Moving from reactive monitoring to proactive, AI-driven management of power and heat.

#DataCenter #DigitalTransformation #ISA95 #AIOps #SmartFactory #ITOTConvergence #SustainableIT #GPUOrchestration #FinOps #LiquidCooling

With Gemini

Predictive Count/Resolve Time for .


the “Predictive Count/Resolve Time” Diagram

This diagram illustrates the workflow of IT Operations or System Maintenance, specifically comparing Predictive Maintenance (Proactive) versus Recovery/Reactive (Reactive) processes.

It is divided into two main flows: the Preventive Flow (Left) and the Reactive Flow (Right).

1. Left Flow: Predictive Maintenance

This represents the ideal process where anomalies are detected and addressed before a full system failure occurs.

  • Process:
    • Work Changes / Monitoring: Routine operations and continuous system monitoring.
    • Anomaly: The system exhibits abnormal patterns, but it hasn’t failed yet.
    • Detection (Awareness): Monitoring tools or operators detect this anomaly.
    • Predictive Maintenance: Maintenance is performed proactively to prevent the fault.
  • Key Performance Indicators (KPIs):
    • Count: The number of times predictive maintenance was performed.
    • PTM Success Rate: A metric to measure success (e.g., considered successful if no disability/failure occurs within 14 days after the predictive maintenance).

2. Right Flow: Reactive Recovery

This is the response process when an anomaly is missed, leading to an actual system failure.

  • Process:
    • Abnormal → Alert: The condition worsens, triggering an alert. The time taken to reach this point is MTTD (Mean Time To Detect).
    • Fault Down: The system actually fails or goes down.
    • Propagation Time (to Experts): The time it takes to escalate the issue to the right experts. This relates to MTTE (Mean Time To Engage Expert).
    • Recovery Time: The time taken by experts to fix the issue.
  • Key Performance Indicators (KPIs):
    • MTTR (Mean Time To Resolve/Repair): The total time from the failure (Fault Down) until the system is fully recovered. Reducing this time is a critical operational goal.

3. Summary & Key Takeaway

The diagram visually emphasizes the importance of “preventing issues before they happen (Left)” rather than “fixing them after they break (Right).”

  • Flow Logic: If an ‘Anomaly’ is successfully ‘Detected’, it leads to ‘Predictive Maintenance’. If missed, it escalates to ‘Abnormal’ and results in a ‘Fault Down’.
  • Goal: The objective is to minimize MTTR (downtime) on the right side and increase the PTM Count (proactive prevention) on the left side to ensure high system availability.

#DevOps #SRE #PredictiveMaintenance #MTTR #IncidentManagement #ITOperations #SystemMonitoring #DisasterRecovery #MTTD #TechMaintenance

With Gemini

AI GPU Cost

AI GPU Service Cost Proof

This image outlines a framework for justifying the cost of AI GPU services (such as cloud or bare-metal leasing) by strictly proving performance quality. The core theme is “Transparency with Metrics,” demonstrating Stability and Efficiency through data rather than empty promises.

Here is a breakdown of the four key quadrants:

1. Clock Speed Consistency (Top Left)

  • Metric: Stable SM (Streaming Multiprocessor) Clock.
  • Meaning: This tracks the operating frequency of the GPU’s core compute units over time.
  • Significance: The graph should ideally be a flat line. Fluctuations indicate “clock jitter,” which leads to unpredictable training times and inconsistent performance. A stable clock proves the power delivery is clean and the workload is steady.

2. Zero Throttling Events (Top Right)

  • Metric: Count of ‘SW Power Cap’ and ‘Thermal Slowdown’ events.
  • Meaning: It verifies whether the GPU had to forcibly lower its performance (throttle) due to overheating or hitting power limits.
  • Significance: The goal is Zero (0). Any positive number means the infrastructure failed to support the GPU’s maximum potential, wasting the customer’s money and time.

3. Thermal Headroom (Bottom Left)

  • Metric: Temperature Margin (vs. $T_{limit}$).
    • (Note: The text box in the image incorrectly repeats “Streaming Multiprocessor Clock Changes,” likely a copy-paste error, but the gauge clearly indicates Temperature).
  • Meaning: It displays the gap between the current operating temperature and the GPU’s thermal limit.
  • Significance: Operating with a safe margin (headroom) prevents thermal throttling and ensures hardware longevity during long-running AI workloads.

4. Power Draw vs TDP (Bottom Right)

  • Metric: Max Power Utilization vs. Thermal Design Power (TDP).
    • (Note: The text box here also appears to be a copy-paste error from the top right, but the gauge represents Power/Watts).
  • Meaning: It measures how close the actual power consumption is to the GPU’s rated maximum (TDP).
  • Significance: If the power draw is consistently close to the TDP (e.g., 700W), it proves the GPU is being fully utilized. If it’s low despite a heavy workload, it suggests a bottleneck elsewhere (network, CPU, or power delivery issues).

Summary

  1. Objective: To validate service fees by providing transparent, data-driven proof of infrastructure quality.
  2. Key Metrics: Focuses on maintaining Stable Clocks, ensuring Zero Throttling, securing Thermal Headroom, and maximizing Power Utilization.
  3. Value: It acts as a technical SLA (Service Level Agreement), assuring users that the environment allows the GPUs to perform at 100% capacity without degradation.

#AIDataCenter #GPUOptimization #ServiceLevelAgreement #CloudInfrastructure #Nvidia #HighPerformanceComputing #DataCenterOps #GreenComputing #TechTransparency #AIInfrastructure

With Gemini

Ready For AI DC


Ready for AI DC

This slide illustrates the “Preparation and Operation Strategy for AI Data Centers (AI DC).”

In the era of Generative AI and Large Language Models (LLM), it outlines the drastic changes data centers face and proposes a specific three-stage operation strategy (Digitization, Solutions, Operations) to address them.

1. Left Side: AI “Extreme” Changes

Core Theme: AI Data Center for Generative AI & LLM

  • High Cost, High Risk:
    • Establishing and operating AI DCs involves immense costs due to expensive infrastructure like GPU servers.
    • It entails high power consumption and system complexity, leading to significant risks in case of failure.
  • New Techs for AI:
    • Unlike traditional centers, new power and cooling technologies (e.g., high-density racks, immersion cooling) and high-performance computing architectures are essential.

2. Right Side: AI Operation Strategy

Three solutions to overcome the “High Cost, High Risk, and New Tech” environment.

A. Digitization (Securing Data)

  • High Precision, High Resolution: Collecting precise, high-resolution operational data (e.g., second-level power usage, chip-level temperature) rather than rough averages.
  • Computing-Power-Cooling All-Relative Data: Securing integrated data to analyze the tight correlations between IT load (computing), power, and cooling systems.

B. Solutions (Adopting Tools)

  • “Living” Digital Twin: Building a digital twin linked in real-time to the actual data center for dynamic simulation and monitoring, going beyond static 3D modeling.
  • LLM AI Agent: Introducing LLM-based AI agents to assist or automate complex data center management tasks.

C. Operations (Innovating Processes)

  • Integration for Multi/Edge(s): Establishing a unified management system that covers not only centralized centers but also distributed multi-cloud and edge locations.
  • DevOps for the Fast: Applying agile DevOps methodologies to development and operations to adapt quickly to the rapidly changing AI infrastructure.

💡 Summary & Key Takeaways

The slide suggests that traditional operating methods are unsustainable due to the costs and risks associated with AI workloads.

Success in the AI era requires precisely integrating IT and facility data (Digitization), utilizing advanced technologies like Digital Twins and AI Agents (Solutions), and adopting fast, integrated processes (Operations).


#AIDataCenter #AIDC #GenerativeAI #LLM #DataCenterStrategy #DigitalTwin #DevOps #AIInfrastructure #TechTrends #SmartOperations #EnergyEfficiency #EdgeComputing #AIInnovation

With Gemini

Externals of Modular DC

Externals of Modular DC Infrastructure

This diagram illustrates the external infrastructure systems that support a Modular Data Center (Modular DC).

Main Components

1. Power Source & Backup

  • Transformation (Step-down transformer)
  • Transfer switch (Auto Fail-over)
  • Generation (Diesel/Gas generators)

Ensures stable power supply and emergency backup capabilities.

2. Heat Rejection

  • Heat Exchange equipment
  • Circulation system (Closed Loop)
  • Dissipation system (Fan-based)

Cooling infrastructure that removes heat generated from the data center to the outside environment.

3. Network Connectivity

  • Entrance (Backbone connection)
  • Redundancy configuration
  • Interconnection (MMR – Meet Me Room)

Provides connectivity and telecommunication infrastructure with external networks.

4. Civil & Site

  • Load Bearing structures
  • Physical Security facilities
  • Equipotential Bonding

Handles building foundation and physical security requirements.

Internal Management Systems

The module integrates the following management elements:

  • Management: Integrated control system
  • Power: Power management
  • Computing: Computing resource management
  • Cooling: Cooling system control
  • Safety: Safety management

Summary

Modular data centers require four critical external infrastructure systems: power supply with backup generation, heat rejection for thermal management, network connectivity for communications, and civil/site infrastructure for physical foundation and security. These external systems work together to support the internal management components (power, computing, cooling, and safety) within the modular unit. This architecture enables rapid deployment while maintaining enterprise-grade reliability and scalability.

#ModularDataCenter #DataCenterInfrastructure #DCInfrastructure #EdgeComputing #HybridIT #DataCenterDesign #CriticalInfrastructure #PowerBackup #CoolingSystem #NetworkRedundancy #PhysicalSecurity #ModularDC #DataCenterSolutions #ITInfrastructure #EnterpriseIT

With Claude

UPS & ESS


UPS vs. ESS & Key Safety Technologies

This image illustrates the structural differences between UPS (Uninterruptible Power System) and ESS (Energy Storage System), emphasizing the advanced safety technologies required for ESS due to its “High Power, High Risk” nature.

1. Left Side: System Comparison (UPS vs. ESS)

This section contrasts the purpose and scale of the two systems, highlighting why ESS requires stricter safety measures.

  • UPS (Traditional System)
    • Purpose: Bridges the power gap for a short duration (10–30 mins) until the backup generator starts (Generator Wake-Up Time).
    • Scale: Relatively low capacity (25–500 kWh) and output (100 kW – N MW).
  • ESS (High-Capacity System)
    • Purpose: Stores energy for long durations (4+ hours) for active grid management, such as Peak Shaving.
    • Scale: Handles massive power (~100+ MW) and capacity (~400+ MWh).
    • Risk Factor: Labeled as “High Power, High Risk,” indicating that the sheer energy density makes it significantly more hazardous than UPS.

2. Right Side: 4 Key Safety Technologies for ESS

Since standard UPS technologies (indicated in gray text) are insufficient for ESS, the image outlines four critical technological upgrades (indicated in bold text).

① Battery Management System (BMS)

  • (From) Simple voltage monitoring and cut-off.
  • [To] Active Balancing & Precise State Estimation: Requires algorithms that actively balance cell voltages and accurately calculate SOC (State of Charge) and SOH (State of Health).

② Thermal Management System

  • (From) Simple air cooling or fans.
  • [To] Forced Air (HVAC) / Liquid Cooling: Due to high heat generation, robust air conditioning (HVAC) or direct Liquid Cooling systems are necessary.

③ Fire Detection & Suppression

  • (From) Detecting smoke after a fire starts.
  • [To] Off-gas Detection & Dedicated Suppression: Detects Off-gas (released before thermal runaway) to prevent fires early, using specialized suppressants like Clean Agents or Water Mist.

④ Physical/Structural Safety

  • (From) Standard metal enclosures.
  • [To] Explosion-proof & Venting Design: Enclosures must withstand explosions and safely vent gases.
  • [To] Fire Propagation Prevention: Includes fire barriers and BPU (Battery Protective Units) to stop fire from spreading between modules.

Summary

  • Scale: ESS handles significantly higher power and capacity (>400 MWh) compared to UPS, serving long-term grid needs rather than short-term backup.
  • Risk: Due to the “High Power, High Risk” nature of ESS, standard safety measures used in UPS are insufficient.
  • Solution: Advanced technologies—such as Liquid Cooling, Off-gas Detection, and Active Balancing BMS—are mandatory to ensure safety and prevent thermal runaway.

#ESS #UPS #BatterySafety #BMS #ThermalManagement #EnergyStorage #FireSafety #Engineering #TechTrends #OffGasDetection

WIth Gemini

Operations by Metrics

1. Big Data Collection & 2. Quality Verification

  • Big Data Collection: Represented by the binary data (top-left) and the “All Data (Metrics)” block (bottom-left).
  • Data Quality Verification: The collected data then passes through the checklist icon (top flow) and the “Verification (with Resolution)” step (bottom flow). This aligns with the quality verification step, including ‘resolution/performance’.

3. Change Data Capture (CDC)

  • Verified data moves to the “Change Only” stage (central pink box).
  • If there are “No Changes,” it results in “No Actions,” illustrating the CDC (Change Data Capture) concept of processing only altered data.
  • The magnifying glass icon in the top flow also visualizes this ‘change detection’ role.

4. State/Numeric Processing & 5. Analysis, Severity Definition

  • State/Numeric Processing: Once changes are detected (after the magnifying glass), the data is split into two types:
    • State Changes (ON/OFF icon): Represents changes in ‘state values’.
    • Numeric Changes (graph icon): Represents changes in ‘numeric values’.
  • Statistical Analysis & Severity Definition:
    • These changes are fed into the “Analysis” step.
    • This stage calculates the “Count of Changes” (statistics on the number of changes) and “Numeric change Diff” (amount of numeric change).
    • The analysis result leads to “Severity Tagging” to define the ‘Severity’ level (e.g., “Critical? Major? Minor?”).

6. Notification & 7. Analysis (Retrieve)

  • Notification: Once the severity is defined, the “Notification” step (bell/email icon) is triggered to alert personnel.
  • Analysis (Retrieve):
    • The notified user then performs the “Retrieve” action.
    • This final step involves querying both the changed data (CDD results) and the original data (source, indicated by the URL in the top-right) to analyze the cause.

Summary

This workflow begins with collecting and verifying all data, then uses CDC to isolate only the changes. These changes (state or numeric) are analyzed for count and difference to assign a severity level. The process concludes with notification and a retrieval step for root cause analysis.

#DataProcessing #DataMonitoring #ChangeDataCapture #CDC #DataAnalysis #SystemMonitoring #Alerting #ITOperations #SeverityAnalysis

With Gemini