CPU Again

CPU Again for AI: The Evolution of Computing Paradigms

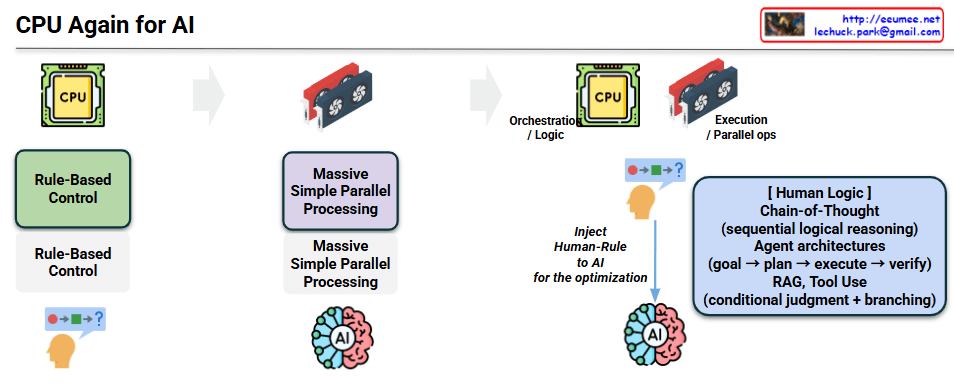
This diagram illustrates the evolutionary journey of computing architectures, highlighting why the CPU is reclaiming its pivotal role in the modern AI era. The flow is divided into three distinct phases:

1. The Era of Traditional Computing (CPU-Centric)

  • Core Concept: Rule-Based Control.
  • Mechanism: Historically, computing relied on explicit human logic. Developers hardcoded sequential rules and conditional branching (represented by the sequence 🔴 ➡️ 🟩 ➡️ ❓).
  • Role: The CPU was the undisputed core, designed specifically to handle complex control flows, logic execution, and sequential operations.

2. The Deep Learning Boom (GPU-Centric)

  • Core Concept: Massive Simple Parallel Processing.
  • Mechanism: With the rise of neural networks and deep learning, the focus shifted from complex branching logic to processing vast amounts of data simultaneously.
  • Role: The GPU took center stage. Its architecture, built for massive parallel operations, was perfectly suited for the mathematical matrix multiplications required by AI models, temporarily overshadowing the CPU’s control capabilities.

3. The Emergence of Agentic AI (CPU + GPU Synergy)

This represents the core message of the diagram. As AI systems become more sophisticated, they require more than just raw processing power; they need structured logic and control.

  • Division of Labor:
    • CPU (Orchestration / Logic): Reclaims its role as the system’s brain for control flow. It manages the overall pipeline, making conditional judgments and coordinating tasks.
    • GPU (Execution / Parallel Ops): Remains the workhorse for heavy computational lifting and model inference.
  • Injecting Human Logic: To optimize AI and make it capable of solving complex, real-world problems, we are injecting “Human-Rule” back into the system. This is achieved through advanced frameworks:
    • Chain-of-Thought: Enabling sequential, logical reasoning rather than instant, black-box outputs.
    • Agent Architectures: Implementing autonomous workflows that follow human-like cognitive steps (Goal ➡️ Plan ➡️ Execute ➡️ Verify).
    • RAG & Tool Use: Requiring conditional judgment and branching to fetch external data, trigger APIs, or utilize specific tools.

Summary

While the initial AI boom was heavily reliant on the sheer parallel processing power of GPUs, the current transition towards advanced AI Agents and RAG systems necessitates complex workflow management, conditional branching, and logical reasoning. Consequently, the CPU is once again becoming a critical component within AI architectures, serving as the essential orchestrator that guides, plans, and controls the raw execution power of the GPU.

#AIArchitecture #ComputingParadigm #AgenticAI #LLMOps #RAG #CPUvsGPU #SystemArchitecture #AIOrchestration #TechTrends

With Gemini

Universe : Connected & Changing

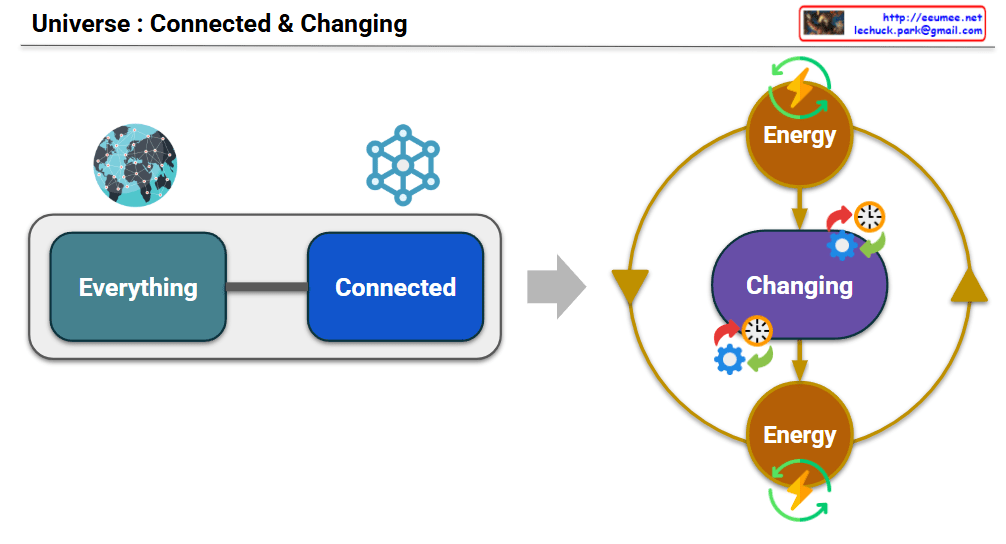
The provided image is an intuitive infographic that visualizes the fundamental operating principles of the universe and all things through two key concepts: ‘Connected’ and ‘Changing’.

Here is a detailed breakdown of how this diagram translates complex systemic concepts into a clear visual engineering illustration:

1. Left Section: The Interconnected World (Everything – Connected)

  • Meaning: It illustrates the basic premise that ‘Everything’ in the world does not exist in isolation but is intricately ‘Connected’.
  • Visual Elements: The globe covered by a network and the node structure icon at the top symbolize that not only the physical world, but all elements—including systems, infrastructure, and information—are bound together in an organic network.

2. Center Arrow: Causality (Connection -> Change)

  • Meaning: This represents that the ‘connectivity’ on the left acts as a catalyst, inevitably triggering the phenomena on the right. In other words, because everything is interconnected, interactions are bound to occur, driving the system forward to the next phase.

3. Right Section: The Cycle of Energy and Change (Energy & Changing Loop)

The right side depicts a continuous, dynamic system born from these interactions.

  • Energy: Represented by the orange circles at the top and bottom. The lightning bolt and green circular arrows signify that energy is the underlying driving force of the system—it is never destroyed but continuously flows and transforms.
  • Changing: The central purple area. It combines gear and clock icons, visually explaining that the system operates mechanically or physically upon receiving energy (gears), and its state undergoes continuous transformation over time (clock).
  • Feedback Loop (Large Yellow Arrows): Energy creates change, and that change, in turn, sustains the continuous flow of energy, forming a massive, perpetual feedback loop.

💡 Summary

This diagram effectively structures a complex systems-thinking concept from a visual engineering perspective: “Every element in the universe is connected through a massive network, forming a perpetual system where things continuously interact and change over time, driven by the flow of energy.”

#EverythingIsConnected #EnergyFlow #TechDiagram #ConceptualDesign #Connectivity

Intelligent Event Analysis Framework ( RAG Works )

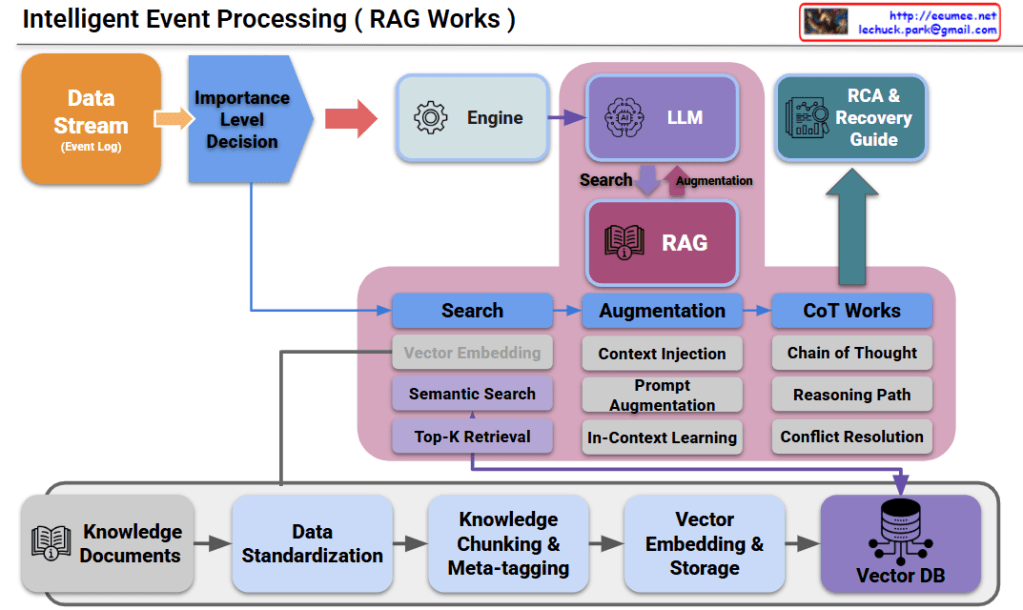
This diagram illustrates a sophisticated Intelligent Event Processing architecture that utilizes Retrieval-Augmented Generation (RAG) to transform raw system logs into actionable technical solutions.

Architecture Breakdown: Intelligent Event Processing (RAG Works)

1. Data Inflow & Prioritization

  • Data Stream (Event Log): The system captures real-time logs and events.
  • Importance Level Decision: Instead of processing every minor log, this “gatekeeper” identifies critical events, ensuring the AI engine focuses on high-priority issues.

2. The RAG Core (The Reasoning Engine)

This is the heart of the system (the pink area), where the AI analyzes the problem:

  • Search (Retrieval): The system performs a Semantic Search and Top-K Retrieval to find the most relevant technical information from the Vector DB.
  • Augmentation: It injects this retrieved context into the LLM (Large Language Model) via In-Context Learning, giving the model “temporary memory” of your specific systems.
  • CoT Works (Chain of Thought): This is the “thinking” phase. It uses a Reasoning Path to analyze the data step-by-step and performs Conflict Resolution to ensure the final answer is logically sound.

3. Knowledge Management Pipeline

The bottom section shows how the system “learns”:

  • Knowledge Documents: Technical manuals, past incident reports, and guidelines are collected.
  • Standardization & Chunking: Data is broken down into manageable “chunks” and tagged with metadata.
  • Vector DB: These chunks are converted into mathematical vectors (embeddings) and stored, allowing the engine to search for “meaning” rather than just keywords.

4. Final Output

  • RCA & Recovery Guide: The ultimate goal. The system doesn’t just say there’s an error; it provides a Root Cause Analysis (RCA) and a step-by-step Recovery Guide to help engineers fix the issue immediately.

Summary

  1. Automated Intelligence: It’s an “IT First Responder” that converts raw system noise into precise, logical troubleshooting steps.
  2. Context-Aware Analysis: By combining RAG with Chain-of-Thought reasoning, the system “reads the manual” for you to solve complex errors.
  3. Data-Driven Recovery: The workflow bridges the gap between massive event logs and actionable Root Cause Analysis (RCA) to minimize downtime.

#AIOps #RAG #LLM #GenerativeAI #SystemArchitecture #DevOps #TechInsights #RootCauseAnalysis


With Gemini

Event Processing

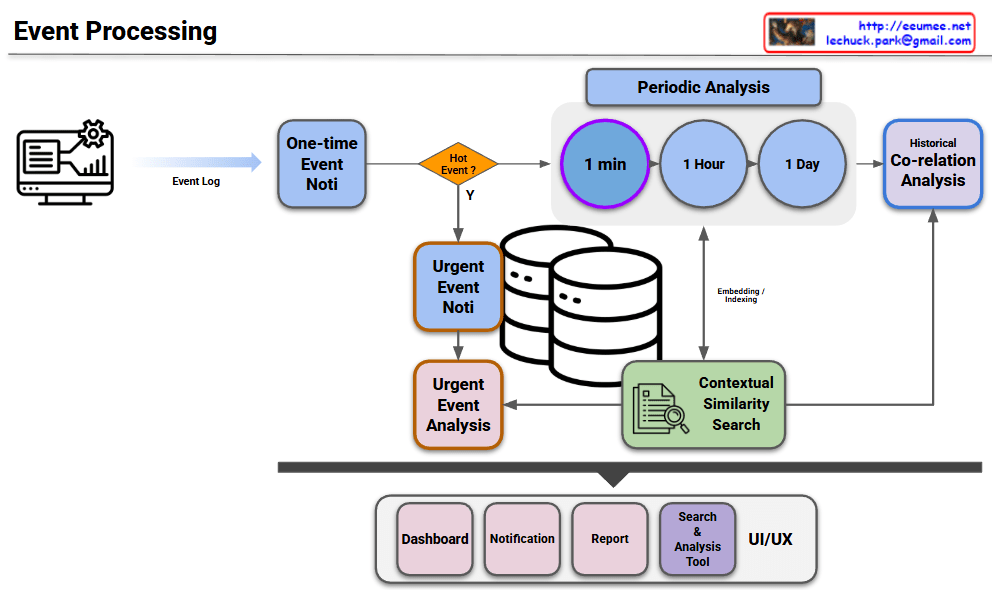
This diagram illustrates a workflow that handles system logs/events by dividing them into real-time urgent responses and periodic deep analysis.

1. Data Ingestion & Filtering

  • Event Log → One-time Event Noti: The process begins with incoming event logs triggering an initial, single-instance notification.
  • Hot Event Decision: A decision node determines if the event is critical (“Hot Event?”). This splits the workflow into two distinct paths: a Hot Path for emergencies and an Analytical Path for deeper insights.

2. Hot Path (Real-time Response)

  • Urgent Event Noti & Analysis: If identified as a “Hot Event,” the system immediately issues an urgent notification and performs an urgent analysis while persisting the data to the database. This path appears designed to minimize MTTD (Mean Time To Detect) for critical failures.

3. Periodic & Contextual Analysis (AIOps Layer)

This section indicates a shift from simple monitoring to intelligent AIOps.

  • Periodic Analysis: Events are aggregated and analyzed over fixed time windows (1 min, 1 Hour, 1 Day). The purple highlight on “1 min” suggests the current focus is on short-term trend analysis.
  • Contextual Similarity Search: This is a critical advanced feature. By explicitly mentioning “Embedding / Indexing,” the architecture suggests the use of Vector Search (likely via a Vector DB). It implies the system doesn’t just match keywords but understands the semantic context of an error to find similar past cases.
  • Historical Co-relation Analysis: This module synthesizes the periodic trends and similarity search results to correlate the current event with historical patterns, aiding in Root Cause Analysis (RCA).

4. User Interface (UI/UX)

The processed insights are delivered to the user through four channels:

  • Dashboard: High-level status visualization.
  • Notification: Alerts for urgent issues.
  • Report: Summarized periodic findings.
  • Search & Analysis Tool: A tool for granular log investigation.

Summary

  1. Hybrid Architecture: Efficiently separates critical “Hot Event” handling (Real-time) from deep “Periodic Analysis” (Batch) to balance speed and insight.
  2. Semantic Intelligence: Incorporates “Contextual Similarity Search” using Embeddings, enabling the system to identify issues based on meaning rather than just keywords.
  3. Holistic Observability: interconnected modules (Urgent, Periodic, Historical) feed into a comprehensive UI/UX to support rapid decision-making and post-mortem analysis.

#EventProcessing #SystemArchitecture #VectorSearch #Observability #RCA

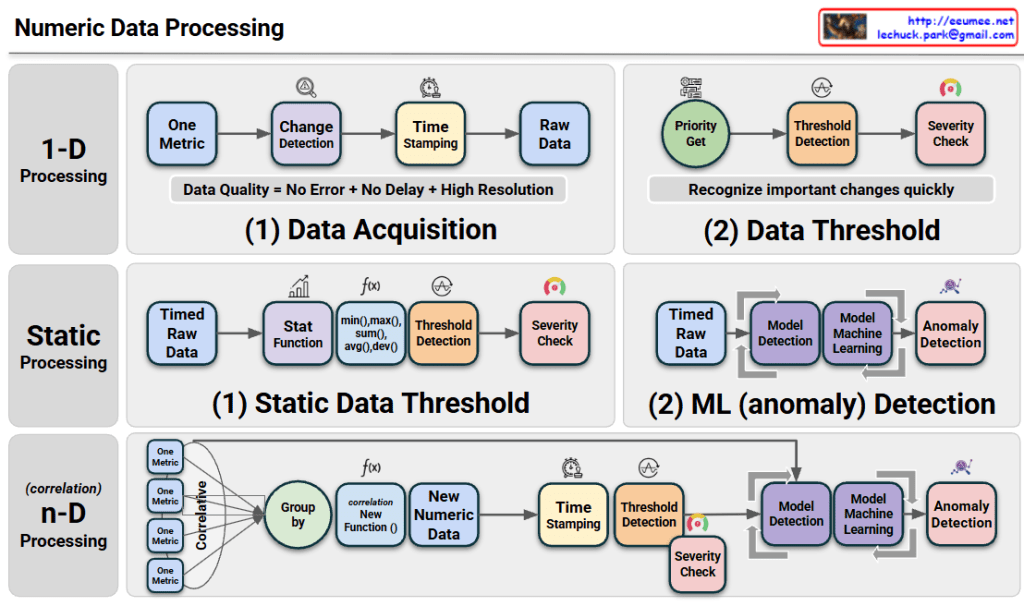
Numeric Data Processing


Architecture Overview

The diagram illustrates a tiered approach to Numeric Data Processing, moving from simple monitoring to advanced predictive analytics:

  • 1-D Processing (Real-time Detection): This layer focuses on individual metrics. It emphasizes high-resolution data acquisition with precise time-stamping to ensure data quality. It uses immediate threshold detection to recognize critical changes as they happen.
  • Static Processing (Statistical & ML Analysis): This stage introduces historical context. It applies statistical functions (like averages and deviations) to identify trends and uses Machine Learning (ML) models to detect anomalies that simple thresholds might miss.
  • n-D Processing (Correlative Intelligence): This is the most sophisticated layer. It groups multiple metrics to find correlations, creating “New Numeric Data” (synthetic metrics). By analyzing the relationship between different data points, it can identify complex root causes in highly interleaved systems.

Summary

  1. The framework transitions from reactive 1-D monitoring to proactive n-D correlation, enhancing the depth of system observability.
  2. It integrates statistical functions and machine learning to filter noise and identify true anomalies based on historical patterns rather than just fixed limits.
  3. The ultimate goal is to achieve high-fidelity data processing that enables automated severity detection and complex pattern recognition across multi-dimensional datasets.

#DataProcessing #AIOps #MachineLearning #Observability #Telemetry #SystemArchitecture #AnomalyDetection #DigitalTwin #DataCenterOps #InfrastructureMonitoring

With Gemini