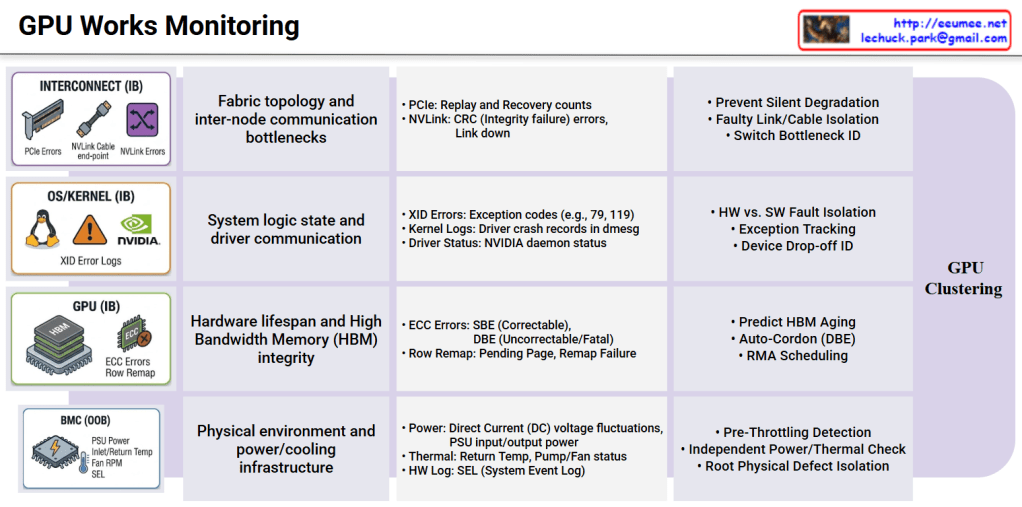
1. The Physical Infrastructure Defense Line (BMC / Out-of-Band)
This is the foundational layer that preemptively monitors the physical environmental limits at the chassis level through a microcontroller (BMC), operating completely independently of the OS or kernel state.
- Technical Significance: High-density GPU systems are highly sensitive to power spikes and cooling degradation. Before the OS triggers GPU throttling to protect the hardware, this layer must catch anomalies like high-voltage distribution fluctuations or rising return temperatures in liquid/air cooling systems via the System Event Log (SEL).
- Fault Isolation: It narrows down the root cause by isolating purely physical infrastructure factors—such as “insufficient power supply” or “thermal limits”—before any software-level performance analysis begins.
2. The Hardware Integrity Layer (GPU / In-Band)
This layer tracks the physical aging and data corruption of the High Bandwidth Memory (HBM) and compute cores directly at the chip level, utilizing tools like DCGM (Data Center GPU Manager).
- Technical Significance: While Single Bit Errors (SBE) within the HBM are auto-correctable, their accumulation strongly indicates memory component aging. Conversely, uncorrectable Double Bit Errors (DBE) or Row Remapping failures due to depleted spare memory banks signify an immediate, fatal interruption to the workload.
- Fault Isolation: These metrics serve as definitive evidence to immediately isolate (cordon/drain) the affected node from the training cluster and initiate a Return Merchandise Authorization (RMA) with the hardware vendor.
3. The System Logic & Driver Layer (OS/Kernel / In-Band)
This is the logical debugging domain that analyzes the communication state between the NVIDIA device drivers and the Linux kernel, primarily tracking dmesg and XID error logs.
- Technical Significance: It is crucial to clearly distinguish between software-level crashes caused by user applications (e.g., memory leaks, infinite loops, segfaults) and physical communication disconnections where the GPU stops responding and drops off the PCIe bus (Device Drop-off).
- Fault Isolation: By separating pure user workload bugs from actual physical device communication failures, this layer eliminates time wasted on unnecessary hardware replacements or node reboots.
4. The Interconnect & Fabric Layer (Interconnect / In-Band)
In a scale-out environment extending beyond a single node, this layer monitors the high-speed data highway for communication bottlenecks.
- Technical Significance: During large-scale distributed training, a single poor PCIe slot connection or an NVLink CRC integrity check failure can drastically plummet the bandwidth of the entire ring topology. These issues do not crash the system or spit out fatal errors, making them the primary culprits of “Silent Performance Degradation.”
- Fault Isolation: By tracking PCIe Replay and NVLink Recovery counts in real-time, it pinpoints the exact faulty cables, switch ports, or riser cards causing excessive packet retransmissions among thousands of connections.
Architectural Conclusion
Ultimately, when faced with the single symptom of “a specific node’s computation has slowed down,” you can only pinpoint the true root cause by cross-analyzing Redfish API-based Out-of-Band telemetry with DCGM/dmesg-based In-Band telemetry in real-time.
Moving beyond simple monitoring dashboards, integrating these complex telemetry data streams into an LLM and RAG-based automated agent will serve as a powerful tool to drastically reduce MTTR without requiring manual administrator intervention.
#AIDataCenter #GPUCluster #Telemetry #RootCauseAnalysis #BMC #NVIDIA #DCGM #NVLink #AIOps #InfrastructureAsCode #DataCenterManagement
With Gemini
 Lechuck Park