DynamoLLM

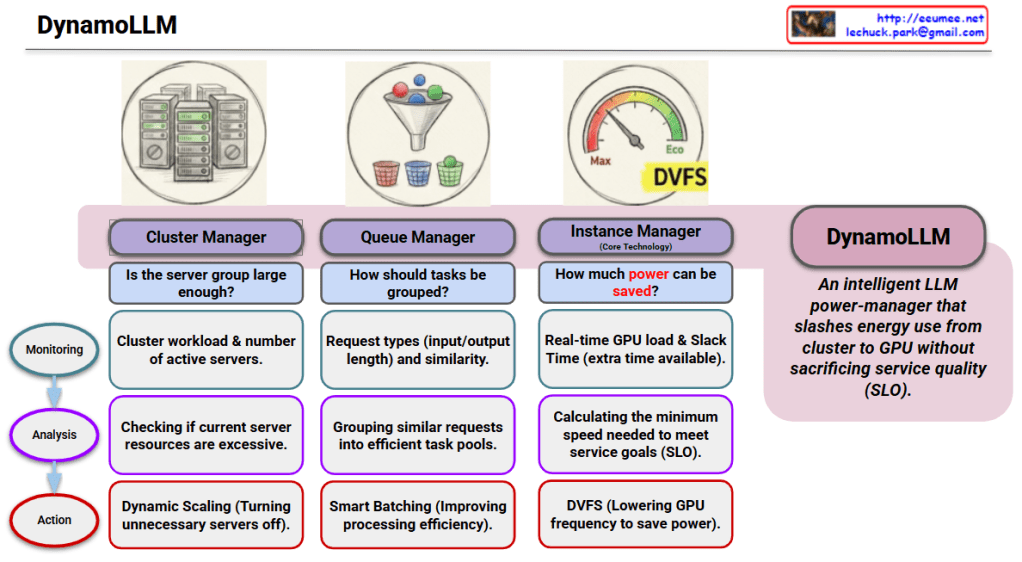
The provided infographic illustrates DynamoLLM, an intelligent power-saving framework specifically designed for operating Large Language Models (LLMs). Its primary mission is to minimize energy consumption across the entire infrastructure—from the global cluster down to individual GPU nodes—while strictly maintaining Service Level Objectives (SLO).


## 3-Step Intelligent Power Saving

1. Cluster Manager (Infrastructure Level)

This stage ensures that the overall server resources match the actual demand to prevent idle waste.

  • Monitoring: Tracks the total cluster workload and the number of currently active servers.
  • Analysis: Evaluates if the current server group is too large or if resources are excessive.
  • Action: Executes Dynamic Scaling by turning off unnecessary servers to save power at the fleet level.

2. Queue Manager (Workload Level)

This stage organizes incoming requests to maximize the efficiency of the processing phase.

  • Monitoring: Identifies request types (input/output token lengths) and their similarities.
  • Analysis: Groups similar requests into efficient “task pools” to streamline computation.
  • Action: Implements Smart Batching to improve processing efficiency and reduce operational overhead.

3. Instance Manager (GPU Level)

As the core technology, this stage manages real-time power at the hardware level.

  • Monitoring: Observes real-time GPU load and Slack Time (the extra time available before a deadline).
  • Analysis: Calculates the minimum processing speed required to meet the service goals (SLO) without over-performing.
  • Action: Utilizes DVFS (Dynamic Voltage and Frequency Scaling) to lower GPU frequency and minimize power draw.

# Summary

  1. DynamoLLM is an intelligent framework that minimizes LLM energy use across three layers: Cluster, Queue, and Instance.
  2. It maintains strict service quality (SLO) by calculating the exact performance needed to meet deadlines without wasting power.
  3. The system uses advanced techniques like Dynamic Scaling and DVFS to ensure GPUs only consume as much energy as a task truly requires.

#DynamoLLM #GreenAI #LLMOps #EnergyEfficiency #GPUOptimization #SustainableAI #CloudComputing

With Gemini

Proactive Cooling

The provided image illustrates the fundamental shift in data center thermal management from traditional Reactive methods to AI-driven Proactive strategies.


1. Comparison of Control Strategies

The slide contrasts two distinct approaches to managing the cooling load in a high-density environment, such as an AI data center.

FeatureReactive (Traditional)Proactive (Advanced)
PhilosophyAct After: Responds to changes.Act Before: Anticipates changes.
MechanismPID Control: Proportional-Integral-Derivative.MPC: Model Predictive Control.
ScopeLocal Control: Focuses on individual units/sensors.Central ML Control: Data-driven, system-wide optimization.
LogicFeedback-based (error correction).Feedforward-based (predictive modeling).

2. Graph Analysis: The “Sensing & Delay” Factor

The graph on the right visualizes the efficiency gap between these two methods:

  • Power (Red Line): Represents the IT load or power consumption which generates heat.
  • Sensing & Delay: There is a temporal gap between when a server starts consuming power and when the cooling system’s sensors detect the temperature rise and physically ramp up the fans or chilled water flow.
  • Reactive Cooling (Dashed Blue Line): Because it “acts after,” the cooling response lags behind the power curve. This often results in thermal overshoot, where the hardware momentarily operates at higher temperatures than desired, potentially triggering throttling.
  • Proactive Cooling (Solid Blue Line): By using Model Predictive Control (MPC), the system predicts the impending power spike. It initiates cooling before the heat is fully sensed, aligning the cooling curve more closely with the power curve to maintain a steady temperature.

3. Technical Implications for AI Infrastructure

In modern data centers, especially those handling fluctuating AI workloads (like LLM training or high-concurrency inference), the “Sensing & Delay” in traditional PID systems can lead to significant energy waste and hardware stress. MPC leverages historical data and real-time telemetry to:

  1. Reduce PUE (Power Usage Effectiveness): By avoiding over-cooling and sudden spikes in fan power.
  2. Improve Reliability: By maintaining a constant thermal envelope, reducing mechanical stress on chips.
  3. Optimize Operational Costs: Through centralized, intelligent resource allocation.

Summary

  1. Proactive Cooling utilizes Model Predictive Control (MPC) and Machine Learning to anticipate heat loads before they occur.
  2. Unlike traditional PID systems that respond to temperature errors, MPC eliminates the Sensing & Delay lag by acting on predicted power spikes.
  3. This shift enables superior energy efficiency and thermal stability, which is critical for high-density AI data center operations.

#DataCenter #AICooling #ModelPredictiveControl #MPC #ThermalManagement #EnergyEfficiency #SmartInfrastructure #PUEOptimization #MachineLearning

With Gemini

AI-Driven Proactive Cooling Architecture

The provided image illustrates an AI-Driven Proactive Cooling Architecture, detailing a sophisticated pipeline that transforms operational data into precise thermal management.


1. The Proactive Data Hierarchy

The architecture categorizes data sources along a spectrum, moving from “More Proactive” (predicting future heat) to “Reactive” (measuring existing heat).

  • LLM Job Schedule (Most Proactive): This layer looks at the job queue, node thermal headroom, and resource availability. It allows the system to prepare for heat before the first calculation even begins.
  • LLM Workload: Monitors real-time GPU utilization (%) and token throughput to understand the intensity of the current processing task.
  • GPU / HBM: Captures direct hardware telemetry, including GPU power draw (Watts) and High Bandwidth Memory (HBM) temperatures.
  • Server Internal Temperature: Measures the junction temperature, fan/pump speeds, and the $\Delta T$ (temperature difference) between server inlet and outlet.
  • Floor & Rack Temperature (Reactive): The traditional monitoring layer that identifies hot spots and rack density (kW) once heat has already entered the environment.

2. The Analysis and Response Loop

The bottom section of the diagram shows how this multi-layered data is converted into action:

  • Gathering Data: Telemetry from all five layers is aggregated into a central repository.
  • Analysis with ML: A Machine Learning engine processes this data to predict thermal trends. It doesn’t just look at where the temperature is now, but where it will be in the next few minutes based on the workload.
  • Cooling Response: The ML insights trigger physical adjustments in the cooling infrastructure, specifically controlling the $\Delta T$ (Supply/Return) and Flow Rate (LPM – Liters Per Minute) of the coolant.

3. Technical Significance

By shifting the control logic “left” (toward the LLM Job Schedule), data centers can eliminate the thermal lag inherent in traditional systems. This is particularly critical for AI infrastructure, where GPU power consumption can spike almost instantaneously, often faster than traditional mechanical cooling systems can ramp up.


Summary

  1. This architecture shifts cooling from a reactive sensor-based model to a proactive workload-aware model using AI/ML.
  2. It integrates data across the entire stack, from high-level LLM job queues down to chip-level GPU power draw and rack temperatures.
  3. The ML engine predicts thermal demand to dynamically adjust coolant flow rates and supply temperatures, significantly improving energy efficiency and hardware longevity.

#AICooling #DataCenterInfrastructure #ProactiveCooling #GPUManagement #LiquidCooling #LLMOps #ThermalManagement #EnergyEfficiency #SmartDC

With Gemini

Peak Shaving with Data

Graph Interpretation: Power Peak Shaving in AI Data Centers

This graph illustrates the shift in power consumption patterns from traditional data centers to AI-driven data centers and the necessity of “Peak Shaving” strategies.

1. Standard DC (Green Line – Left)

  • Characteristics: Shows “Stable” power consumption.
  • Interpretation: Traditional server workloads are relatively predictable with low volatility. The power demand stays within a consistent range.

2. Training Job Spike (Purple Line – Middle)

  • Characteristics: Significant fluctuations labeled “Peak Shaving Area.”
  • Interpretation: During AI model training, power demand becomes highly volatile. The spikes (peaks) and valleys represent the intensive GPU cycles required during training phases.

3. AI DC & Massive Job Starting (Red Line – Right)

  • Characteristics: A sharp, vertical-like surge in power usage.
  • Interpretation: As massive AI jobs (LLM training, etc.) start, the power load skyrockets. The graph shows a “Pre-emptive Analysis & Preparation” phase where the system detects the surge before it hits the maximum threshold.

4. ESS Work & Peak Shaving (Purple Dotted Box – Top Right)

  • The Strategy: To handle the “Massive Job Starting,” the system utilizes ESS (Energy Storage Systems).
  • Action: Instead of drawing all power from the main grid (which could cause instability or high costs), the ESS discharges stored energy to “shave” the peak, smoothing out the demand and ensuring the AI DC operates safely.

Summary

  1. Volatility Shift: AI workloads (GPU-intensive) create much more extreme and unpredictable power spikes compared to standard data center operations.
  2. Proactive Management: Modern AI Data Centers require pre-emptive detection and analysis to prepare for sudden surges in energy demand.
  3. ESS Integration: Energy Storage Systems (ESS) are critical for “Peak Shaving,” providing the necessary power buffer to maintain grid stability and cost efficiency.

#DataCenter #AI #PeakShaving #EnergyStorage #ESS #GPU #PowerManagement #SmartGrid #TechInfrastructure #AIDC #EnergyEfficiency

with Gemini

Peak Shaving


“Power – Peak Shaving” Strategy

The image illustrates a 5-step process for a ‘Peak Shaving’ strategy designed to maximize power efficiency in data centers. Peak shaving is a technique used to reduce electrical load during periods of maximum demand (peak times) to save on electricity costs and ensure grid stability.

1. IT Load & ESS SoC Monitoring

This is the data collection and monitoring phase to understand the current state of the system.

  • Grid Power: Monitoring the maximum power usage from the external power grid.
  • ESS SoC/SoH: Checking the State of Charge (SoC) and State of Health (SoH) of the Energy Storage System (ESS).
  • IT Load (PDU): Measuring the actual load through Power Distribution Units (PDUs) at the server rack level.
  • LLM/GPU Workload: Monitoring the real-time workload of AI models (LLM) and GPUs.

2. ML-based Peak Prediction

Predicting future power demand based on the collected data.

  • Integrated Monitoring: Consolidating data from across the entire infrastructure.
  • Machine Learning Optimization: Utilizing AI algorithms to accurately predict when power peaks will occur and preparing proactive responses.

3. Peak Shaving Via PCS (Power Conversion System)

Utilizing physical energy storage hardware to distribute the power load.

  • Pre-emptive Analysis & Preparation: Determining the “Time to Charge.” The system charges the batteries when electricity rates are low.
  • ESS DC Power: During peak times, the stored Direct Current (DC) in the ESS is converted to Alternating Current (AC) via the PCS to supplement the power supply, thereby reducing reliance on the external grid.

4. Job Relocation (K8s/Slurm)

Adjusting the scheduling of IT tasks based on power availability.

  • Scheduler Decision Engine: Activated when a peak time is detected or when ESS battery levels are low.
  • Job Control: Lower priority jobs are queued or paused, and compute speeds are throttled (power suppressed) to minimize consumption.

5. Parameter & Model Optimization

The most advanced stage, where the efficiency of the AI models themselves is optimized.

  • Real-time Batch Size Adjustment: Controlling throughput to prevent sudden power spikes.
  • Large Model -> sLLM (Lightweight): Transitioning to smaller, lightweight Large Language Models (sLLM) to reduce GPU power consumption without service downtime.

Summary

The core message of this diagram is that High-Quality/High-Resolution Data is the foundation for effective power management. By combining hardware solutions (ESS/PCS), software scheduling (K8s/Slurm), and AI model optimization (sLLM), a data center can significantly reduce operating expenses (OPEX) and ultimately increase profitability (Make money) through intelligent peak shaving.


#AI_DC #PowerControl #DataCenter #EnergyEfficiency #PeakShaving #GreenIT #MachineLearning #ESS #AIInfrastructure #GPUOptimization #Sustainability #TechInnovation

Next AI Computing


The Evolution of AI Computing

The provided images illustrate the architectural shift in AI computing from the traditional “Separation” model to a “Unified” brain-inspired model, focusing on overcoming energy inefficiency and data bottlenecks.

1. CURRENT: The Von Neumann Wall (Separation)

  • Status: The industry standard today.
  • Structure: Computation (CPU/GPU) and Memory (DRAM) are physically separate.
  • Problem: Constant data movement between components creates a “Von Neumann Wall” (bottleneck).
  • Efficiency: Extremely wasteful; 60-80% of energy is consumed just moving data, not processing it.

2. BRIDGE: Processing-In-Memory (PIM) (Proximity)

  • Status: Practical, near-term solution; nearly commercial-ready.
  • Structure: Small processing units are embedded inside the memory.
  • Benefit: Processes data locally to provide a 2-10x efficiency boost.
  • Primary Use: Ideal for accelerating Large Language Models (LLMs).

3. FUTURE: Neuromorphic Computing (Unity)

  • Status: Future-oriented paradigm shift.
  • Structure: Compute IS memory, mimicking the human brain’s architecture where memory elements perform calculations.
  • Benefit: Eliminates data travel entirely, promising a massive 1,000x+ energy improvement.
  • Requirement: Requires a complete overhaul of current software stacks.
  • Primary Use: Ultra-low power Edge devices and Robotics.

#AIComputing #NextGenAI #VonNeumannWall #PIM #ProcessingInMemory #NeuromorphicComputing #EnergyEfficiency #LLM #EdgeAI #Semiconductor #FutureTech #ComputerArchitecture

With Gemini

Redfish for AI DC

This image illustrates the pivotal role of the Redfish API (developed by DMTF) as the standardized management backbone for modern AI Data Centers (AI DC). As AI workloads demand unprecedented levels of power and cooling, Redfish moves beyond traditional server management to provide a unified framework for the entire infrastructure stack.


1. Management & Security Framework (Left Column)

  • Unified Multi-Vendor Management:
    • Acts as a single, standardized API to manage diverse hardware from different vendors (NVIDIA, AMD, Intel, etc.).
    • It reduces operational complexity by replacing fragmented, vendor-specific IPMI or OEM extensions with a consistent interface.
  • Modern Security Framework:
    • Designed for multi-tenant AI environments where security is paramount.
    • Supports robust protocols like session-based authentication, X.509 certificates, and RBAC (Role-Based Access Control) to ensure only authorized entities can modify critical infrastructure.
  • Precision Telemetry:
    • Provides high-granularity, real-time data collection for voltage, current, and temperature.
    • This serves as the foundation for energy efficiency optimization and fine-tuning performance based on real-time hardware health.

2. Infrastructure & Hardware Control (Right Column)

  • Compute / Accelerators:
    • Enables per-GPU instance power capping, allowing operators to limit power consumption at a granular level.
    • Monitors the health of high-speed interconnects like NVLink and PCIe switches, and simplifies firmware lifecycle management across the cluster.
  • Liquid Cooling:
    • As AI chips run hotter, Redfish integrates with CDU (Cooling Distribution Unit) systems to monitor pump RPM and loop pressure.
    • It includes critical safety features like leak detection sensors and integrated event handling to prevent hardware damage.
  • Power Infrastructure:
    • Extends management to the rack level, including Smart PDU outlet metering and OCP (Open Compute Project) Power Shelf load balancing.
    • Facilitates advanced efficiency analytics to drive down PUE (Power Usage Effectiveness).

Summary

For an AI DC Optimization Architect, Redfish is the essential “language” that enables Software-Defined Infrastructure. By moving away from manual, siloed hardware management and toward this API-driven approach, data centers can achieve the extreme automation required to shift OPEX structures predominantly toward electricity costs rather than labor.

#AIDataCenter #RedfishAPI #DMTF #DataCenterInfrastructure #GPUComputing #LiquidCooling #SustainableIT #SmartPDU #OCP #InfrastructureAutomation #TechArchitecture #EnergyEfficiency


With Gemini