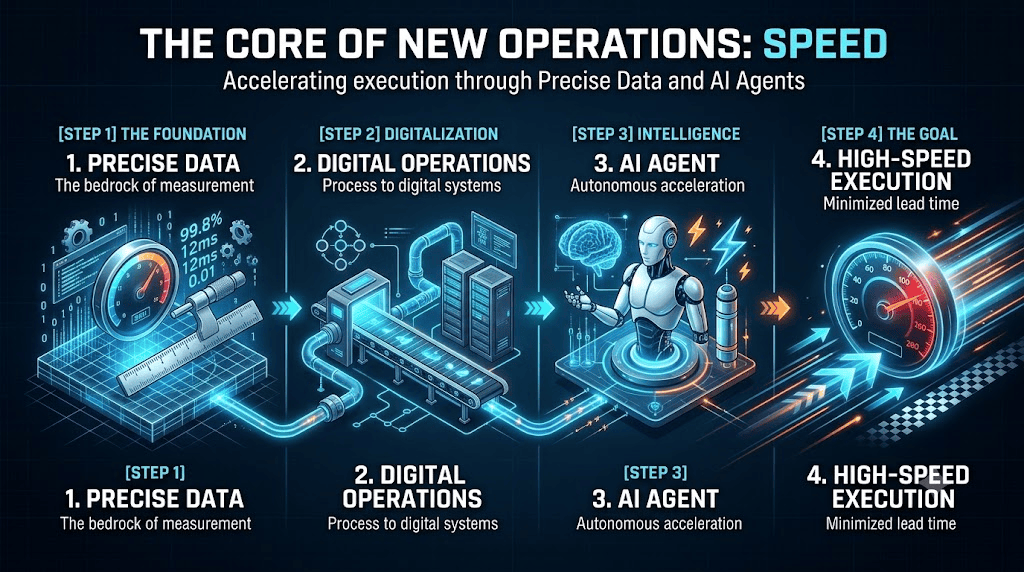
This image is a futuristic, high-tech 3D infographic titled “THE CORE OF NEW OPERATIONS: SPEED”, with the subtitle “Accelerating execution through Precise Data and AI Agents.”
It illustrates a progressive, four-step operational workflow designed to achieve maximum operational speed, moving from left to right along a connected digital pipeline on a dark, blueprint-like background with glowing blue, cyan, and orange accents.
Detailed Step-by-Step Breakdown:
- [STEP 1] THE FOUNDATION: 1. PRECISE DATA (“The bedrock of measurement”) On the far left, the process begins on a glowing 3D digital grid, representing the “bedrock of measurement.” This step is visualized with precise instrumentation, including a digital gauge, a micrometer (ruler), cascading binary code (0s and 1s), and floating metrics like “99.8%”, “12ms”, and “0.01”. These elements emphasize that exact, granular numbers are the essential starting point for any optimized system.
- [STEP 2] DIGITALIZATION: 2. DIGITAL OPERATIONS (“Process to digital systems”) Connected by a glowing pipeline, the second step transforms raw data into structured digital workflows. It is represented by automated smart conveyor belts, pipelines, and server racks. A digital node/process flowchart icon sits above, visualizing how traditional operational processes are converted into transparent, connected, and measurable digital systems.
- [STEP 3] INTELLIGENCE: 3. AI AGENT (“Autonomous acceleration”) The flow moves further right into the intelligence phase, symbolized by a futuristic humanoid AI robot emerging from a circular holographic platform alongside a glowing digital brain. Lightning bolts, sparks, and data nodes signify the cognitive power of AI. This step represents AI Agents autonomously analyzing, optimizing, and executing the digitized workflows at scale without human bottleneck.
- [STEP 4] THE GOAL: 4. HIGH-SPEED EXECUTION (“Minimized lead time”) The pipeline culminates on the far right in a burst of speed and energy, illustrating the ultimate goal: “Minimized lead time.” It features a glowing speedometer pushing into the high-performance red zone, accompanied by dynamic, forward-rushing motion blur arrows and a checkered pattern. This final stage vividly demonstrates how the combination of data, digitalization, and AI achieves unprecedented operational speed.
SUMMARY
The infographic successfully communicates that Operational Speed is not achieved by simply working faster, but through a structured evolution: establishing Precise Data as the foundation, converting workflows into Digital Operations, and amplifying them with AI Agents to eliminate friction and achieve High-Speed Execution.
#Operations #BusinessTransformation #DigitalTransformation #AIAgent #DataDriven #Automation #OperationalExcellence #AI #WorkflowOptimization #FutureOfWork #TechInfographic #ProcessAutomation #DataAnalytics #BizTech
With Gemini