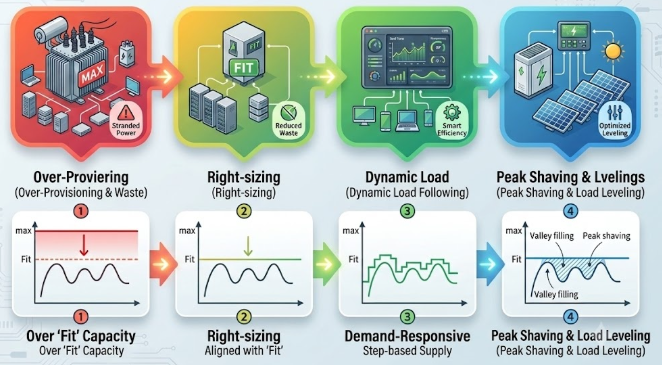
This image illustrates the evolution of power supply optimization across four progressive stages, moving from basic over-provisioning to advanced load leveling, using intuitive graphics and charts.
- Stage 1: Over-Provisioning & Waste
- This represents an inefficient initial state where power is supplied at a maximum capacity (MAX) that far exceeds the actual wavy demand curve. A large gap exists, resulting in significant “Stranded Power” and massive energy waste.
- Stage 2: Right-sizing
- The baseline for the continuous power supply is lowered (↓) to align exactly with the peak of the actual demand curve (Fit). This eliminates massive over-provisioning and ensures “Reduced Waste,” though some unused capacity still remains during off-peak periods.
- Stage 3: Dynamic Load Following
- Through real-time monitoring and dashboards, the power supply becomes demand-responsive, adjusting in a step-based manner to closely track fluctuations in power usage. The supply line tightly wraps around the demand curve, achieving “Smart Efficiency.”
- Stage 4: Peak Shaving & Load Leveling
- The ultimate optimization stage utilizes resources like solar panels and battery storage systems to completely flatten the grid draw into a straight line. It discharges stored energy during high-demand periods (“Peak shaving”) and stores energy during low-demand periods (“Valley filling”), achieving fully “Optimized Leveling.”
💡 Summary
This diagram visualizes the maturity journey of energy management: transitioning from a traditional over-provisioned power architecture, advancing through data-driven dynamic load tracking, and ultimately arriving at a perfectly balanced grid draw through peak shaving and energy storage integration.
#EnergyEfficiency #SmartGrid #PeakShaving #PowerOptimization #DynamicLoadFollowing #InfrastructureDesign #LoadLeveling
With Gemini

