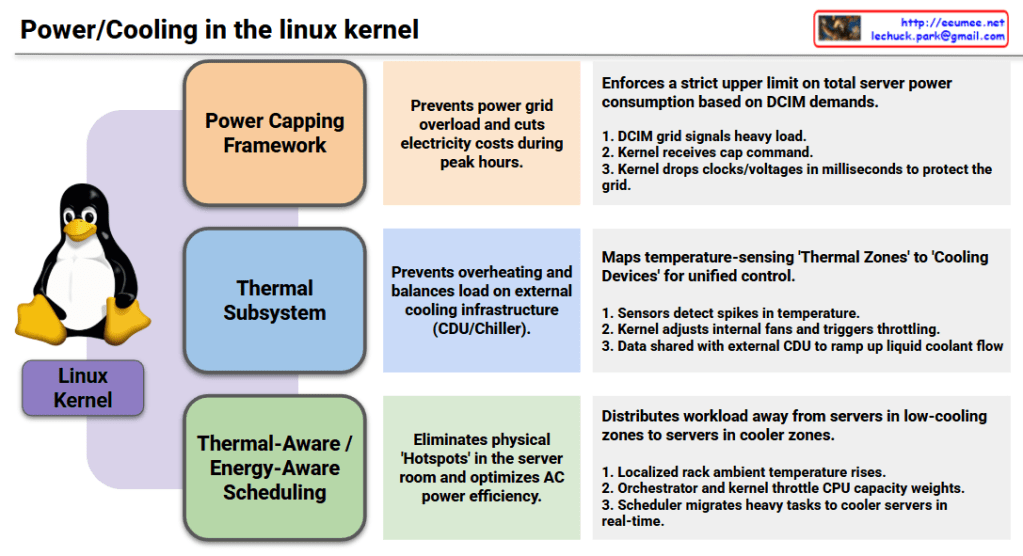
Objective (Center): Prevents power grid overload and cuts electricity costs during peak hours.
Mechanism (Right): Enforces a strict upper limit on total server power consumption based on DCIM (Datacenter Infrastructure Management) demands.
The DCIM grid signals a heavy load status.
The Linux kernel receives the specific power capping command.
The kernel immediately drops processor clocks and voltages in milliseconds to protect the local power grid.
2. Thermal Subsystem
Objective (Center): Prevents hardware overheating and balances the load on external cooling infrastructure, such as Coolant Distribution Units (CDUs) and chillers.
Mechanism (Right): Maps temperature-sensing ‘Thermal Zones’ directly to hardware ‘Cooling Devices’ for unified, holistic control.
Hardware sensors detect sudden spikes in internal temperature.
The kernel dynamically adjusts internal server fans and triggers safety throttling.
Temperature telemetry data is actively shared with the external datacenter CDU to ramp up liquid coolant flow rates.
3. Thermal-Aware / Energy-Aware Scheduling
Objective (Center): Eliminates physical ‘Hotspots’ within the server room layout and optimizes overall air conditioning (AC) power efficiency.
Mechanism (Right): Distributes heavy workloads away from physical servers trapped in low-cooling zones to servers located in cooler zones.
The localized ambient temperature around a specific server rack rises.
The datacenter orchestrator and the kernel work together to throttle the target CPU’s capacity weights.
The Linux scheduler automatically migrates heavy compute tasks to cooler servers across the room in real-time.
Modern Linux has evolved beyond managing isolated servers; it now acts as a holistic orchestrator that treats the datacenter’s power grid, liquid cooling loops, and air conditioning as a single, unified organism.
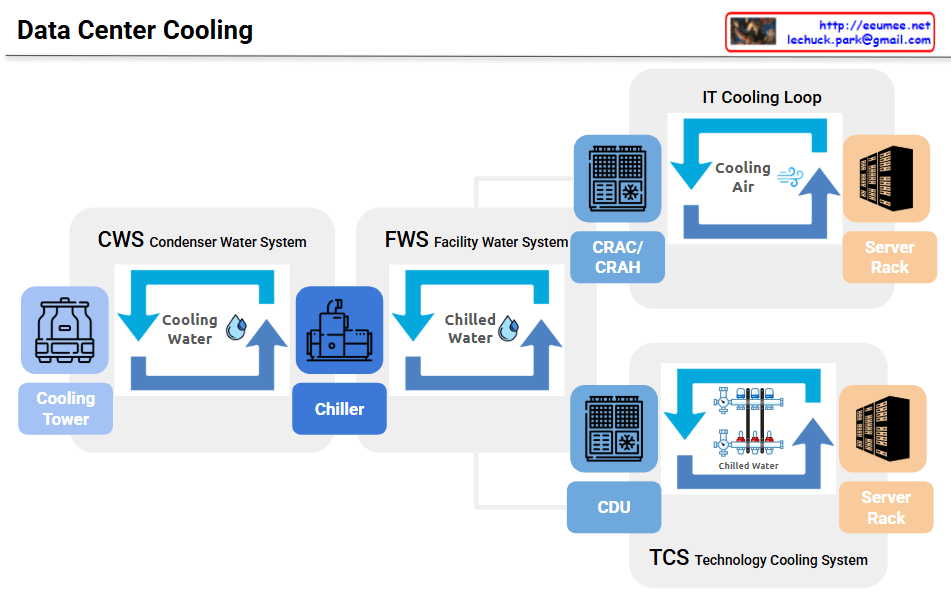
This diagram illustrates a hybrid Data Center Cooling Architecture, depicting how a facility manages thermal loads by combining traditional air cooling with advanced liquid cooling. The system is designed to support both standard infrastructure and high-density compute environments (such as AI clusters) simultaneously.
The left and center sections of the diagram represent the foundational facility water loops that capture and reject heat from the entire data center.
CWS (Condenser Water System): This is the heat rejection loop on the far left. Cooling Water circulates between the Chiller and the external Cooling Tower. The heat absorbed by the chiller from the facility’s interior is transferred to this loop and evaporated into the atmosphere via the cooling tower.
Chiller: Acts as the central refrigeration unit. It sits between the CWS and FWS, performing the critical energy transfer that cools the facility’s internal water supply.
FWS (Facility Water System): This is the internal primary loop. It circulates Chilled Water produced by the chiller throughout the building. As shown by the split branching lines on the right, this single FWS loop serves as the shared cold utility source for both cooling methodologies.
2. Dual-Path IT Heat Dissipation (Secondary Loops)
The FWS branches into two distinct pathways to accommodate different server densities and infrastructure types:
A. Air Cooling Pathway (Top Right)
Components:CRAC/CRAH (Computer Room Air Conditioner / Computer Room Air Handling unit) & IT Cooling Loop.
Mechanism: Chilled water from the FWS flows into the CRAC/CRAH units. Fans blow air over the chilled coils, generating Cooling Air. This cold air is forced through the data hall into the Server Rack to dissipate heat via convection.
Application: Ideal for traditional, low-to-medium density workloads.
B. Liquid Cooling Pathway (Bottom Right)
Components:CDU (Coolant Distribution Unit) & TCS (Technology Cooling System).
Mechanism: Chilled water from the FWS enters the CDU, which contains an internal heat exchanger. Rather than mixing the waters, the CDU uses the facility’s chilled water to cool a isolated, highly-purified secondary loop (TCS). The TCS then pumps this Chilled Water/Coolant directly through specialized manifolds and fluid conduits into the liquid-cooled Server Rack (e.g., via direct-to-chip cold plates).
Application: Critical for high-density deployments, such as GPU-accelerated AI servers, where air cooling alone is insufficient.
Summary
The diagram demonstrates a highly efficient, modern Hybrid Data Center Cooling Architecture. By leveraging a centralized primary chilling system (CWS & FWS), the facility successfully bifurcates its cooling delivery: utilizing traditional air cooling (CRAC/CRAH) for standard infrastructure while concurrently deploying precise, high-efficiency liquid cooling (CDU & TCS) to sustain high-density AI server racks.
Architecture Walkthrough: High-Density AI Rack Monitoring Topology
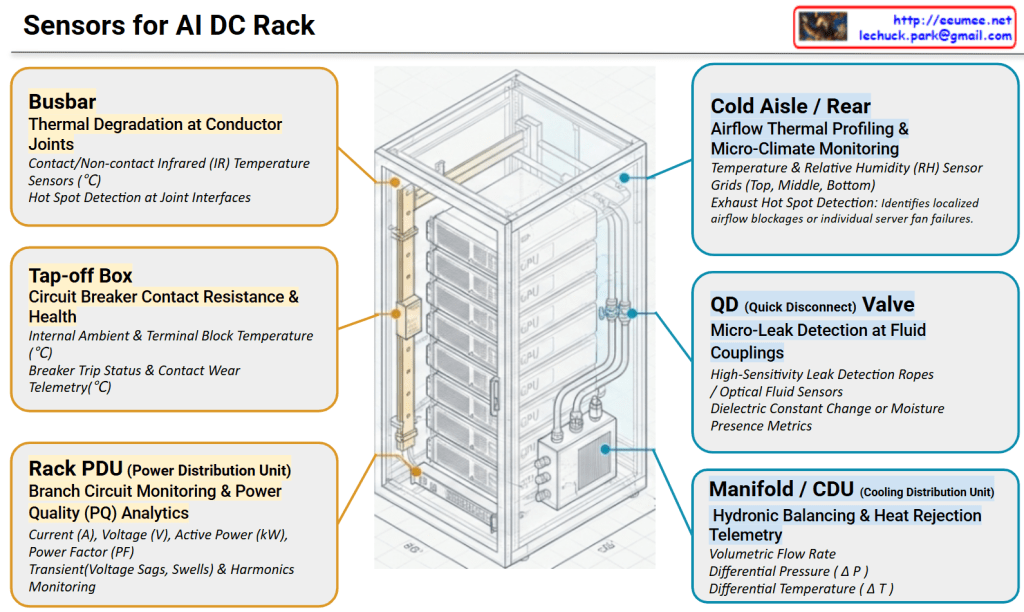
This diagram illustrates a comprehensive monitoring framework tailored for next-generation, high-density AI Data Centers. As rack power densities scale upward of 40kW to over 100kW, the integration of high-density power delivery and advanced liquid cooling demands a unified telemetry layer. The architecture symmetrically bifurcates these critical operations into two primary domains: Power Distribution & Electrical Infrastructure (left, in yellow) and Liquid Cooling & Thermal Management (right, in blue).
1. Power Infrastructure Telemetry (Left Domain)
Busbar (Top Left): Focuses on tracking surface temperatures at copper/aluminum busway joints using contact or non-contact infrared (IR) sensors. This mitigates the risk of thermal runaway caused by mechanical loosening or joint degradation.
Tap-off Box (Middle Left): Monitors the critical junction where power is tapped from the main busway to individual racks. Telemetry captures internal ambient temperatures and circuit breaker contact wear to prevent nuisance tripping under heavy GPU loads.
Rack PDU (Bottom Left): Delivers granular power quality (PQ) analytics. Beyond basic billing metrics, it utilizes high-speed sampling to capture transient events—such as voltage sags, swells, and total harmonic distortion (THD)—triggered by sudden LLM training state transitions.
Cold Aisle / Rear (Top Right): Provides 3D micro-climate profiling of the rack enclosure. Using sensor grids (top, middle, bottom), it tracks cold air intake and maps exhaust air behavior to instantaneously flag localized hot spots or individual server fan failures.
QD (Quick Disconnect) Valve (Middle Right): Positions high-sensitivity leak detection ropes or optical fluid sensors directly at the fluid mating interfaces of individual GPU server blades. This safeguards expensive IT assets against coolant escape.
Manifold / CDU (Bottom Right): Serves as the central hydronic balancing hub. By cross-referencing volumetric flow rate (LPM), differential pressure (Delta P), and differential temperature ($\Delta T$) across supply and return lines, the system continuously calculates the exact real-time heat rejection load in kW.
Executive Summary: The Imperative of High-Fidelity Infrastructure Telemetry
In a modern AI Data Center, the sheer density of accelerated computing clusters renders traditional, coarse facility monitoring completely obsolete. To ensure maximum uptime and operational efficiency, telemetry must undergo a paradigm shift governed by two critical vectors:
1. High Precision & High Resolution
Because GPU workloads scale from idle to maximum power in microseconds, sensors must feature ultra-high sampling rates (millisecond-level resolution for electrical transients) and high precision (milli-degree sensitivity for liquid thermal loops). Coarse, averaged data masks dangerous micro-spikes that degrade hardware components over time. High-resolution telemetry is the baseline requirement for capturing the true, unvarnished physical state of the infrastructure.
2. From Phenomena to Precursors (Omens)
Traditional data center monitoring is reactive—it alerts operators to a phenomenon (e.g., “Rack temperature has exceeded $85^\circ\text{C}$”), which usually means the failure has already occurred.
Conversely, high-fidelity, continuous data allows an AIOps engine to identify precursors or omens—the microscopic anomalies that precede a disaster. For instance:
A fractional, steady rise in busbar temperature relative to a static workload implies micro-vibration joint loosening (Thermal Degradation Precursor).
A subtle drift in the dielectric constant near a fluid coupling signals a microscopic weep before it transforms into a catastrophic spray (Leak Precursor).
A minor, localized spike in differential pressure (Delta P) combined with a micro-drop in flow rate alerts the system to initial strainer clogging before fluid starvation throttles the GPUs.
By capturing these subtle “signs” rather than waiting for the “symptom,” data centers can transition from reactive firefighting to fully automated, self-healing predictive maintenance.
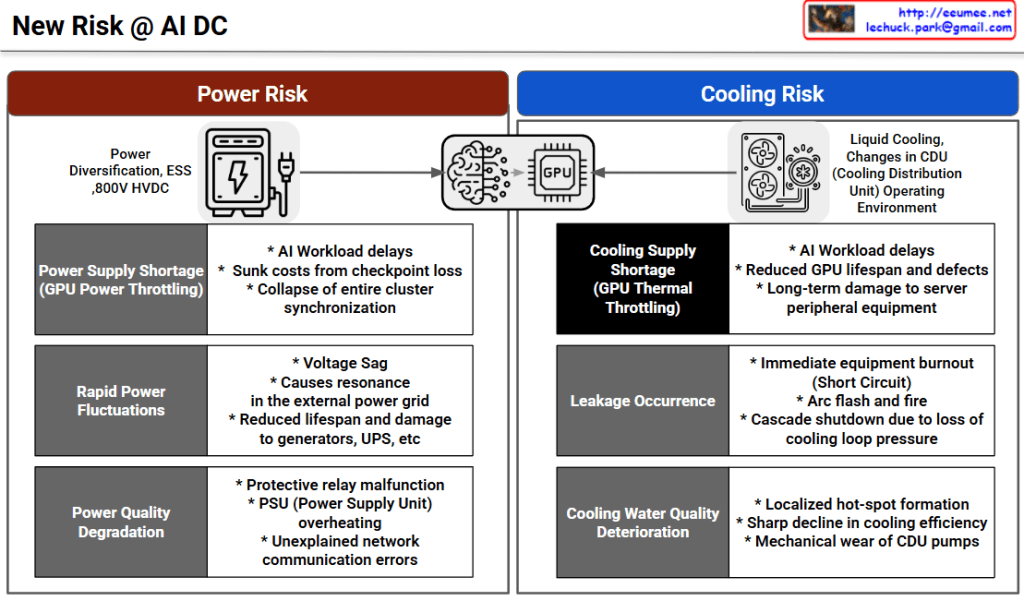
The image outlines the infrastructure challenges faced by modern AI Data Centers (AI DC), specifically focusing on the high demands placed on hardware like GPUs. It divides these challenges into two primary categories: Power Risk and Cooling Risk.
The central graphic illustrates that the core AI processing units (Brains/GPUs) are entirely dependent on these two foundational elements.
⚡ Power Risk
This section highlights issues related to power supply and infrastructure (such as Power Diversification, ESS, and 800V HVDC).
Power Supply Shortage (GPU Power Throttling): When the facility cannot provide enough power, GPUs slow down to compensate.
Impacts: Delays in AI workloads, financial losses due to lost data checkpoints, and the collapse of synchronization across the entire computing cluster.
Rapid Power Fluctuations: Sudden spikes or drops in the power supply.
Impacts: Voltage sag, electrical resonance in external grids, and reduced lifespan or physical damage to backup power systems like generators and UPS (Uninterruptible Power Supplies).
Power Quality Degradation: When the provided electricity is “noisy” or unstable.
Impacts: Malfunctions in protective electrical relays, overheating of server Power Supply Units (PSUs), and unexplained network communication errors.
❄️ Cooling Risk
This section focuses on the challenges of managing the massive heat generated by AI workloads, specifically looking at Liquid Cooling and changes in Cooling Distribution Unit (CDU) environments.
Cooling Supply Shortage (GPU Thermal Throttling): When the cooling system cannot remove heat fast enough, GPUs slow down to prevent melting.
Impacts: Delays in AI workloads, reduced lifespan and increased defects in GPUs, and long-term damage to surrounding server equipment.
Leakage Occurrence: Physical leaks in the liquid cooling system.
Impacts: Immediate equipment burnout (short circuits), risk of electrical arc flashes and fires, and cascading system shutdowns due to a loss of pressure in the cooling loop.
Cooling Water Quality Deterioration: When the liquid used for cooling becomes contaminated or degrades.
Impacts: Formation of localized “hot-spots” where cooling fails, a sharp decline in overall cooling efficiency, and mechanical wear and tear on the CDU pumps.
📝 Summary
AI Data Centers face critical new infrastructure risks divided into two main categories: supplying massive amounts of power and managing extreme heat.
Power-related risks (shortages, fluctuations, and poor quality) lead to severe workload delays, cluster synchronization failures, and damage to backup generators.
Cooling-related risks (insufficient cooling, leaks, and poor water quality) cause thermal throttling, severe hardware damage, and potentially catastrophic fires.
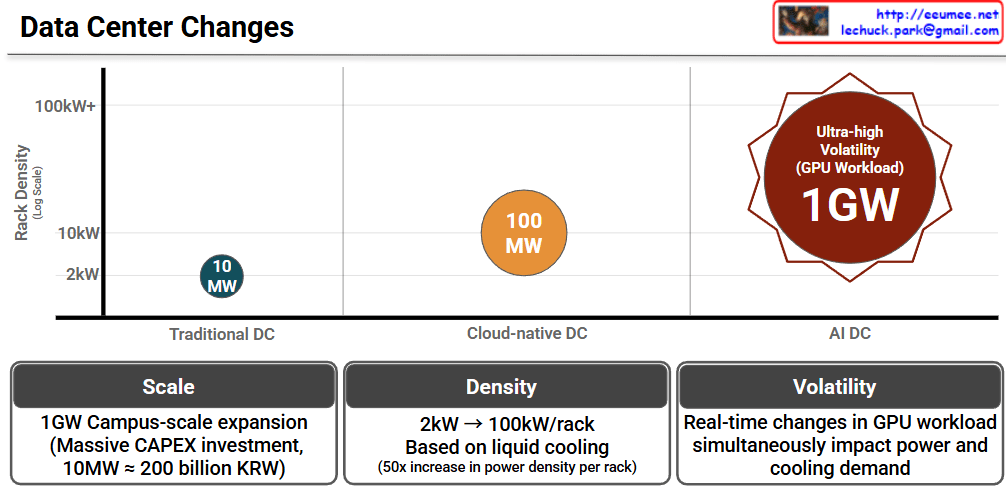
This infographic, titled “Data Center Changes,” visually explains how data center requirements are skyrocketing due to the shift from traditional computing to AI-driven workloads.
The chart compares three stages of data centers across two main metrics: Rack Density (how much power a single server rack consumes, shown on the vertical axis) and the overall Total Power Capacity (represented by the size and labels of the circles).
Traditional DC (Data Center): In the past, data centers ran at a very low rack density of around 2kW. The total power capacity required for a facility was relatively small, at around 10 MW.
Cloud-native DC: As cloud computing took over, the demands increased. Rack densities jumped to about 10kW, and the overall facility size grew to require around 100 MW of power.
AI DC: This is where we see a massive leap. Driven by heavy GPU workloads, AI data centers push rack densities beyond 100kW+. The scale of these facilities is enormous, demanding up to 1GW of power. The red starburst shape also highlights a new challenge: “Ultra-high Volatility,” meaning the power draw isn’t stable; it spikes violently depending on what the AI is processing.
The Three Core Challenges (Bottom Panels)
The bottom three panels summarize the key takeaways of transitioning to AI Data Centers:
Scale (Massive Investment): Building a 1GW “Campus-scale” AI data center requires astronomical capital expenditure (CAPEX). To put this into perspective, the chart notes that just 10MW costs roughly 200 billion KRW (South Korean Won). Scaling that to 1GW is a colossal financial undertaking.
Density (The Need for Liquid Cooling): Power density per rack is jumping from 2kW to 100kW—a 50x increase. Traditional air-conditioning cannot cool servers running this hot, meaning the industry must transition to advanced liquid cooling technologies.
Volatility (Unpredictable Demands): Unlike traditional servers that run at a steady hum, AI GPU workloads change in real-time. A sudden surge in computing tasks instantly spikes both the electricity needed to run the GPUs and the cooling power needed to keep them from melting.
Summary
Data centers are undergoing a massive transformation from Traditional (10MW) and Cloud (100MW) models to gigantic AI Data Centers requiring up to 1 Gigawatt (1GW) of power.
Because AI servers use powerful GPUs, power density per rack is increasing 50-fold (up to 100kW+), forcing a shift from traditional air cooling to advanced liquid cooling.
This AI infrastructure requires staggering financial investments (CAPEX) and must be designed to handle extreme, real-time volatility in both power and cooling demands.
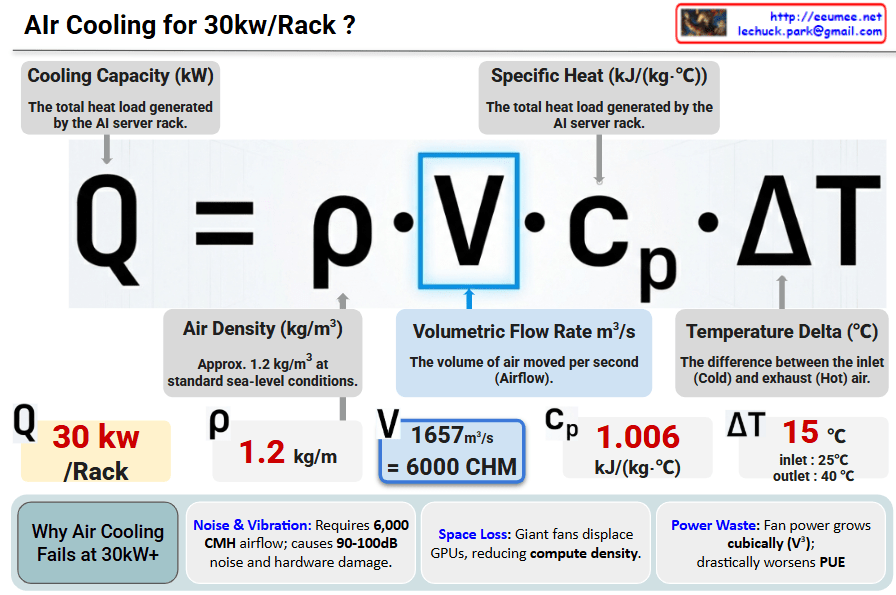
Power Waste: Fan power consumption grows cubically (V^3), causing a significant spike in PUE (Power Usage Effectiveness).
Conclusion: At 30kW/Rack, air cooling hits a physical and economic “wall”. Transitioning to Liquid Cooling is mandatory for next-generation AI Data Centers.
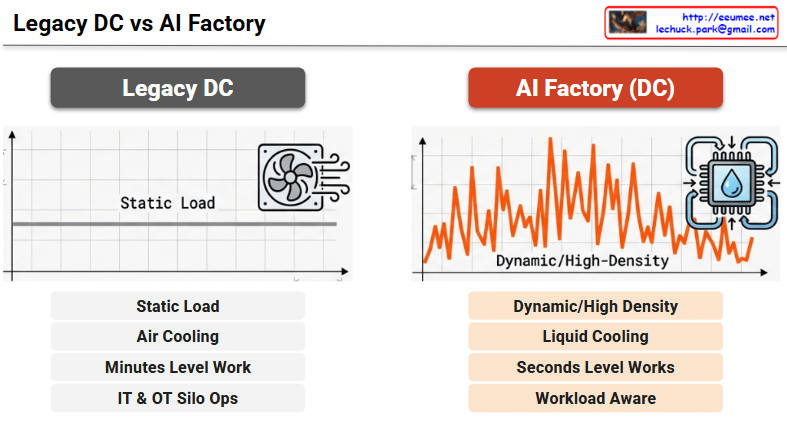
Static Load: The flat line on the graph indicates that power and compute demands are stable, continuous, and highly predictable.
Air Cooling: Traditional fan-based air cooling systems are sufficient to manage the heat generated by standard, lower-density server racks.
Minutes Level Work: System responses, resource provisioning, and facility adjustments generally occur on a scale of minutes.
IT & OT Silo Ops: Information Technology (servers, networking) and Operational Technology (power, cooling facilities) are managed independently in isolated silos, with no real-time data exchange.
2. AI Factory (DC)
Dynamic/High-Density: The volatile, jagged graph illustrates how AI workloads create extreme, rapid power spikes and demand highly dense computing resources.
Liquid Cooling: The immense heat output from high-performance AI chips necessitates advanced liquid cooling solutions (represented by the water drop and circulation arrows) to maintain thermal efficiency.
Seconds Level Works: The physical infrastructure must be highly agile, detecting and responding to sudden dynamic workload changes and thermal shifts within seconds.
Workload Aware: The facility dynamically adapts its cooling and power based on real-time AI computing needs. Establishing this requires robust “IT/OT Data Convergence” and the utilization of “High-Fidelity Data” as key components of a broader “Digitalization” strategy.
Summary
Legacy data centers are designed for predictable, static loads using traditional air cooling, with IT and facility operations (OT) isolated from one another.
AI Factories must handle highly volatile, high-density workloads, making liquid cooling and instantaneous, seconds-level infrastructure responses mandatory.
Transitioning to a true “Workload Aware” facility requires a strong “Digitalization” strategy centered around “IT/OT Data Convergence” and “High-Fidelity Data.”
 Lechuck Park