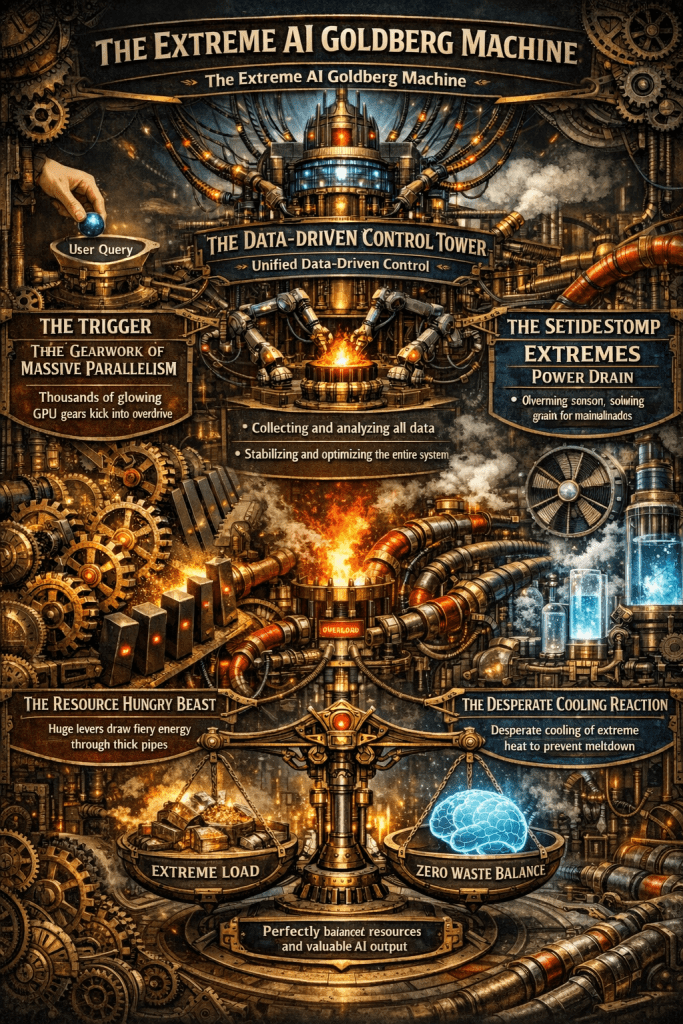
Peak Shaving with Data

Graph Interpretation: Power Peak Shaving in AI Data Centers

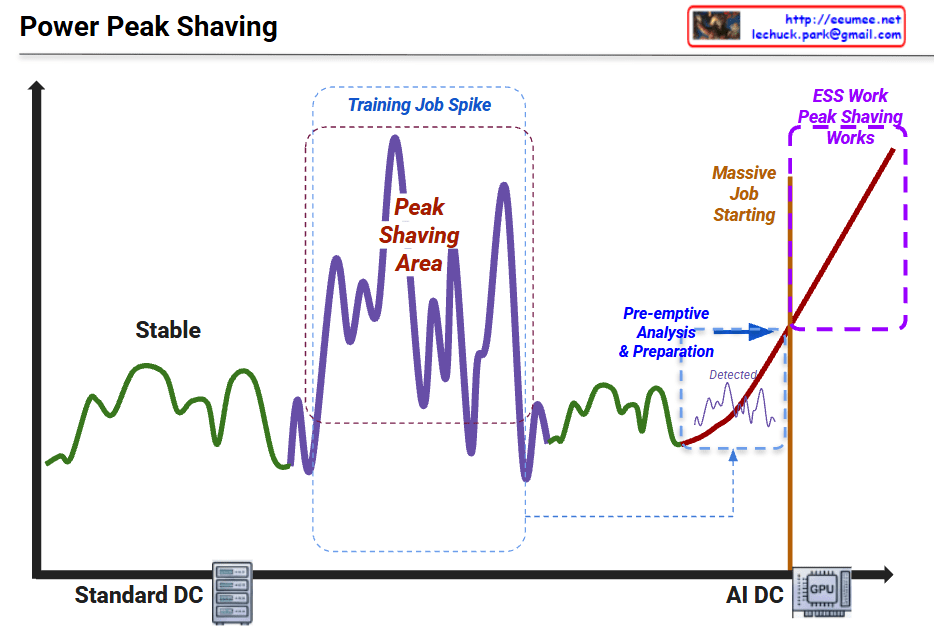
This graph illustrates the shift in power consumption patterns from traditional data centers to AI-driven data centers and the necessity of “Peak Shaving” strategies.

1. Standard DC (Green Line – Left)

  • Characteristics: Shows “Stable” power consumption.
  • Interpretation: Traditional server workloads are relatively predictable with low volatility. The power demand stays within a consistent range.

2. Training Job Spike (Purple Line – Middle)

  • Characteristics: Significant fluctuations labeled “Peak Shaving Area.”
  • Interpretation: During AI model training, power demand becomes highly volatile. The spikes (peaks) and valleys represent the intensive GPU cycles required during training phases.

3. AI DC & Massive Job Starting (Red Line – Right)

  • Characteristics: A sharp, vertical-like surge in power usage.
  • Interpretation: As massive AI jobs (LLM training, etc.) start, the power load skyrockets. The graph shows a “Pre-emptive Analysis & Preparation” phase where the system detects the surge before it hits the maximum threshold.

4. ESS Work & Peak Shaving (Purple Dotted Box – Top Right)

  • The Strategy: To handle the “Massive Job Starting,” the system utilizes ESS (Energy Storage Systems).
  • Action: Instead of drawing all power from the main grid (which could cause instability or high costs), the ESS discharges stored energy to “shave” the peak, smoothing out the demand and ensuring the AI DC operates safely.

Summary

  1. Volatility Shift: AI workloads (GPU-intensive) create much more extreme and unpredictable power spikes compared to standard data center operations.
  2. Proactive Management: Modern AI Data Centers require pre-emptive detection and analysis to prepare for sudden surges in energy demand.
  3. ESS Integration: Energy Storage Systems (ESS) are critical for “Peak Shaving,” providing the necessary power buffer to maintain grid stability and cost efficiency.

#DataCenter #AI #PeakShaving #EnergyStorage #ESS #GPU #PowerManagement #SmartGrid #TechInfrastructure #AIDC #EnergyEfficiency

with Gemini

AI Triangle


๐Ÿ“ The AI Triangle: Core Pillars of Evolution

1. Data: The Fuel for AI

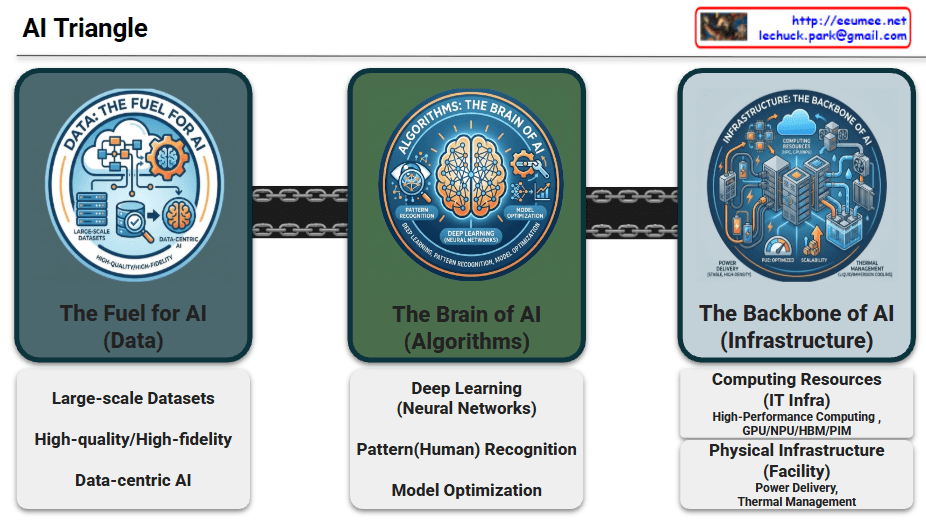
Data serves as the essential raw material that determines the intelligence and accuracy of AI models.

  • Large-scale Datasets: Massive volumes of information required for foundational training.
  • High-quality/High-fidelity: The emphasis on clean, accurate, and reliable data to ensure superior model performance.
  • Data-centric AI: A paradigm shift focusing on enhancing data quality rather than just iterating on model code.

2. Algorithms: The Brain of AI

Algorithms provide the logical framework and mathematical structures that allow machines to learn from data.

  • Deep Learning (Neural Networks): Multi-layered architectures inspired by the human brain to process complex information.
  • Pattern Recognition: The ability to identify hidden correlations and make predictions from raw inputs.
  • Model Optimization: Techniques to improve efficiency, reduce latency, and minimize computational costs.

3. Infrastructure: The Backbone of AI

The physical and digital foundation that enables massive computations and ensures system stability.

  • Computing Resources (IT Infra):
    • HPC & Accelerators: High-performance clusters utilizing GPUs, NPUs, and HBM/PIM for parallel processing.
  • Physical Infrastructure (Facilities):
    • Power Delivery: Reliable, high-density power systems including UPS, PDU, and smart energy management.
    • Thermal Management: Advanced cooling solutions like Liquid Cooling and Immersion Cooling to handle extreme heat from AI chips.
    • Scalability & PUE: Focus on sustainable growth and maximizing energy efficiency (Power Usage Effectiveness).

๐Ÿ“ Summary

  1. The AI Triangle represents the vital synergy between high-quality Data, sophisticated Algorithms, and robust Infrastructure.
  2. While data fuels the model and algorithms provide the logic, infrastructure acts as the essential backbone that supports massive scaling and operational reliability.
  3. Modern AI evolution increasingly relies on advanced facility management, specifically optimized power delivery and high-efficiency cooling, to sustain next-generation workloads.

#AITriangle #AIInfrastructure #DataCenter #DeepLearning #GPU #LiquidCooling #DataCentric #Sustainability #PUE #TechArchitecture

With Gemini

AI Workload with Power/Cooling


Breakdown of the “AI Workload with Power/Cooling” Diagram

This diagram illustrates the flow of Power and Cooling changes throughout the execution stages of an AI workload. It divides the process into five phases, explaining how data center infrastructure (Power, Cooling) reacts and responds from the start to the completion of an AI job.

Here are the key details for each phase:

1. Pre-Run (Preparation Phase)

  • Work Job: Job Scheduling.
  • Key Metric: Requested TDP (Thermal Design Power). It identifies beforehand how much heat the job is expected to generate.
  • Power/Cooling: PreCooling. This is a proactive measure where cooling levels are increased based on the predicted TDP before the job actually starts and heat is generated.

2. Init / Ramp-up (Initialization Phase)

  • Work Job: Context Loading. The process of loading AI models and data into memory.
  • Key Metric: HBM Power Usage. The power consumption of High Bandwidth Memory becomes a key indicator.
  • Power/Cooling: As VRAM operates, Power consumption begins to rise (Power UP).

3. Execution (Execution Phase)

  • Work Job: Kernel Launch. The point where actual computation kernels begin running on the GPU.
  • Key Metric: Power Draw. The actual amount of electrical power being drawn.
  • Power/Cooling: Instant Power Peak. A critical moment where power consumption spikes rapidly as computation begins in earnest. The stability of the power supply unit (PSU) is vital here.

4. Sustained (Heavy Load Phase)

  • Work Job: Heavy Load. Continuous heavy computation is in progress.
  • Key Metric: Thermal/Power Cap. Monitoring against set limits for temperature or power.
  • Power/Cooling:
    • Throttling: If “What-if” scenarios occur (such as power supply leaks or reaching a Thermal Over-Limit), protection mechanisms activate. DVFS (Dynamic Voltage and Frequency Scaling) triggers Throttling (Down Clock) to protect the hardware.

5. Cooldown (Completion Phase)

  • Work Job: Job Complete.
  • Key Metric: Power State. The state changes to “Change Down.”
  • Power/Cooling: Although the job is finished, Residual Heat remains in the hardware. Instead of shutting off fans immediately, Ramp-down Control is used to cool the equipment gradually and safely.

Summary & Key Takeaways

This diagram demonstrates that managing AI infrastructure goes beyond simply “running a job.” It requires active control of the infrastructure (e.g., PreCooling, Throttling, Ramp-down) to handle the specific characteristics of AI workloads, such as rapid power spikes and high heat generation.

Phase 1 (PreCooling) for proactive heat management and Phase 4 (Throttling) for hardware protection are the core mechanisms determining the stability and efficiency of an AI Data Center.


#AI #ArtificialIntelligence #GPU #HPC #DataCenter #AIInfrastructure #DataCenterOps #GreenIT #SustainableTech #SmartCooling #PowerEfficiency #PowerManagement #ThermalEngineering #TDP #DVFS #Semiconductor #SystemArchitecture #ITOperations

With Gemini

Data Center Shift with AI

Data Center Shift with AI

This diagram illustrates how data centers are transforming as they enter the AI era.

๐Ÿ“… Timeline of Technological Evolution

The top section shows major technology revolutions and their timelines:

  • Internet ’95 (Internet era)
  • Mobile ’07 (Mobile era)
  • Cloud ’10 (Cloud era)
  • Blockchain
  • AI(LLM) ’22 (Large Language Model-based AI era)

๐Ÿข Traditional Data Center Components

Conventional data centers consisted of the following core components:

  • Software
  • Server
  • Network
  • Power
  • Cooling

These were designed as relatively independent layers.

๐Ÿš€ New Requirements in the AI Era

With the introduction of AI (especially LLMs), data centers require specialized infrastructure:

  1. LLM Model – Operating large language models
  2. GPU – High-performance graphics processing units (essential for AI computations)
  3. High B/W – High-bandwidth networks (for processing large volumes of data)
  4. SMR/HVDC – Switched-Mode Rectifier/High-Voltage Direct Current power systems
  5. Liquid/CDU – Liquid cooling/Cooling Distribution Units (for cooling high-heat GPUs)

๐Ÿ”— Key Characteristic of AI Data Centers: Integrated Design

The circular connection in the center of the diagram represents the most critical feature of AI data centers:

Tight Interdependency between SW/Computing/Network โ†” Power/Cooling

Unlike traditional data centers, in AI data centers:

  • GPU-based computing consumes enormous power and generates significant heat
  • High B/W networks consume additional power during massive data transfers between GPUs
  • Power systems (SMR/HVDC) must stably supply high power density
  • Liquid cooling (Liquid/CDU) must handle high-density GPU heat in real-time

These elements must be closely integrated in design, and optimizing just one element cannot guarantee overall system performance.

๐Ÿ’ก Key Message

AI workloads require moving beyond the traditional layer-by-layer independent design approach of conventional data centers, demanding that computing-network-power-cooling be designed as one integrated system. This demonstrates that a holistic approach is essential when building AI data centers.


๐Ÿ“ Summary

AI data centers fundamentally differ from traditional data centers through the tight integration of computing, networking, power, and cooling systems. GPU-based AI workloads create unprecedented power density and heat generation, requiring liquid cooling and HVDC power systems. Success in AI infrastructure demands holistic design where all components are co-optimized rather than independently engineered.

#AIDataCenter #DataCenterEvolution #GPUInfrastructure #LiquidCooling #AIComputing #LLM #DataCenterDesign #HighPerformanceComputing #AIInfrastructure #HVDC #HolisticDesign #CloudComputing #DataCenterCooling #AIWorkloads #FutureOfDataCenters

With Claude

CDU ( OCP Project Deschutes ) Numbers

OCP CDU (Deschutes) Standard Overview

The provided visual summarizes the key performance metrics of the CDU (Cooling Distribution Unit) that adheres to the OCP (Open Compute Project) ‘Project Deschutes’ specification. This CDU is designed for high-performance computing environments, particularly for massive-scale liquid cooling of AI/ML workloads.


Key Performance Indicators

  • System Availability: The primary target for system availability is 99.999%. This represents an extremely high level of reliability, with less than 5 minutes and 15 seconds of downtime per year.
  • Thermal Load Capacity: The CDU is designed to handle a thermal load of up to 2,000 kW, which is among the highest thermal capacities in the industry.
  • Power Usage: The CDU itself consumes 74 kW of power.
  • IT Flow Rate: It supplies coolant to the servers at a rate of 500 GPM (approximately 1,900 LPM).
  • Operating Pressure: The overall system operating pressure is within a range of 0-130 psig (approximately 0-900 kPa).
  • IT Differential Pressure: The pressure difference required on the server side is 80-90 psi (approximately 550-620 kPa).
  • Approach Temperature: The approach temperature, a key indicator of heat exchange efficiency, is targeted at โ‰ค3โˆ˜C. A lower value is better, as it signifies more efficient heat removal.

Why Cooling is Crucial for GPU Performance

Cooling has a direct and significant impact on GPU performance and stability. Because GPUs are highly sensitive to heat, if they are not maintained within an optimal temperature range, they will automatically reduce their performance through a process called thermal throttling to prevent damage.

The ‘Project Deschutes’ CDU is engineered to prevent this by handling a massive thermal load of 2,000 kW with a powerful 500 GPM flow rate and a low approach temperature of โ‰ค3โˆ˜C. This robust cooling capability ensures that GPUs can operate at their maximum potential without being limited by heat, which is essential for maximizing performance in demanding AI workloads.

with Gemini

CXL ( Compute express link )

Traditional CPU-GPU vs CXL Key Comparison

๐Ÿ”ด PCIe System Inefficiencies

Separated Memory Architecture

  • Isolated Memory: CPU(DDR4) โ†” GPU(VRAM) completely separated
  • Mandatory Data Copying: CPU Memory โ†’ PCIe โ†’ GPU Memory โ†’ Computation โ†’ Result Copy
  • PCIe Bandwidth Bottleneck: Limited to 64GB/s maximum

Major Overheads

  • Memory Copy Latency: Tens of ms to seconds for large data transfers
  • Synchronization Wait: CPU cache flush + GPU synchronization
  • Memory Duplication: Same data stored in both CPU and GPU memory

๐ŸŸข CXL Core Improvements

1. Unified Memory Architecture

Before: CPU [Memory] โ†PCIeโ†’ [Memory] GPU (Separated)
After: CPU โ†CXLโ†’ GPU โ†’ Shared Memory Pool (Unified)

2. Zero-Copy & Hardware Cache Coherency

  • Eliminates Memory Copying: Data access through pointer sharing only
  • Automatic Synchronization: CXL controller ensures cache coherency at HW level
  • Real-time Sharing: GPU can immediately access CPU-modified data

3. Performance Improvements

MetricPCIe 4.0CXL 2.0Improvement
Bandwidth64 GB/s128 GB/s2x
Latency1-2ฮผs200-400ns5-10x
Memory CopyRequiredEliminatedComplete Removal

๐Ÿš€ Practical Benefits

AI/ML: 90% reduction in training data loading time, larger model processing capability
HPC: Real-time large dataset exchange, memory constraint elimination
Cloud: Maximized server resource efficiency through memory pooling


๐Ÿ’ก CXL Core Innovations

  1. Zero-Copy Sharing – Eliminates physical data movement
  2. HW-based Coherency – Complete removal of software synchronization overhead
  3. Memory Virtualization – Scalable memory pool beyond physical constraints
  4. Heterogeneous Optimization – Seamless integration of CPU, GPU, FPGA, etc.

The key technical improvements of CXL – Zero-Copy sharing and hardware-based cache coherency – are emphasized as the most revolutionary aspects that fundamentally solve the traditional PCIe bottlenecks.

With Claude

CPU with GPU (legacy)

This image is a diagram explaining the data transfer process between CPU and GPU. Let me interpret the main components and processes.

Key Components

Hardware:

  • CPU: Main processor
  • GPU: Graphics processing unit (acting as accelerator)
  • DRAM: Main memory on CPU side
  • VRAM: Dedicated memory on GPU side
  • PCIe: High-speed interface connecting CPU and GPU

Software/Interfaces:

  • Software (Driver/Kernel): Driver/kernel controlling hardware
  • DMA (Direct Memory Access): Direct memory access

Data Transfer Process (4 Steps)

Step 1 – Data Preparation

  • CPU first writes data to main memory (DRAM)

Step 2 – DMA Transfer

  • Copy data from main memory to GPU’s VRAM via PCIe
  • โš ๏ธ Wait Time: Cache Flush – CPU cache is flushed before accelerator can access the data

Step 3 – Task Execution

  • GPU performs tasks using the copied data

Step 4 – Result Copy

  • After task completion, GPU copies results back to main memory
  • โš ๏ธ Wait Time: Synchronization – CPU must perform another synchronization operation before it can read the results

Performance Considerations

This diagram shows the major bottlenecks in CPU-GPU data transfer:

  • Memory copy overhead: Data must be copied twice (CPUโ†’GPU, GPUโ†’CPU)
  • Synchronization wait times: Synchronization required at each step
  • PCIe bandwidth limitations: Physical constraints on data transfer speed

CXL-based Improvement Approach

CXL (Compute Express Link) shown on the right side of the diagram represents next-generation technology for improving this data transfer process, offering an alternative approach to solve the complex 4-step process and related performance bottlenecks.


Summary

This diagram demonstrates how CPU-GPU data transfer involves a complex 4-step process with performance bottlenecks caused by memory copying overhead, synchronization wait times, and PCIe bandwidth limitations. CXL is presented as a next-generation technology solution that can overcome the limitations of traditional data transfer methods.

With Claude