Just, made by talking with Gemini.
The Computing for the Fair Human Life.
Just, made by talking with Gemini.
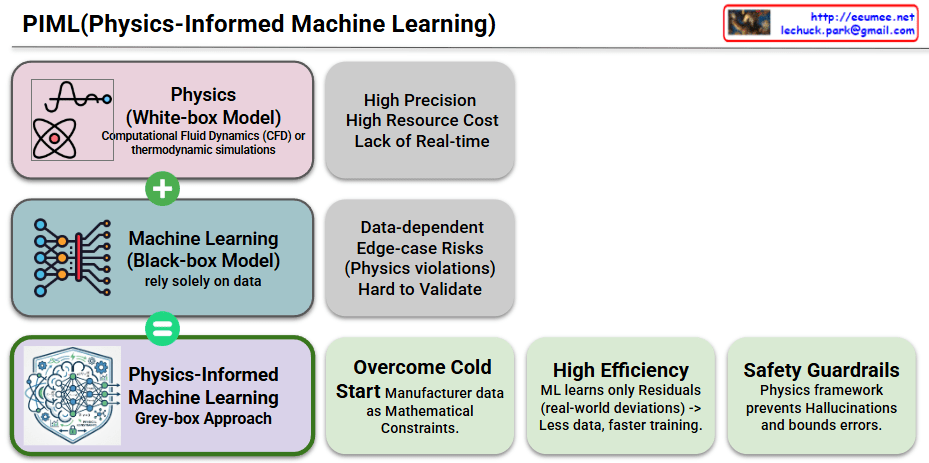
PIML (Physics-Informed Machine Learning) Explained
This diagram illustrates how PIML (Physics-Informed Machine Learning) combines the strengths of physics-based models and data-driven machine learning to create a more powerful and reliable approach.
1. Top: Physics (White-box Model)
2. Middle: Machine Learning (Black-box Model)
3. Bottom: Physics-Informed Machine Learning (Grey-box Approach)
#AI #PIML #MachineLearning #Physics #HybridAI #DataScience #ExplainableAI #XAI #ComputationalPhysics #Simulation
with Gemini
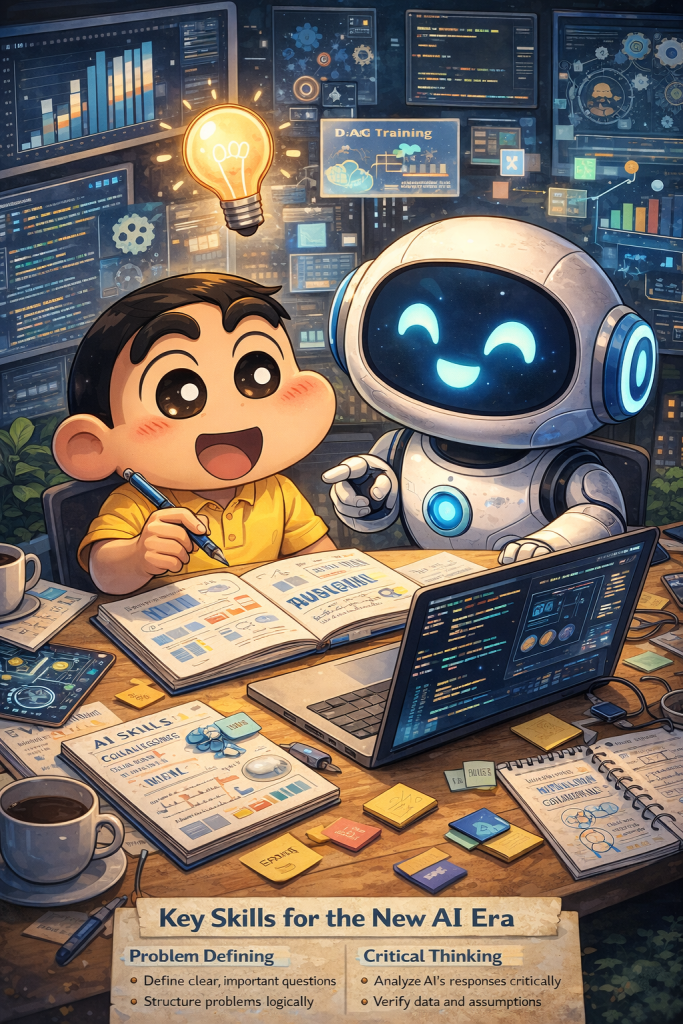
“Smart people don’t just use AI.
They think, question, and grow with AI.”
With ChatGPT
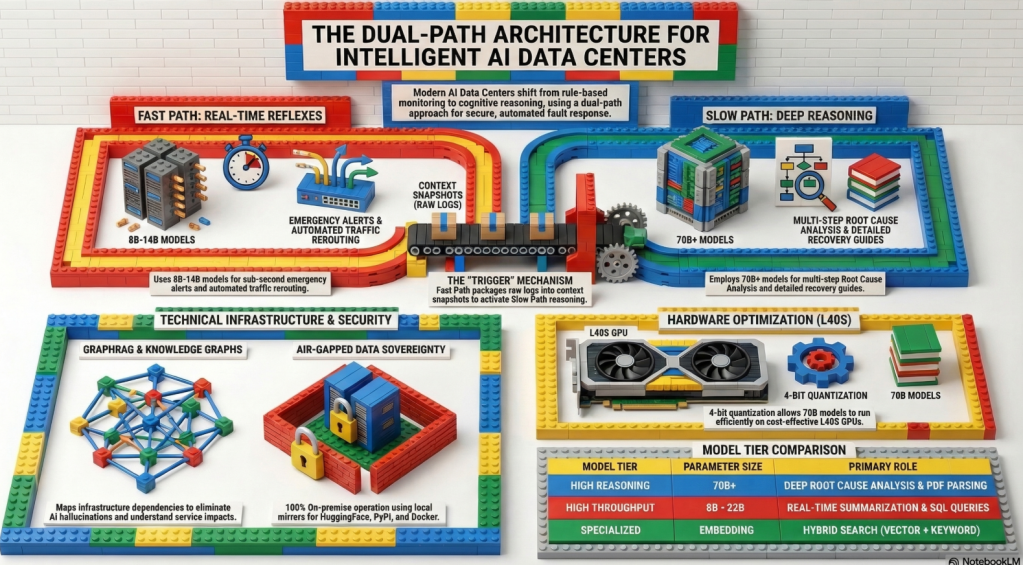
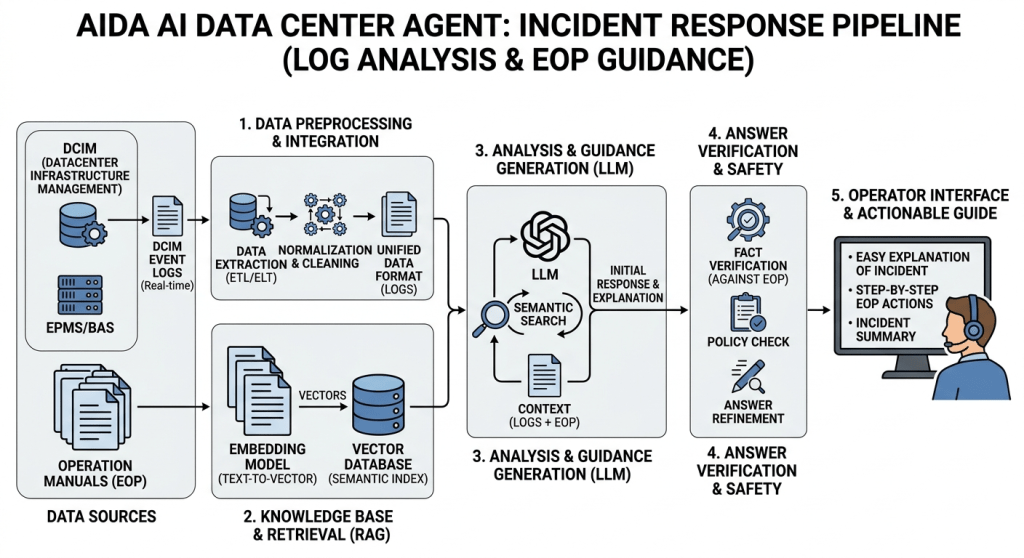
The proposed AI DC Intelligent Incident Response Platform upgrades traditional data center monitoring to an “Autonomous Operations” system within a secure, air-gapped on-premise environment. It features a Dual-Path architecture that utilizes lightweight LLMs for real-time automated alerts (Fast Path) and high-performance LLMs with GraphRAG for deep root-cause analysis (Slow Path). By structuring fragmented manuals and comprehensively mapping infrastructure dependencies, this system significantly reduces recovery time (MTTR) and provides a highly scalable, cost-effective solution for hyper-scale AI data centers
With NotebookLM
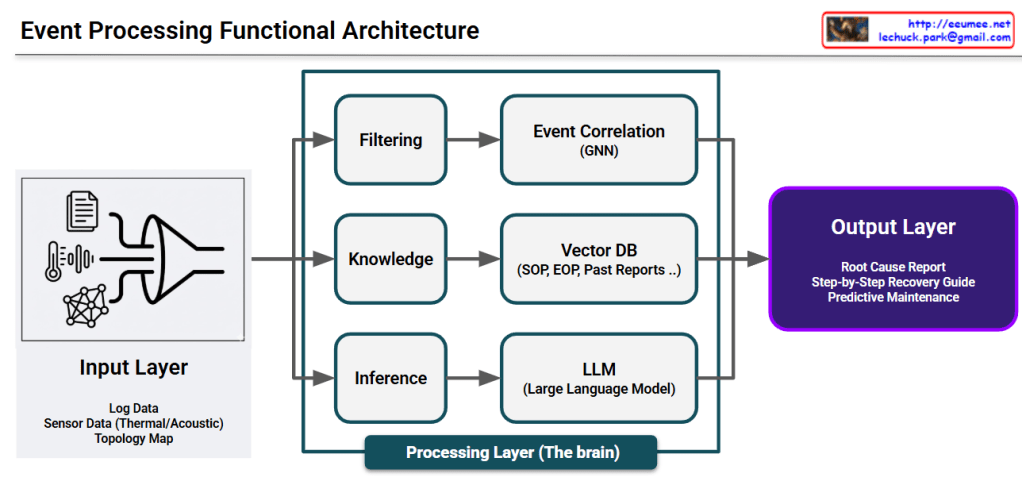
This image illustrates a Data Processing Pipeline (Architecture) where raw data is ingested, analyzed through an AI engine, and converted into actionable business intelligence.
This represents the raw data collected from various sources within the infrastructure:
The final results generated by the analysis, designed to provide immediate value to operators:
The diagram effectively visualizes the transition from complex raw data to actionable intelligence. It highlights the core value of an AI-driven platform: reducing cognitive load for human operators by providing clear, data-backed directions for maintenance and recovery.
#AI #DataCenter #PredictiveMaintenance #DataAnalytics #SmartInfrastructure #RootCauseAnalysis #DigitalTransformation #OperationsOptimization
With Gemini
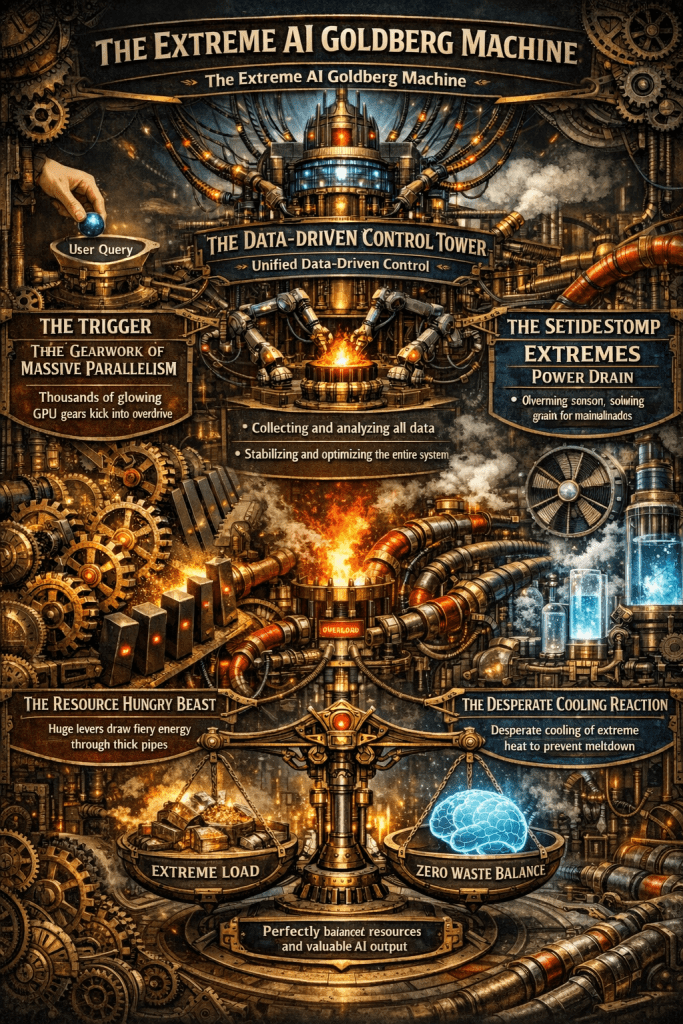
A single AI response triggers a massive chain reaction of compute, power, and cooling.
Only unified, data-driven control can stabilize this fragile system and eliminate waste.
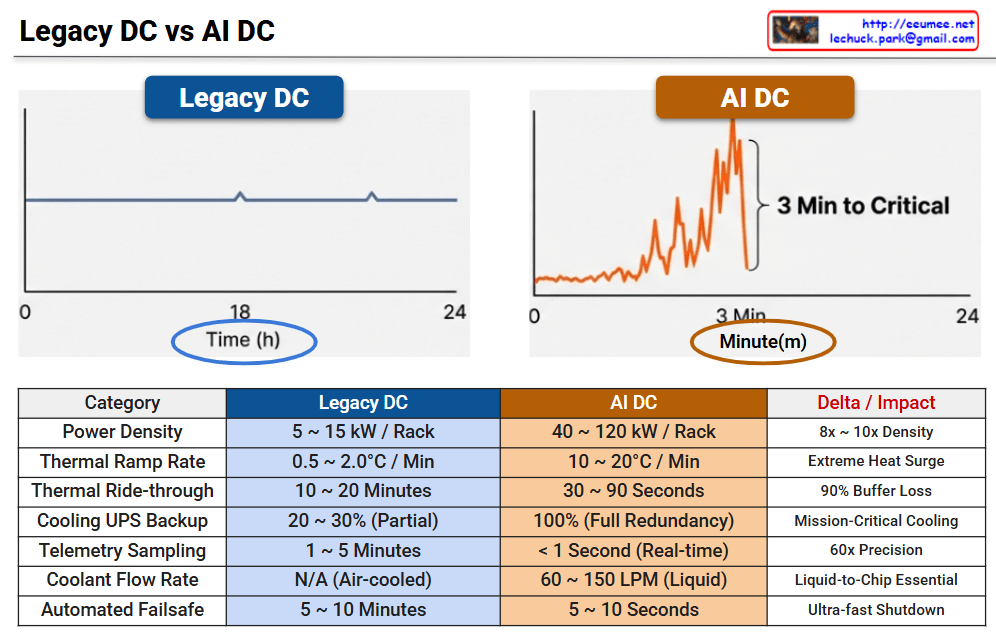
This infographic illustrates the radical shift in operational paradigms between Legacy Data Centers and AI Data Centers, highlighting the transition from “Human-Speed” steady-state management to “Machine-Speed” real-time automation.
| Category | Legacy DC | AI DC | Delta / Impact |
| Power Density | 5 ~ 15 kW / Rack | 40 ~ 120 kW / Rack | 8x ~ 10x Density |
| Thermal Ramp Rate | 0.5 ~ 2.0°C / Min | 10 ~ 20°C / Min | Extreme Heat Surge |
| Thermal Ride-through | 10 ~ 20 Minutes | 30 ~ 90 Seconds | 90% Buffer Loss |
| Cooling UPS Backup | 20 ~ 30% (Partial) | 100% (Full Redundancy) | Mission-Critical Cooling |
| Telemetry Sampling | 1 ~ 5 Minutes | < 1 Second (Real-time) | 60x Precision |
| Coolant Flow Rate | N/A (Air-cooled) | 60 ~ 150 LPM (Liquid) | Liquid-to-Chip Essential |
| Automated Failsafe | 5 ~ 10 Minutes | 5 ~ 10 Seconds | Ultra-fast Shutdown |
With rack densities reaching 120 kW, air cooling is no longer viable. The shift to Liquid-to-Chip cooling with flow rates up to 150 LPM is mandatory to manage the 10–20°C per minute thermal ramp rates.
In a Legacy DC, operators have a 20-minute “Golden Hour” to respond to cooling failures. In an AI DC, this buffer collapses to seconds, making sub-second telemetry and automated failsafe protocols the only way to prevent hardware damage.
#AIDataCenter #AIOps #LiquidCooling #InfrastructureOptimization #DataCenterDesign #HighDensityComputing #ThermalManagement #DigitalTransformation
With Gemini
