History always alternates between periods of stability and turbulence. In turbulent times, management and operations become critical, since small decisions can determine survival. This shift mirrors the move from static, stability-focused maintenance to agile, data-driven, and adaptive operations.
This diagram illustrates the “Computing Evolutions” from the perspective of data’s core attributes development.
Top: Core Data Properties
Data: Foundation of digital information composed of 0s and 1s
Store: Data storage technology
Transfer: Data movement and network technology
Computing: Data processing and computational technology
AI Era: The convergence of all these technologies into the artificial intelligence age
Bottom: Evolution Stages Centered on Each Property
Storage-Centric Era: Data Center
Focus on large-scale data storage and management
Establishment of centralized server infrastructure
Transfer-Centric Era: Internet
Dramatic advancement in network technology
Completion of global data transmission infrastructure
“Data Ready”: The point when vast amounts of data became available and accessible
Computing-Centric Era: Cloud Computing
Democratization and scalability of computing power
Development of GPU-based parallel processing (blockchain also contributed)
“Infra Ready”: The point when large-scale computing infrastructure was prepared
Convergence to AI Era With data prepared through the Internet and computing infrastructure ready through the cloud, all these elements converged to enable the current AI era. This evolutionary process demonstrates how each technological foundation systematically contributed to the emergence of artificial intelligence.
This image shows a CDU (Coolant Distribution Unit) Metrics & Control System diagram illustrating the overall structure. The system can be organized as follows:
System Structure
Upper Section: CDU Structure
First Loop: CPU with Coolant Distribution Unit
Second Main Loop: Row Manifold and Rack Manifold configuration
Process Chill Water Supply/Return: Process chilled water circulation system
Lower Section: Data Collection & Control Devices
Control Devices:
Pump (Pump RPM, Rate of max speed)
Valve (Valve Open %)
Sensor Configuration:
Temperature & Pressure Sensors on manifolds
Supply System:
Rack Water Supply/Return
Main Control Methods
1. Fixed Pressure Control (Fixed Pressure Drop)
Primary Method: Maintaining fixed pressure drop between rack supply-return
Primary Method: Maintaining constant approach temperature
Alternatives: Fixed open, fixed secondary supply temperature control
Summary
This CDU system provides precise cooling control for data centers through dual management of pressure and temperature. The system integrates sensor feedback from manifolds with pump and valve control to maintain optimal cooling conditions across server racks.
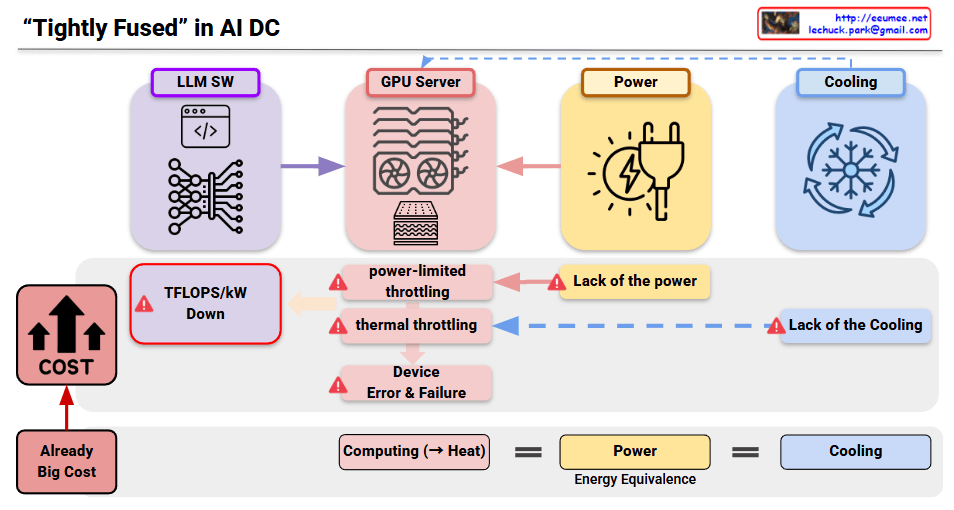
This diagram illustrates a “Tightly Fused” AI datacenter architecture showing the interdependencies between system components and their failure points.
System Components
LLM SW: Large Language Model Software
GPU Server: Computing infrastructure with cooling fans
Power: Electrical power supply system
Cooling: Thermal management system
Critical Issues
1. Power Constraints
Lack of power leads to power-limited throttling in GPU servers
Results in decreased TFLOPS/kW (computational efficiency per watt)
2. Cooling Limitations
Insufficient cooling causes thermal throttling
Increases risk of device errors and failures
3. Cost Escalation
Already high baseline costs
System bottlenecks drive costs even higher
Core Principle
The bottom equation demonstrates the fundamental relationship: Computing (→ Heat) = Power = Cooling
This shows that computational workload generates heat, requiring equivalent power supply and cooling capacity to maintain optimal performance.
Summary
This diagram highlights how AI datacenters require perfect balance between computing, power, and cooling systems – any bottleneck in one area cascades into performance degradation and cost increases across the entire infrastructure.
This image presents a diagram titled “New Era of Digitals” that illustrates the evolution of computing paradigms.
Overall Structure:
The diagram shows a progression from left to right, transitioning from being “limited by Humans” to achieving “Everything by Digitals.”
Key Stages:
Human Desire: The process begins with humans’ fundamental need to “wanna know it clearly,” representing our desire for understanding and knowledge.
Rule-Based Era (1000s):
Deterministic approach
Using Logics and Rules
Automation with Specific Rules
Record with a human recognizable format
Data-Driven Era:
Probabilistic approach (Not 100% But OK)
Massive Computing (Energy Resource)
Neural network-like structures represented by interconnected nodes
Core Message:
The diagram illustrates how computing has evolved from early systems that relied on human-defined explicit rules and logic to modern data-driven, probabilistic approaches. This represents the shift toward AI and machine learning, where we achieve “Not 100% But OK” results through massive computational resources rather than perfect deterministic rules.
The transition shows how we’ve moved from systems that required everything to be “human recognizable” to systems that can process and understand patterns beyond direct human comprehension, marking the current digital revolution where algorithms and data-driven approaches can handle complexity that exceeds traditional rule-based systems.
The provided visual summarizes the key performance metrics of the CDU (Cooling Distribution Unit) that adheres to the OCP (Open Compute Project) ‘Project Deschutes’ specification. This CDU is designed for high-performance computing environments, particularly for massive-scale liquid cooling of AI/ML workloads.
Key Performance Indicators
System Availability: The primary target for system availability is 99.999%. This represents an extremely high level of reliability, with less than 5 minutes and 15 seconds of downtime per year.
Thermal Load Capacity: The CDU is designed to handle a thermal load of up to 2,000 kW, which is among the highest thermal capacities in the industry.
Power Usage: The CDU itself consumes 74 kW of power.
IT Flow Rate: It supplies coolant to the servers at a rate of 500 GPM (approximately 1,900 LPM).
Operating Pressure: The overall system operating pressure is within a range of 0-130 psig (approximately 0-900 kPa).
IT Differential Pressure: The pressure difference required on the server side is 80-90 psi (approximately 550-620 kPa).
Approach Temperature: The approach temperature, a key indicator of heat exchange efficiency, is targeted at ≤3∘C. A lower value is better, as it signifies more efficient heat removal.
Why Cooling is Crucial for GPU Performance
Cooling has a direct and significant impact on GPU performance and stability. Because GPUs are highly sensitive to heat, if they are not maintained within an optimal temperature range, they will automatically reduce their performance through a process called thermal throttling to prevent damage.
The ‘Project Deschutes’ CDU is engineered to prevent this by handling a massive thermal load of 2,000 kW with a powerful 500 GPM flow rate and a low approach temperature of ≤3∘C. This robust cooling capability ensures that GPUs can operate at their maximum potential without being limited by heat, which is essential for maximizing performance in demanding AI workloads.
This illustration visualizes the evolution of data centers, contrasting the traditionally separated components with the modern AI data center where software, compute, network, and crucially, power and cooling systems are ‘tightly fused’ together. It emphasizes how power and advanced cooling are organically intertwined with GPU and memory, directly impacting AI performance and highlighting their inseparable role in meeting the demands of high-performance AI. This tight integration symbolizes a pivotal shift for the modern AI era.